blog
DevOps Database Glossary for the MySQL Novice

When you need to work with a database that you are not 100% familiar with, you can be overwhelmed by the hundreds of metrics available. Which ones are the most important? What should I monitor, and why? What patterns in metrics should ring some alarm bells? In this blog post we will try to introduce you to some of the most important metrics to keep an eye on while running MySQL or MariaDB in production.
Com_* Status Counters
We will start with Com_* counters – those define the number and types of queries that MySQL executes. We are talking here about query types like SELECT, INSERT, UPDATE and many more. It is quite important to keep an eye on those as sudden spikes or unexpected drops may suggest something went wrong in the system.
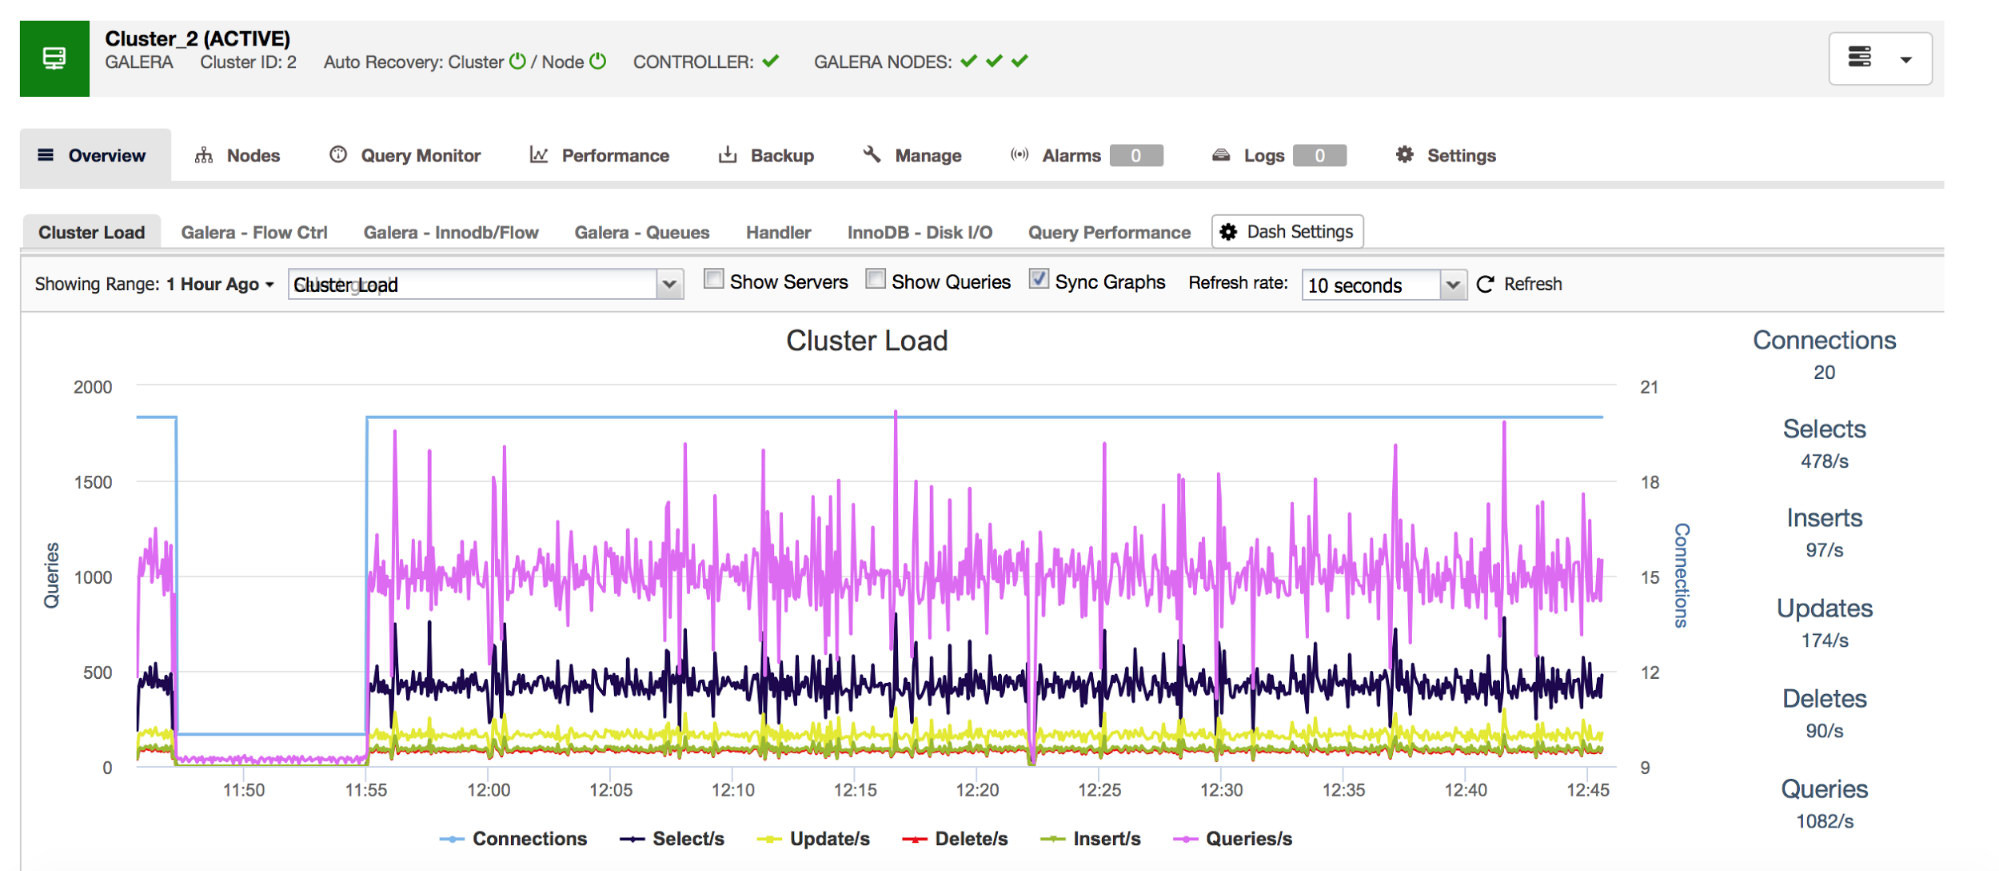
Our all-inclusive database management system ClusterControl shows you this data related to the most common query types in the “Overview” section.
Handler_* Status Counters
A category of metrics you should keep an eye on are Handler_* counters in MySQL. Com_* counters tell you what kind of queries your MySQL instance is executing but one SELECT can be totally different to another – SELECT could be a primary key lookup, it can be also a table scan if an index cannot be used. Handlers tell you how MySQL access stored data – this is very useful for investigating the performance issues and assessing if there is a possible gain in query review and additional indexing.
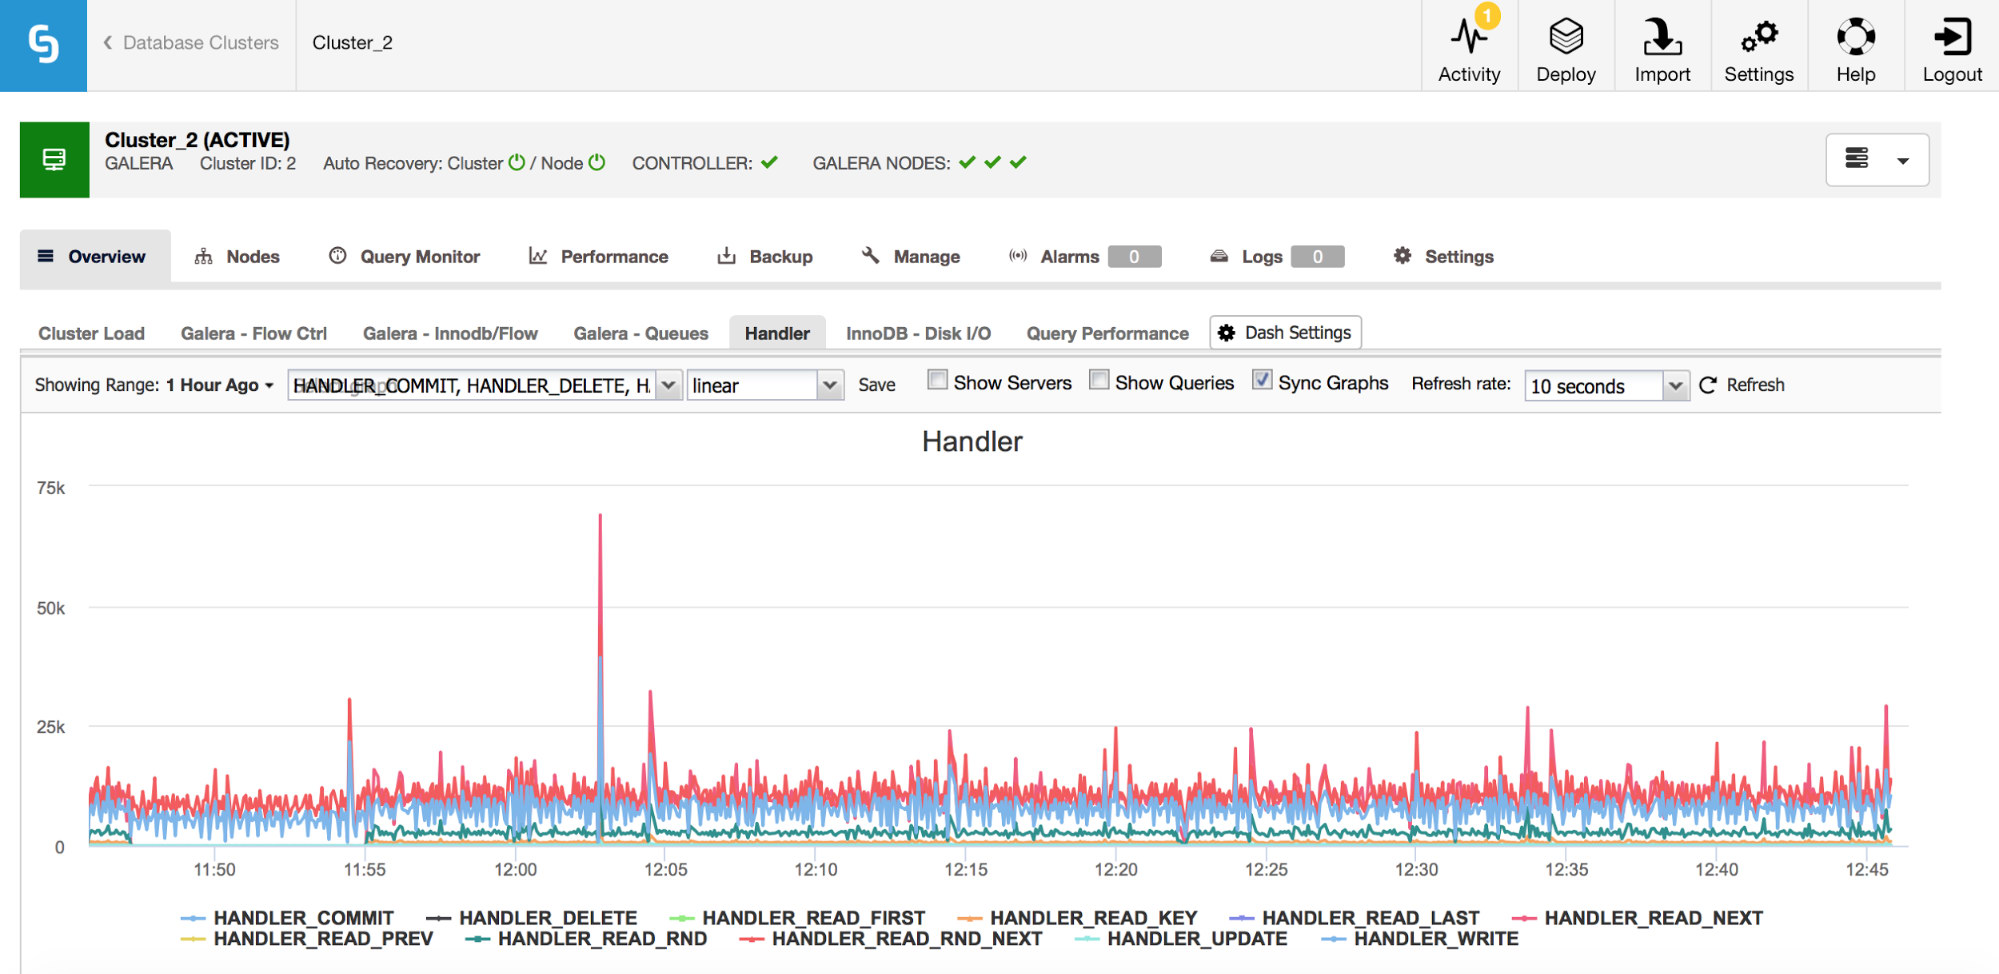
As you can see from the graph above there are many metrics to track (and ClusterControl graphs the most important ones) – we won’t cover all of them here (you can find descriptions in MySQL documentation) but we’d like to highlight the most important ones.
Handler_read_rnd_next – whenever MySQL accesses a row without an index lookup, in sequential order, this counter will be increased. If in your workload handler_read_rnd_next is responsible for a high percentage of the whole traffic, it means that your tables, most likely, could use some additional indexes because MySQL does plenty of table scans.
Handler_read_next and handler_read_prev – those two counters are updated whenever MySQL does an index scan – forward or backward. Handler_read_first and handler_read_last may shed some more light onto what kind of index scans those are – if we are talking about full index scan (forward or backward), those two counters will be updated.
Handler_read_key – this counter, on the other hand, if its value is high, tells you that your tables are well indexed as many of the rows were accessed through an index lookup.
Replication Lag
If you are working with MySQL replication, replication lag is a metric you definitely want to monitor. Replication lag is inevitable and you will have to deal with it, but to deal with it you need to understand why it happens. For that the first step will be to know _when_ it showed up.
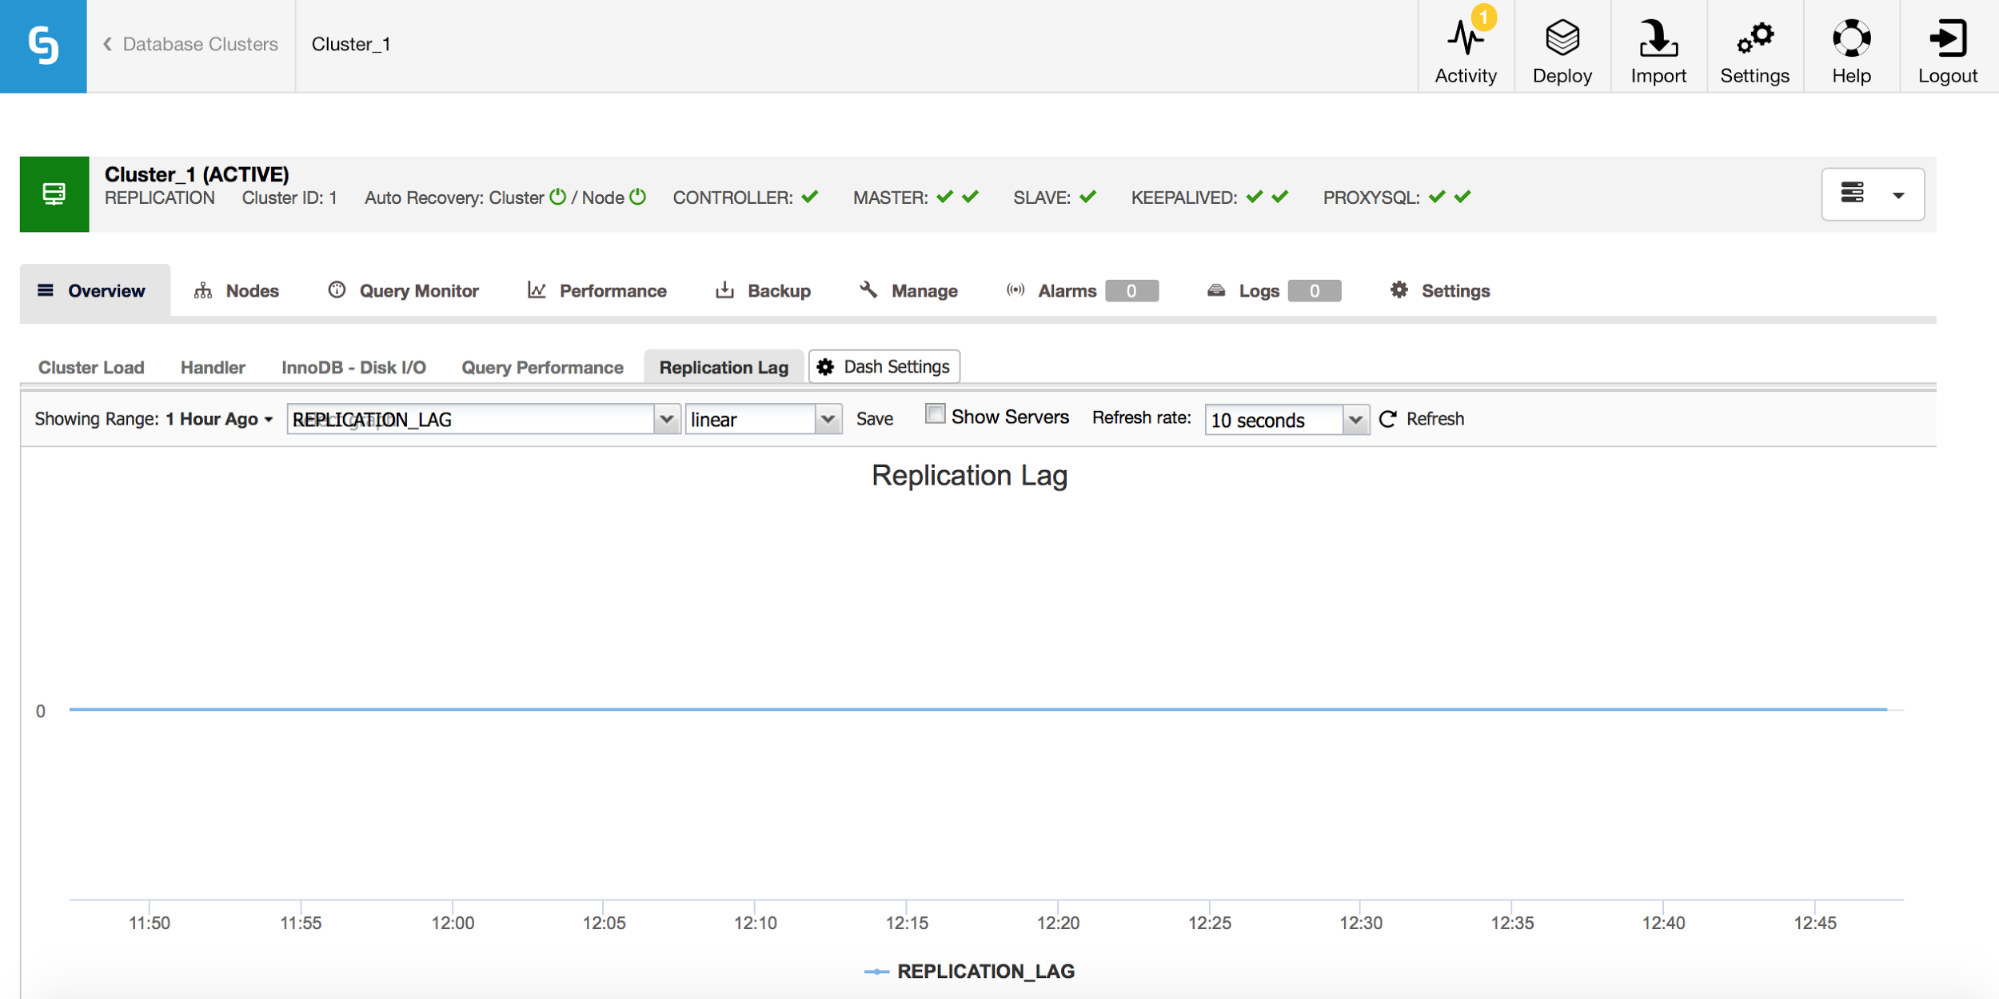
Whenever you see a spike of the replication lag, you’d want to check other graphs to get more clues – why has it happened? What might have caused it? Reasons could be different – long, heavy DML’s, significant increase in number of DML’s executed in a short period of time, CPU or I/O limitations.
InnoDB I/O
There are a number of important metrics to monitor that related to the I/O.
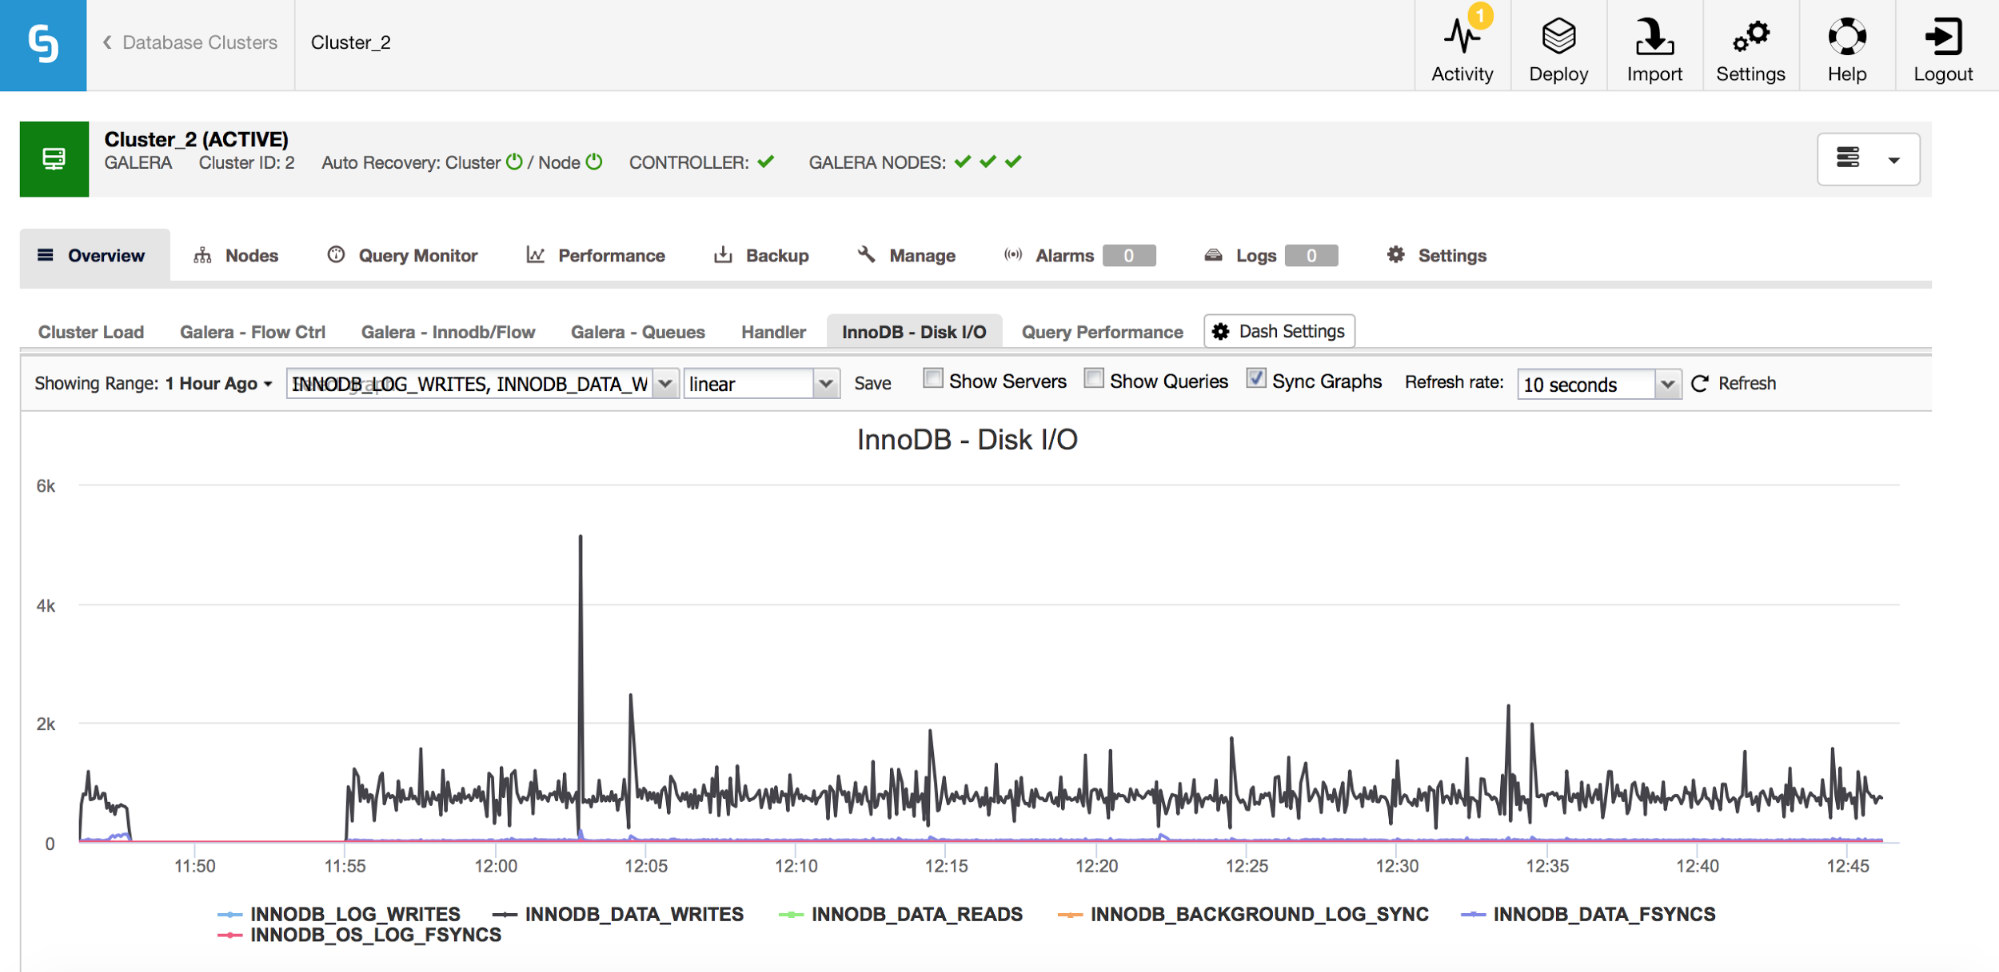
In the graph above, you can see couple of metrics which tell you what kind of I/O InnoDB does – data writes and reads, redo log writes, fsyncs. Those metrics will help you to decide, for example, if replication lag was caused by a spike of I/O or maybe because of some other reason. It’s also important to keep track of those metrics and compare them with your hardware limitations – if you are getting close to the hardware limits of your disks, maybe it’s time to look into this before it has more serious effects on your database performance.
Galera Metrics – Flow Control and Queues
If you happen to use Galera Cluster (no matter which flavor you use), there are a couple more metrics you’d want to closely monitor, these are somewhat tied together. First of them are metrics related to flow control.
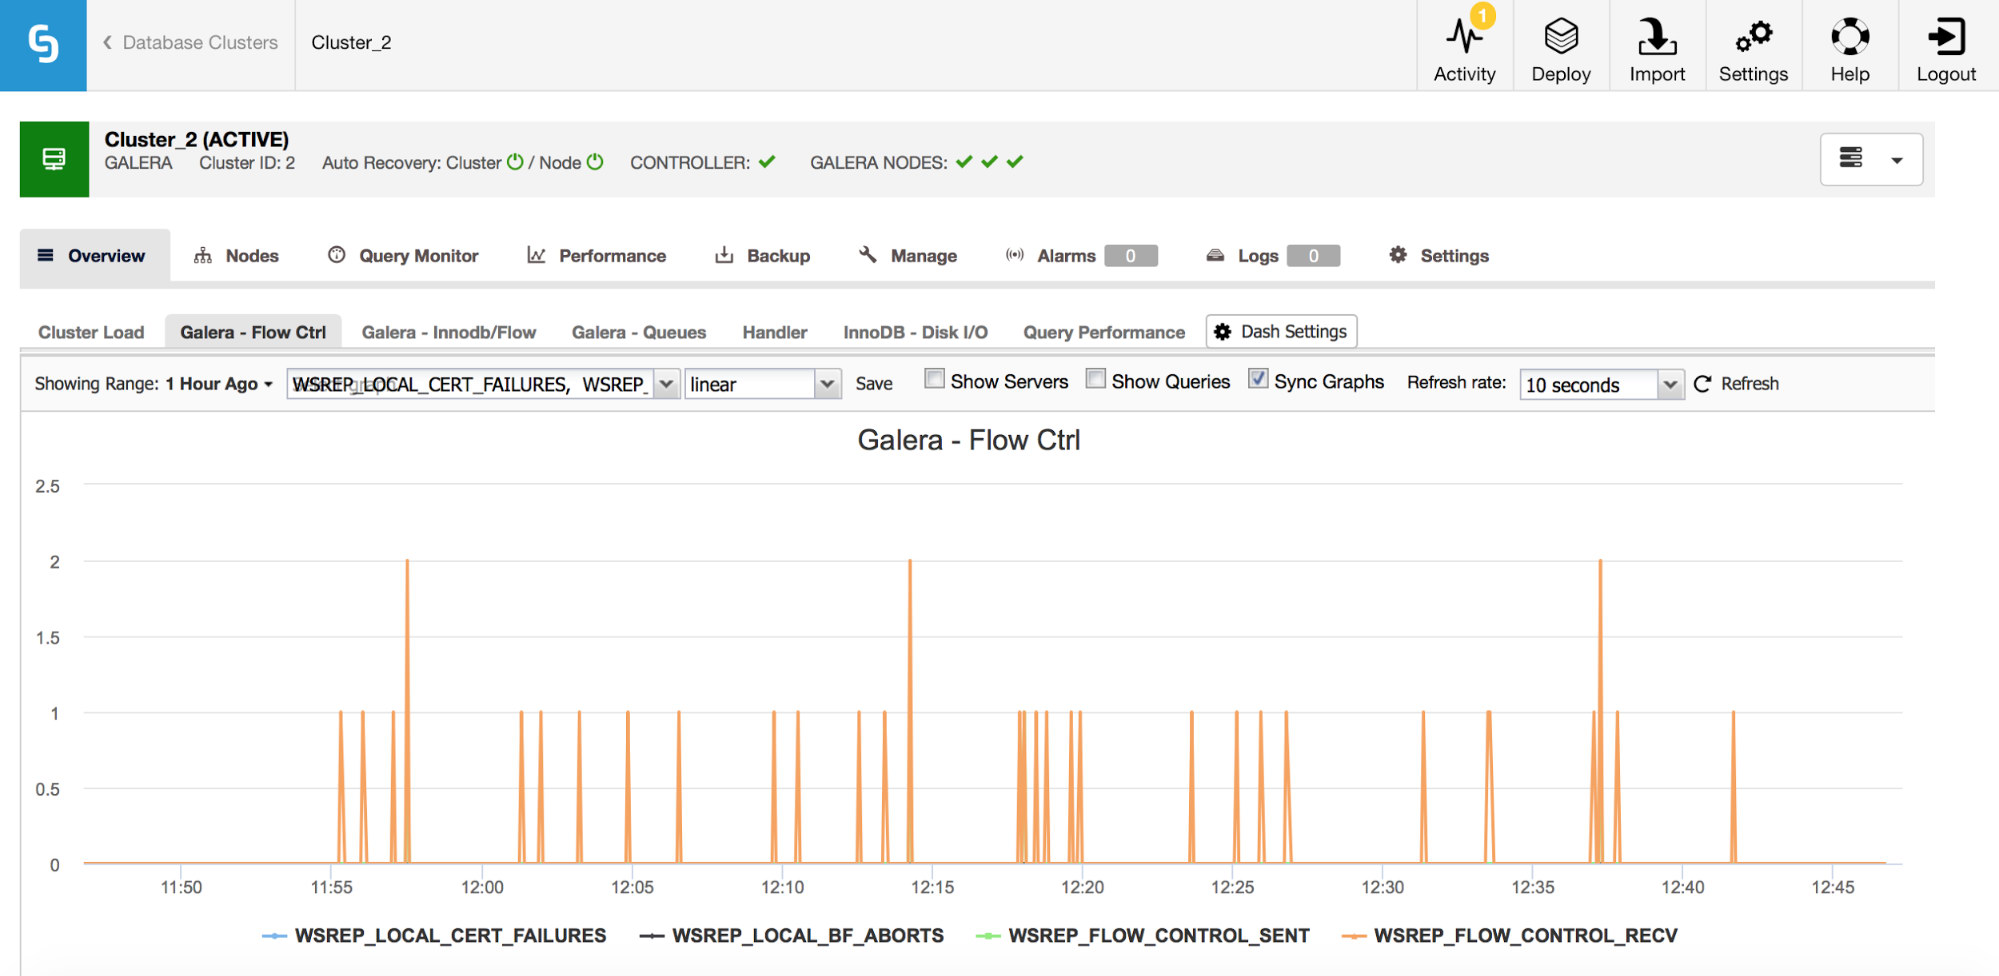
Flow control, in Galera, is a means to keep the cluster in sync. Whenever a node stalls and cannot keep up with the rest of the cluster, it starts to send flow control messages asking the remaining cluster nodes to slow down. This allows it to catch up. This reduces the performance of the cluster, so it is important to be able to tell which node and when it started to send flow control messages. This can explain some of the slowdowns experienced by users or limit the time window and host to use for further investigation.
Second set of metrics to monitor are the ones related to send and receive queues in Galera.
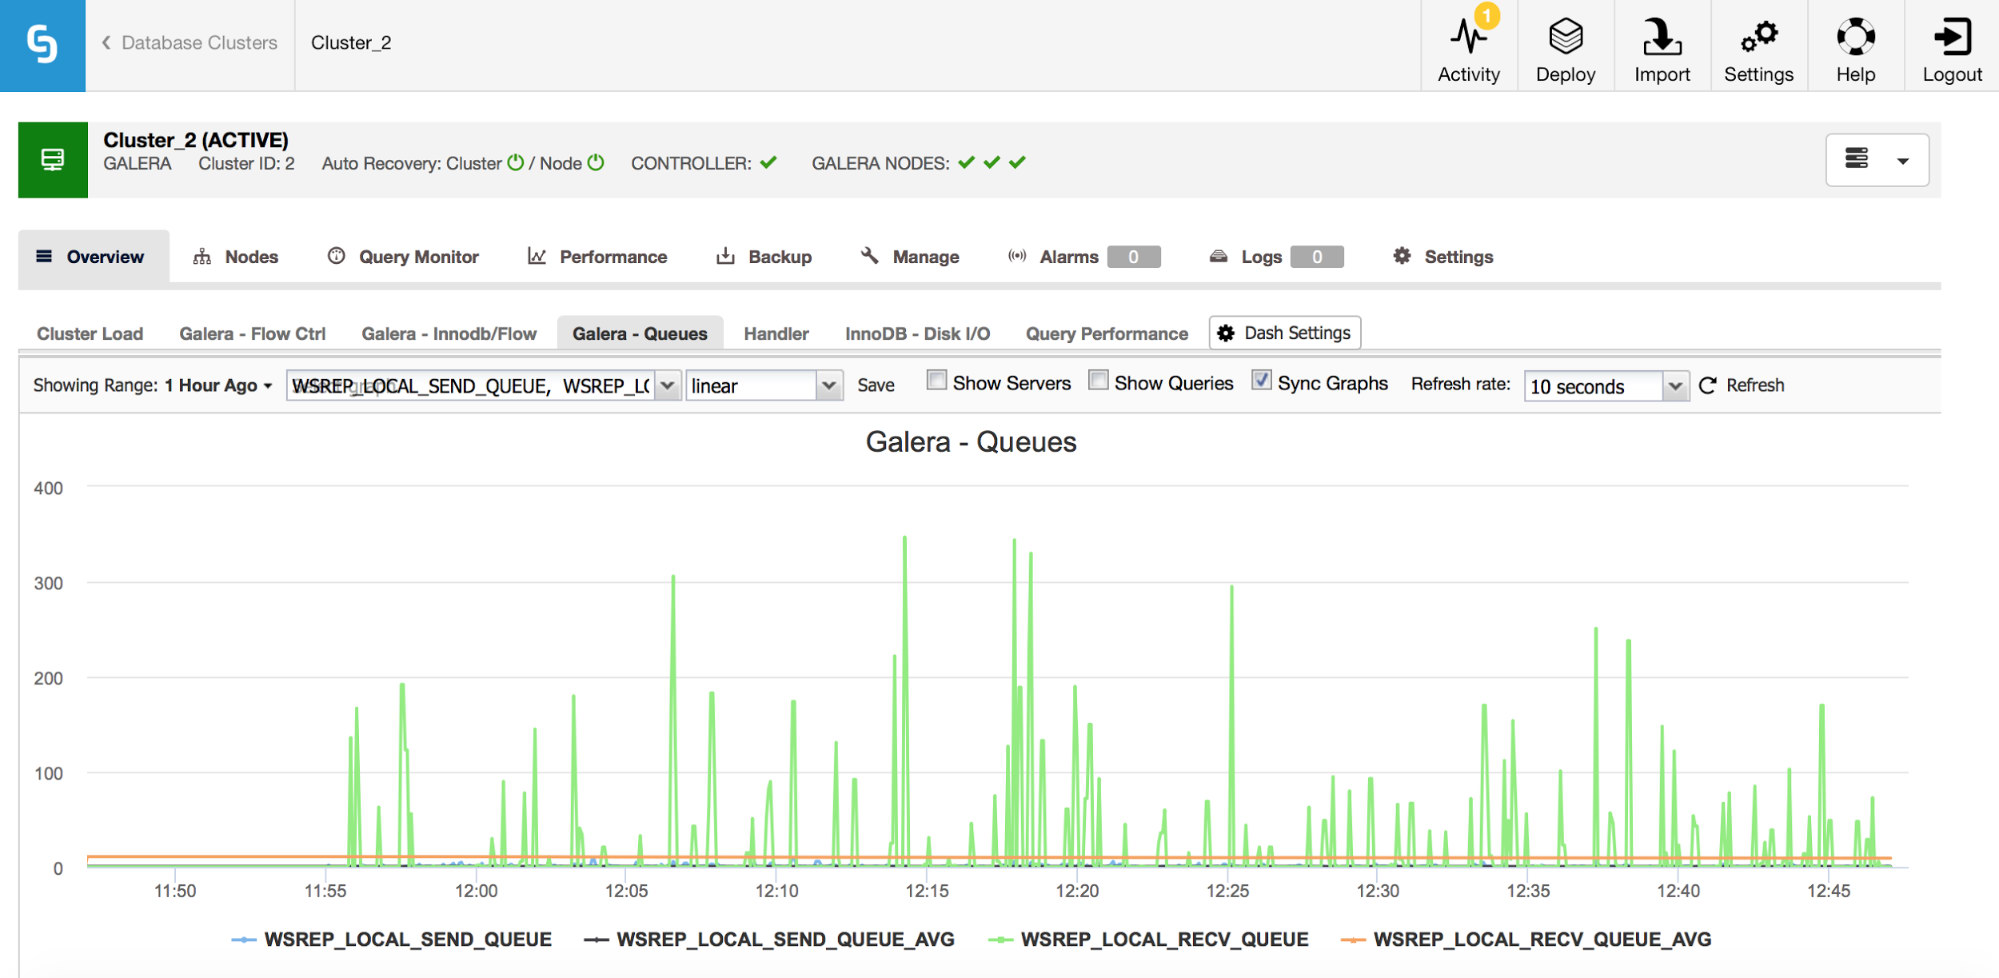
Galera nodes can cache writesets (transactions) if they cannot apply all of them immediately. If needed, they can also cache writesets which are about to be sent to other nodes (if a given node receives writes from the application). Both cases are symptoms of a slow down which, most likely, will result in flow control messages being sent, and require some investigation – why it happened, on which node, at what time?
This is, of course, just the tip of the iceberg when we consider all of the metrics MySQL makes available – still, you can’t go wrong if you start watching those we covered here, in addition to regular OS/hardware metrics like CPU, memory, disk utilization and state of the services.