blog
ClusterControl: Intro to the New Query Monitor

ClusterControl 1.9.0 was released on July 16th 2021 with a lot of new features introduced to the system. Those features include Redis Management and Monitoring, a new agent-based Query Monitoring system for MySQL and PostgreSQL, pgBackRest improvements as well as some other improvements listed here. We are quite excited as this is our second major release for 2021 after ClusterControl 1.8.2.
If you are new to ClusterControl, Query Monitor is one of our useful features where you can get information about the workload of your database. Query Monitor provides a summary of query processing across all nodes in the cluster which becomes indispensable when you notice or experience performance degradation. Not all Query Monitoring features are the same for each database type, for example, the Query Monitor for MySQL based is different from the Query Monitor for PostgreSQL.
Having a top-notch performance is not an excuse especially when you are running mission-critical applications apart from providing the best user experience.
In this blog post, we will discuss what the new Query Monitor has offered and go through some of the steps on how to enable it for both MySQL-based and PostgreSQL-based system. Without further ado, let’s get started!
Our New MySQL Query Monitor
If you already updated this new version, you will probably notice some of the changes on the interface. The new Query Monitor will have an additional tab called Overview. The Query Overview is a place where you can get a general overview of all queries for your database cluster. For MySQL based database instances, you need to enable the “performance_schema” parameter for all your MySQL instances before the query agent can be installed. You would see the following screenshot if you click on the Query Overview tab:
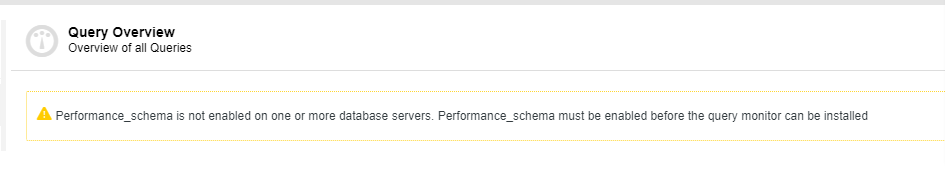
If you have not enabled the “performance_schema” you will not be able to utilize this dashboard. You could enable the parameter through Cluster -> Manage -> Configurations and edit the /etc/my.cnf file for all hosts. Make sure to update the value to the following:
performance_schema = ON
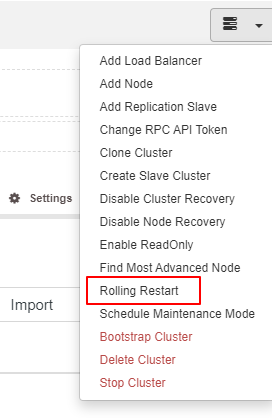
Once this is done, you need to do a rolling restart of the cluster from the cluster’s action list so that the change takes effect. Without a rolling restart, the query agent cannot be installed.
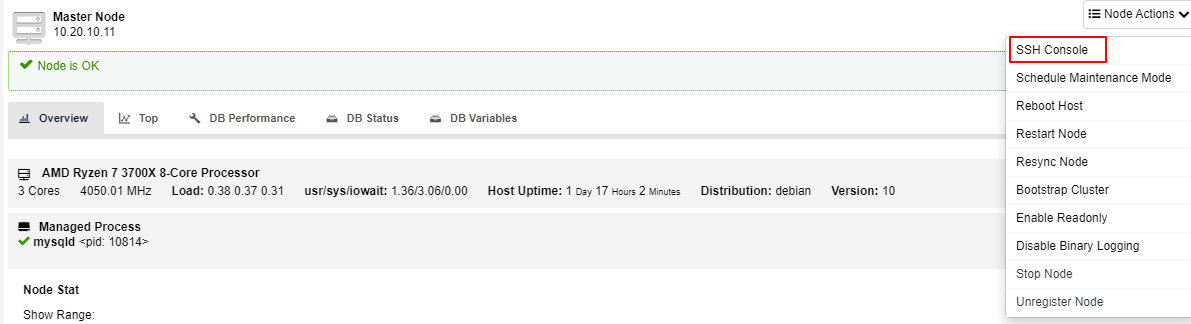
Of course, you could also do it manually from your database nodes, it depends on your preference. If you choose the manual way, you may SSH to your database instance and edit /etc/my.cnf.If you would like to SSH from the ClusterControl UI, you could easily do it from the node action list like in the screenshot below:
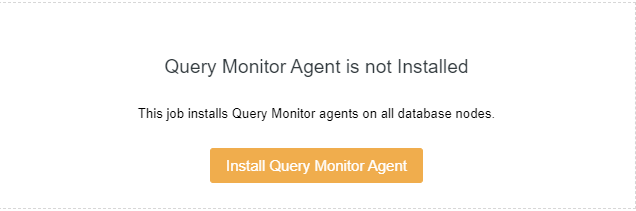
Now you should notice the following screenshot after the rolling restart is completed and all you need to do is to click on the Install Query Monitor Agent:
It should only take a while before you could see the new Query Overview dashboard like the following screenshot:
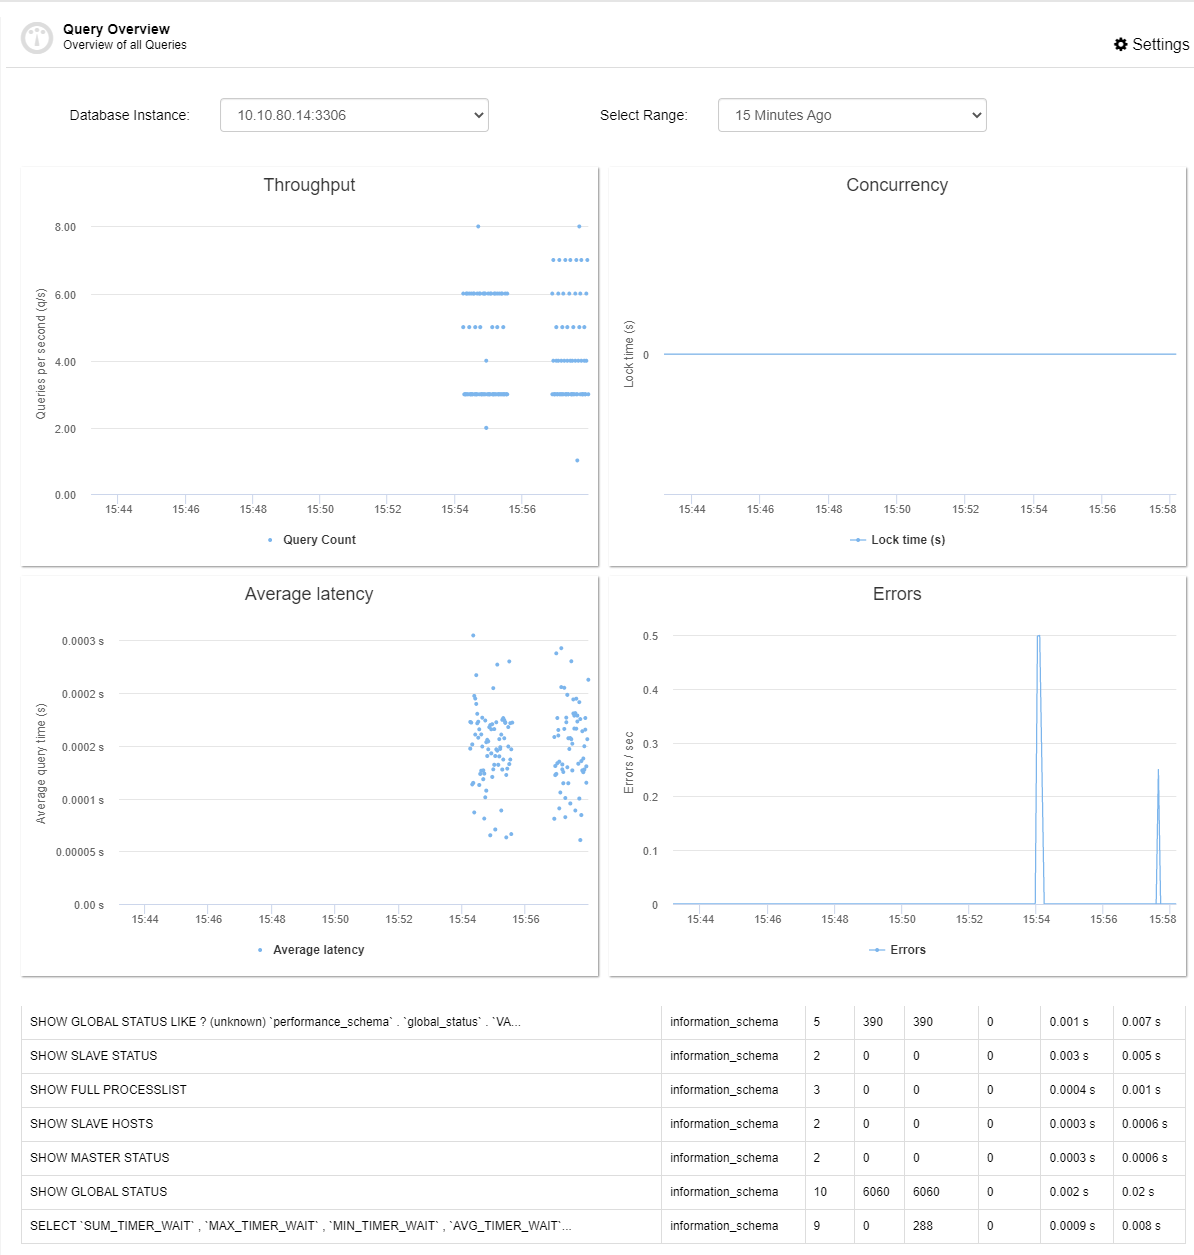
In our new Query Overview dashboard, there are a few variables that you could monitor and get the metrics from. Here you could see the throughput, concurrency, average latency, error as well as the list of the queries at the bottom. The explanation for each of them are as follows:
-
Throughput – Query per second (q/s)
-
The overall capability to process data that is measured in queries per second, transaction per second or the average response time.
-
-
Concurrency – Lock time (s)
-
The number of concurrent queries, especially the INSERT query. It’s measured in seconds.
-
-
Average Latency – Average query time (s)
-
The latency distribution of statements running within this MySQL instance.
-
-
Errors – Errors (sec)
-
The number of query errors per second for the cluster.
-
You can select which database instance that you would like to see the metrics as well as the timeframe from 15 minutes up to 4 hours for each of them. With this option, you can easily identify what is happening in that particular instance.
At the bottom of the dashboard, you can notice that there is a list of queries that are currently running for your cluster. Here, you can see the information of the query digest, schema, count, rows and also the execution time.
As opposed to the older version (1.8.2), this is a totally new dashboard and it will be very useful when you want to have an overview of the cluster. With the metrics here, you will be able to take necessary actions if you notice that your cluster performance is not optimal.
New Query Monitor For PostgreSQL
The same process needs to be done for PostgreSQL: once you upgrade the ClusterControl to 1.9.0 you will need to install the query monitor agent before you could get the metrics for the Query Overview. You will see output similar to the one below:
However, for PostgreSQL you don’t have to enable any parameter like you need to for MySQL-based datbaases, you could straight away install the agent from the dashboard. The installation should take a while before you could see the Query Overview dashboard like below.
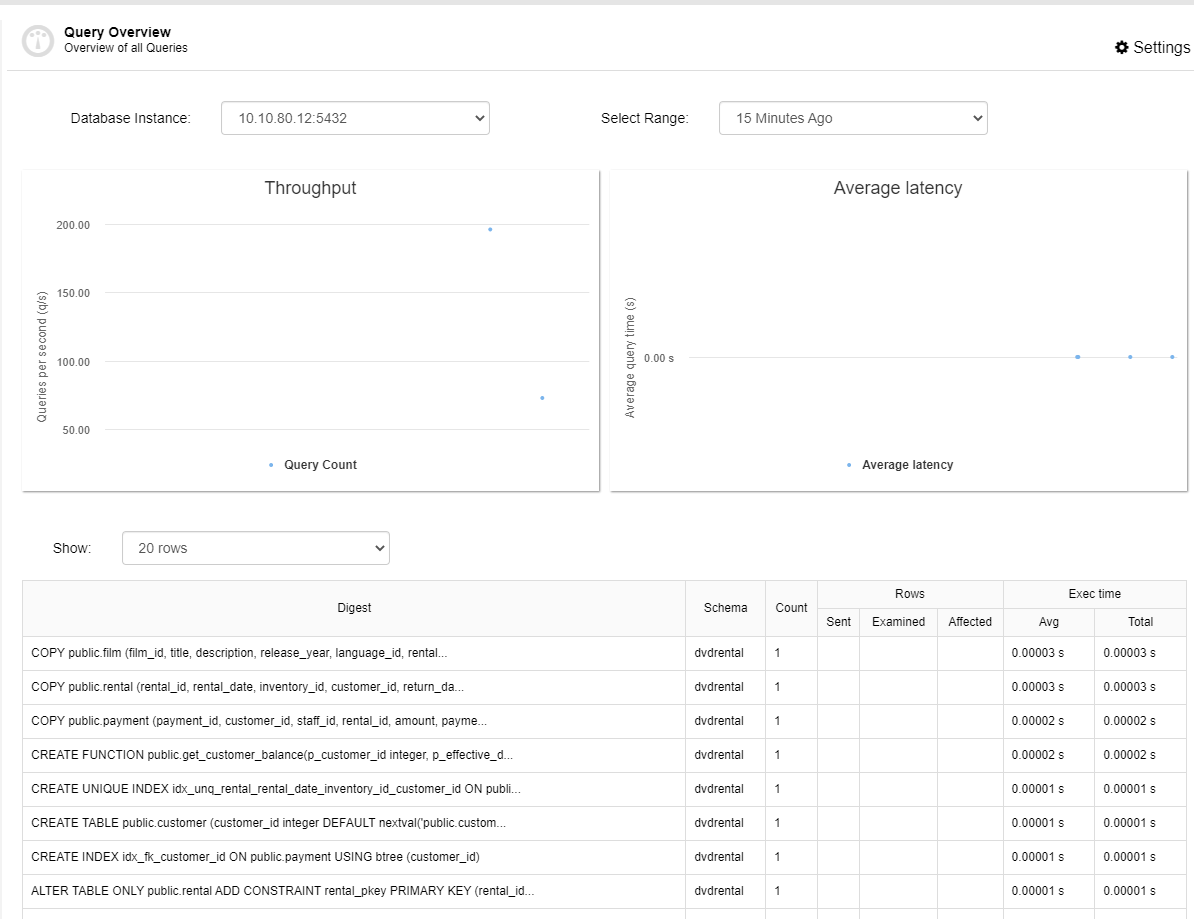
As you could see, the dashboard is a little bit different from the MySQL dashboard where there are only 2 metrics which are throughput and average latency. Like MySQL based Query Overview dashboard, you could also select the database instance that you want to see the metrics as well as the time range.
You could also see the list of the queries below of the metrics as shown in the screenshot above. In the query list, you could see the digest, schema, count, rows and execution time of each query.
Final Thoughts
We think the new Query Monitor is quite useful when you want to see what is happening with your queries in a database instance. Imagine you have a few nodes: you can easily switch the database instance from the Query Overview to see the metrics. With this option, you are able to know specifically what is happening on each of your database instances.
For MySQL-based instances, remember to turn on/enable “performance_schema” for each of the database instances before you install the query agent and proceed to seeing the overview.
What are your thoughts on our new Query Monitor? Do you like it and find it useful? Let us know in the comment section below.


