blog
Benchmarking Managed PostgreSQL Cloud Solutions – Part Four: Microsoft Azure


This is the 4th and last part in the series Benchmarking Managed PostgreSQLCloud Solutions. At the time of this writing, Microsoft Azure PostgreSQL was at version 10.7, newer than the two contenders: Amazon Aurora PostgreSQL at version 10.6and Google Cloud SQL for PostgreSQL at version 9.6.
Microsoft decided to run Azure PostgreSQLon Windows:
postgres=> select version();
                        version
------------------------------------------------------------
PostgreSQL 10.7, compiled by Visual C++ build 1800, 64-bit
(1 row)
For this particular test that didn’t work out too well, and I will hazard to guess that Microsoft is well aware of the limitations, the reason why under the PostgreSQL umbrella they also offer a preview version of Citus Data version of PostgreSQL. The approach looks similar to AWS PostgreSQL flavors, RDS and respectively Aurora.
As a side note, while setting up my Azure account, I was taken aback by the lack of 2FA/MFA (Two-Factor/Multi-Factor) authentication that I took as granted with Amazon’s AWS Virtual MFA and Google’s 2-step Verification. Microsoft offers MFA only to enterprise customers subscribed to Active Directory or Office 365. Since Citus Cloud enforces 2FA for production database, perhaps Microsoft isn’t that far from implementing it in Azure.
tl;dr
There are no results for Azure. On the 8-core database instance, identical in the number of cores to those used on AWS and G Cloud, the tests failed to complete due to database errors. On a 16-core instance, pgbench did complete, and sysbench got as far as creating the first 3 tables at which point I interrupted the process. While I was willing to spend a reasonable amount of effort, time, and money on performing the tests, and documenting the errors and their causes, the goal of this exercise was running the benchmark, therefore I never considered pursuing any advanced troubleshooting, or contacting Azure support, nor did I finish the sysbench test on the 16-core database.
Cloud Instances
Client
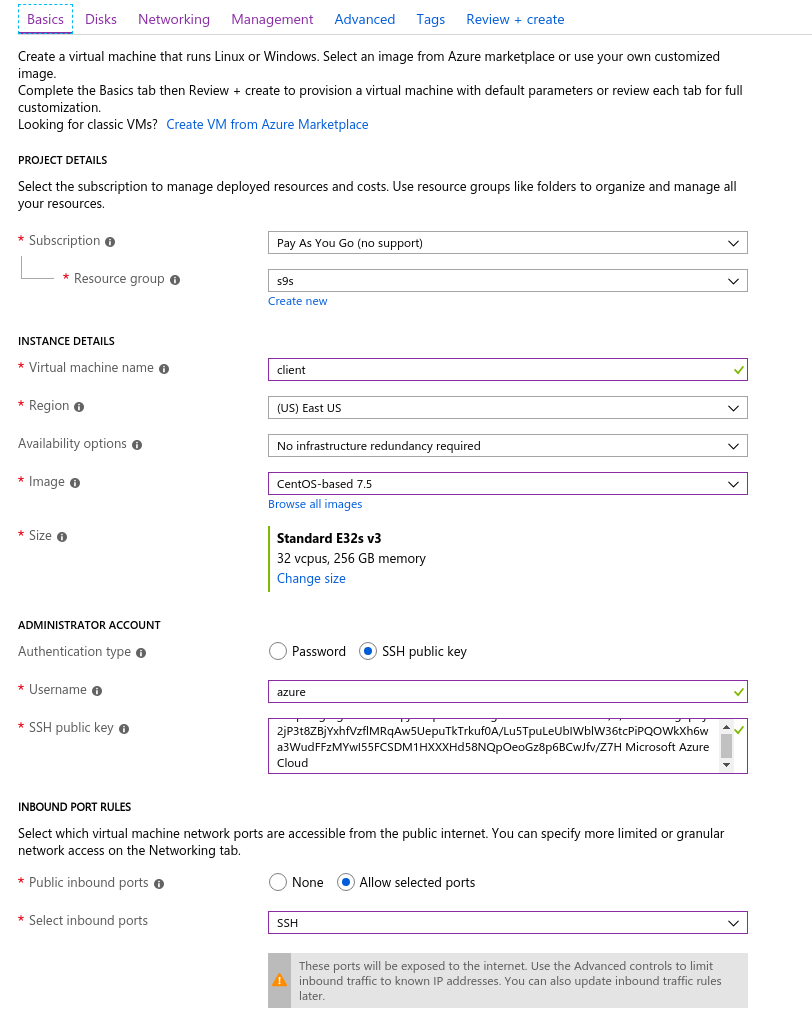
The Azure client instance the closest to the AWS instance selected at the beginning of this blog series, was an E32s v3 instance with the following specifications:
- vCPU: 32 (16 Cores x 2 Threads/Core)
- RAM: 256 GiB
- Storage: Azure Premium SSD
- Network: Accelerated Networking up to 30Gbps
Here’s a portal screenshot with the instance details:
Accelerated Networking is enabled by default when choosing any of the supported virtual machines:
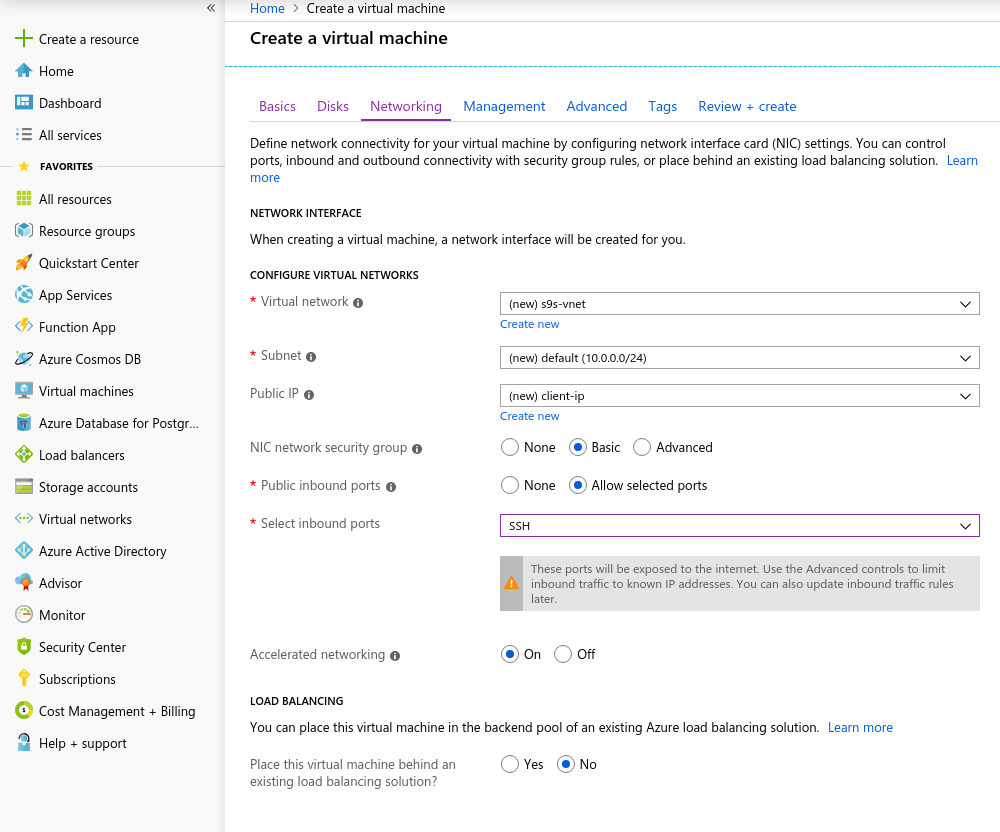
As it’s the rule in the cloud, in order to achieve the best network performance, the client and the server must be located in the same availability zone, which I did by setting up the environment in the East US AZ.
Similarly to Google Cloud, a quota increase must be requested for instances with more than 10 cores. Microsoft made that really easy. Once switching to a paid account I received the approval confirmation before I could finish my reply in the ticket explaining why I am requesting the increase.
Database
In selecting the instance size I tried matching the specs of instances used on AWS and Google Cloud:
- vCPU: 8
- RAM: 80 GiB (maximum)
- Storage: 6000 IOPS (2TiB size at 3 IOPS/GB)
- Network: 2,000 MB/s
The low memory size stems from the memory per vCore formula used for allocating memory:
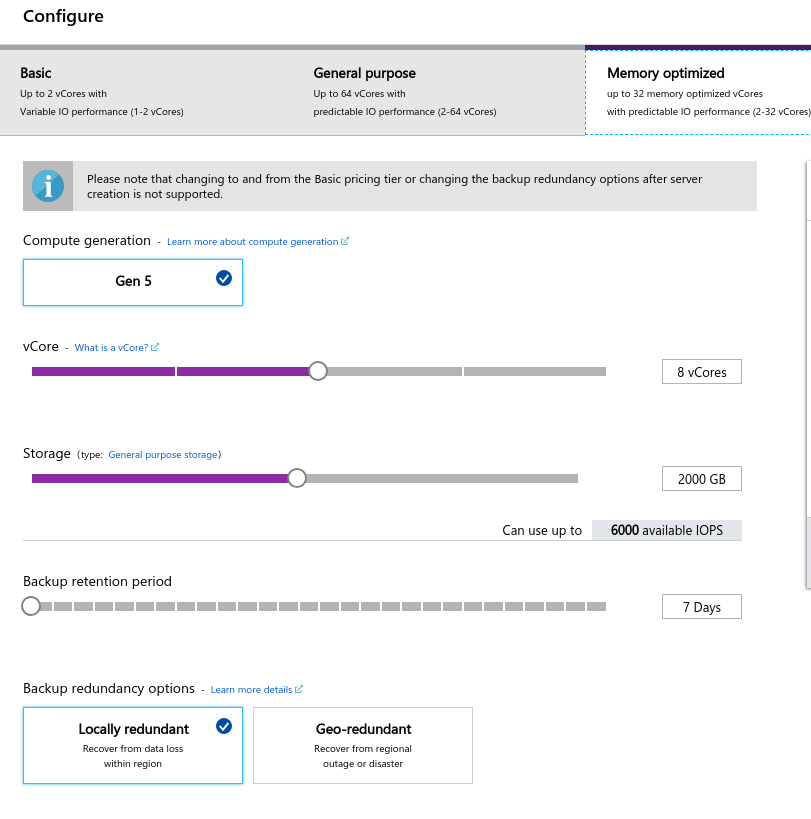
Similarly to Google Cloud, and unlike AWS, the larger the storage, the higher the IOPS, with an increase of 3:1 ratio, however, once the size reaches 2TiB the IOPS is capped at 6000 IOPS.
Running the Benchmarks
Setup
The setup followed the process described in previous parts of the blog series, with the AWS pgbench timing patch for 11.1 applying cleanly to Azure PostgreSQL version 10.7.
Over the course of running the benchmarks I used the following script which just follows the Amazon guide and in this case is tailored for PostgreSQL version in Azure (10.7). The client machine runs CentOS 7.5:
#!/bin/bash

set -eE
trap "exit 1" ERR

yum -y install
   wget ant git php gnuplot gcc make readline-devel zlib-devel
   postgresql-jdbc bzr automake libtool patch libevent-devel
   openssl-devel ncurses-devel

wget https://ftp.postgresql.org/pub/source/v10.7/postgresql-10.7.tar.gz
rm -rf postgresql-10.7
tar -xzf postgresql-10.7.tar.gz
cd postgresql-10.7
wget https://s3.amazonaws.com/aurora-pgbench-patches/pgbench-init-timing.patch
patch --verbose -p1 -b  < pgbench-init-timing.patch
./configure
make -j 4 all
make install
cd ..

rm -rf sysbench
git clone -b 0.5 https://github.com/akopytov/sysbench.git
cd sysbench
./autogen.sh
CFLAGS="-L/usr/local/pgsql/lib/ -I /usr/local/pgsql/include/"
   | ./configure
      --with-pgsql
      --without-mysql
      --with-pgsql-includes=/usr/local/pgsql/include/
      --with-pgsql-libs=/usr/local/pgsql/lib/
make
make install
cd sysbench/tests
make install

sed -i
   '/^export PGHOST=/,/^export LD_LIBRARY_PATH.*pgsql/d'
   ~/.bashrc
cat << "__eot__" >> ~/.bashrc
export PGHOST=CHANGEME
export PGUSER=postgres
export PGPASSWORD=postgres
export PGDATABASE=postgres
export PGPORT=5432
export PATH=/usr/local/pgsql/bin:/usr/local/bin:$PATH
export LD_LIBRARY_PATH=$LD_LIBRARY_PATH:/usr/local/pgsql/lib
__eot__

echo "All done."
Once the script completes, edit .bashrc to set the PostgreSQL environment variables. Azure is peculiar about the format of the PostgreSQL username by expecting a format {username}@{host} rather than the ubiquitous {username}:
[root@client scripts]# psql
psql: FATAL:  Invalid Username specified. Please check the Username and retry connection. The Username should be in <username@hostname> format.</username@hostname>
Before starting the tests, verify that we are using the correct version of client tools:
[root@client scripts]# psql --version
psql (PostgreSQL) 10.7
[root@client scripts]# pgbench --version
pgbench (PostgreSQL) 10.7[root@client scripts]# sysbench --version
sysbench 0.5pgench
Initialize the pgbench database.
[root@client ~]# pgbench -i --fillfactor=90 --scale=10000…and several minutes later:
[root@client scripts]# pgbench -i --fillfactor=90 --scale=10000
NOTICE:  table "pgbench_history" does not exist, skipping
NOTICE:  table "pgbench_tellers" does not exist, skipping
NOTICE:  table "pgbench_accounts" does not exist, skipping
NOTICE:  table "pgbench_branches" does not exist, skipping
creating tables...
100000 of 1000000000 tuples (0%) done (elapsed 0.04 s, remaining 426.44 s)
200000 of 1000000000 tuples (0%) done (elapsed 0.09 s, remaining 427.22 s)
300000 of 1000000000 tuples (0%) done (elapsed 0.18 s, remaining 600.63 s)
400000 of 1000000000 tuples (0%) done (elapsed 0.21 s, remaining 530.99 s)
500000 of 1000000000 tuples (0%) done (elapsed 0.30 s, remaining 595.12 s)

...

584300000 of 1000000000 tuples (58%) done (elapsed 2421.82 s, remaining 1723.01 s)
584400000 of 1000000000 tuples (58%) done (elapsed 2421.86 s, remaining 1722.32 s)
584500000 of 1000000000 tuples (58%) done (elapsed 2422.81 s, remaining 1722.29 s)
584600000 of 1000000000 tuples (58%) done (elapsed 2422.84 s, remaining 1721.60 s)
584700000 of 1000000000 tuples (58%) done (elapsed 2422.88 s, remaining 1720.92 s)
584800000 of 1000000000 tuples (58%) done (elapsed 2425.06 s, remaining 1721.76 s)
584900000 of 1000000000 tuples (58%) done (elapsed 2425.09 s, remaining 1721.07 s)
585000000 of 1000000000 tuples (58%) done (elapsed 2425.28 s, remaining 1720.50 s)
...

999700000 of 1000000000 tuples (99%) done (elapsed 4142.69 s, remaining 1.24 s)
999800000 of 1000000000 tuples (99%) done (elapsed 4142.95 s, remaining 0.83 s)
999900000 of 1000000000 tuples (99%) done (elapsed 4142.98 s, remaining 0.41 s)
1000000000 of 1000000000 tuples (100%) done (elapsed 4143.92 s, remaining 0.00 s)
vacuum...
set primary keys...
total time: 14805.73 s (insert 4146.94 s, commit 0.02 s, vacuum 6581.15 s, index 4077.61 s)
done.
So far, so good.
A quick look at the database to confirm that it’s ready to go:
postgres@postgresql-10-7:5432 postgres> l+
                                                                                                List of databases
      Name        |      Owner      | Encoding |          Collate           |           Ctype            |          Access privileges          |   Size    | Table space |                Description
-------------------+-----------------+----------+----------------------------+----------------------------+-------------------------------------+-----------+------------+--------------------------------------------
azure_maintenance | azure_superuser | UTF8     | English_United States.1252 | English_United States.1252 | azure_superuser=CTc/azure_superuser | No Access | pg_default  |
azure_sys         | azure_superuser | UTF8     | English_United States.1252 | English_United States.1252 |                                     | 12 MB     | pg_default  |
postgres          | azure_superuser | UTF8     | English_United States.1252 | English_United States.1252 |                                     | 160 GB    | pg_default  | default administrative connection database
template0         | azure_superuser | UTF8     | English_United States.1252 | English_United States.1252 | =c/azure_superuser                 +| 7865 kB   | pg_default  | unmodifiable empty database
                  |                 |          |                            |                            | azure_superuser=CTc/azure_superuser |           |             |
template1         | azure_superuser | UTF8     | English_United States.1252 | English_United States.1252 | =c/azure_superuser                 +| 7865 kB   | pg_default  | default template for new databases
                  |                 |          |                            |                            | azure_superuser=CTc/azure_superuser |           |             |
(5 rows)
Since Azure doesn’t allow changing max_connections and given that for the selected instance the limit is capped at 960, we are going to have to adjust the number of pgbench clients accordingly:
[root@client scripts]# pgbench --protocol=prepared -P 60 --time=600 --client=950 --jobs=2048
starting vacuum...end.
connection to database "postgres" failed:
could not translate host name "postgresql-10-7.postgres.database.azure.com" to address: Name or service not known
connection to database "postgres" failed:
could not translate host name "postgresql-10-7.postgres.database.azure.com" to address: Name or service not known
And there it is, the first hiccup.
A quick check of the host DNS resolution doesn’t show any issues:
[root@client scripts]# dig +short $PGHOST
cr1.eastus1-a.control.database.windows.net.
191.238.6.43
[root@client scripts]# cat /etc/resolv.conf
; generated by /usr/sbin/dhclient-script
search 11jv1qvdjs5utlhtlyb5vdyeth.bx.internal.cloudapp.net
nameserver 168.63.129.16A review of my screenlog shows that almost half of the connections were terminated:
~$ cat screenlog.1 | nl | grep 'could not translate host name "postgresql-10-7.*Name or service not known' | wc -l
469
pg_stat_activity tells a more detailed story — we spike at 950 connections:
postgres@postgresql-10-7:5432 postgres> select now(), count(*) from pg_stat_activity where usename = 'postgres' and application_name = 'pgbench';                                now              | count
-------------------------------+-------
2019-05-03 23:39:18.200291+00 |   950
(1 row)
…however, monitoring the above query shows a sudden drop in the number of connections from 950 to 628, in just 10 seconds:
postgres@postgresql-10-7:5432 postgres> watch 10
Fri 03 May 2019 11:41:05 PM UTC (every 10s)

            now              | count
-------------------------------+-------
2019-05-03 23:41:05.044025+00 |   950
(1 row)

...

Fri 03 May 2019 11:43:10 PM UTC (every 10s)

            now              | count
-------------------------------+-------
2019-05-03 23:43:10.512766+00 |   950
(1 row)

Fri 03 May 2019 11:43:20 PM UTC (every 10s)

            now              | count
-------------------------------+-------
2019-05-03 23:43:17.419011+00 |   628
(1 row)

Fri 03 May 2019 11:43:30 PM UTC (every 10s)

            now              | count
-------------------------------+-------
2019-05-03 23:43:31.434638+00 |   613
(1 row)
To work around the DNS issue, I assigned PGHOST the host IP address:
[root@client scripts]# set | grep PG
PGDATABASE=postgres
PGHOST=191.238.6.43
PGPASSWORD=qazWSX1@
PGPORT=5432
PGUSER=postgres@posgtresql-10-7
With that workaround in place I restarted the test:
[root@client scripts]# pgbench --protocol=prepared -P 60 --time=600 --client=950 --jobs=2048
starting vacuum...end.
progress: 61.1 s, 457.7 tps, lat 559.138 ms stddev 1755.888
progress: 120.1 s, 78.8 tps, lat 3883.772 ms stddev 10551.545
progress: 180.1 s, 17.6 tps, lat 50831.708 ms stddev 31214.512
progress: 240.1 s, 15.2 tps, lat 42474.763 ms stddev 32702.050
progress: 300.1 s, 16.1 tps, lat 43584.559 ms stddev 29818.142
progress: 360.1 s, 26.5 tps, lat 36914.096 ms stddev 37152.588
progress: 420.0 s, 33.4 tps, lat 27542.926 ms stddev 37075.457
progress: 480.0 s, 20.2 tps, lat 47149.060 ms stddev 47087.474
progress: 540.0 s, 13.5 tps, lat 55609.260 ms stddev 60394.287
progress: 600.0 s, 36.5 tps, lat 49566.853 ms stddev 99155.598

transaction type:
scaling factor: 10000
query mode: prepared
number of clients: 950
number of threads: 950
duration: 600 s
number of transactions actually processed: 44293
latency average = 12493.888 ms
latency stddev = 40490.231 ms
tps = 60.907130 (including connections establishing)
tps = 64.213520 (excluding connections establishing)
At a first glance, things appeared to have worked out okay, however, the extremely high latency values, coupled with the prior DNS issues and the “accelerated networking” enabled client, suggest that something is amiss at the network level, and that’s the likely cause of low tps results. But the worst is yet to come.
sysbench
First, create the tables:
sysbench --test=/usr/local/share/sysbench/oltp.lua
--pgsql-host=${PGHOST}
--pgsql-db=${PGDATABASE}
--pgsql-user=${PGUSER}
--pgsql-password=${PGPASSWORD}
--pgsql-port=${PGPORT}
--oltp-tables-count=250
--oltp-table-size=450000
prepare
After a little while:
sysbench 0.5:  multi-threaded system evaluation benchmark

Creating table 'sbtest1'...
FATAL: PQexec() failed: 7 server closed the connection unexpectedly
        This probably means the server terminated abnormally
        before or while processing the request.

FATAL: failed query: CREATE TABLE sbtest1 (
id SERIAL NOT NULL,
k INTEGER DEFAULT '0' NOT NULL,
c CHAR(120) DEFAULT '' NOT NULL,
pad CHAR(60) DEFAULT '' NOT NULL,
PRIMARY KEY (id)
)
FATAL: failed to execute function `prepare': 3
That didn’t look good at all so I checked PostgreSQL logs:
2019-05-03 23:51:12 UTC-5ccbbe4f.88-WARNING:  worker took too long to start; canceled
2019-05-03 23:51:14 UTC-5ccbbe4f.84-PANIC:  could not write to log file 000000010000001F000000CD at offset 13664256, length 8192: Invalid argument
+++ NT HARD ERROR (0xd0000144) +++
    Parameter 0: 0xffffffffc0000005
    Parameter 1: 0x1b80f0f73b
    Parameter 2: 0x1
    Parameter 3: 0x0
Although the service should recover on its own, I decided to reboot the instance in order to speed up the process.
2019-05-04 00:43:23 UTC-5ccce02a.2c-HINT:  Is another postmaster already running on port 20108? If not, wait a few seconds and retry.
2019-05-04 00:43:23 UTC-5ccce02a.2c-LOG:  could not bind IPv6 address "::": A socket operation was attempted to an unreachable host.
2019-05-04 00:43:23 UTC-5ccce02a.2c-LOG:  listening on IPv4 address "0.0.0.0", port 20108
2019-05-04 00:43:24 UTC-5ccce02a.2c-LOG:  database system is ready to accept connections
...
2019-05-05 00:03:35 UTC-5cce2856.2c-HINT:  Is another postmaster already running on port 20326? If not, wait a few seconds and retry.
2019-05-05 00:03:35 UTC-5cce2856.2c-LOG:  could not bind IPv6 address "::": A socket operation was attempted to an unreachable host.
2019-05-05 00:03:35 UTC-5cce2856.2c-LOG:  listening on IPv4 address "0.0.0.0", port 20326
2019-05-05 00:03:38 UTC-5cce285a.3c-FATAL:  the database system is starting up
2019-05-05 00:03:38 UTC-5cce285a.3c-LOG:  connection received: host=127.0.0.1 port=47247 pid=60
2019-05-05 00:03:49 UTC-5cce2865.40-FATAL:  the database system is starting up
2019-05-05 00:03:49 UTC-5cce2865.40-LOG:  connection received: host=127.0.0.1 port=47284 pid=64
2019-05-05 00:03:59 UTC-5cce286f.44-FATAL:  the database system is starting up
2019-05-05 00:03:59 UTC-5cce286f.44-LOG:  connection received: host=127.0.0.1 port=47312 pid=68
2019-05-05 00:04:00 UTC-5cce2856.2c-LOG:  database system is ready to accept connections
2019-05-05 00:04:00 UTC-5cce2870.38-LOG:  database system was shut down at 2019-05-05 00:03:34 UTC
At this point I also enabled query performance insights:
2019-05-05 00:04:13 UTC-5cce2856.2c-LOG:  parameter "pgms_wait_sampling.query_capture_mode" changed to "ALL"
2019-05-05 00:04:13 UTC-5cce2856.2c-LOG:  parameter "pg_qs.query_capture_mode" changed to "TOP"
2019-05-05 00:04:13 UTC-5cce2856.2c-LOG:  received SIGHUP, reloading configuration files
2019-05-05 00:04:13 UTC-5cce2856.2c-LOG:  received SIGHUP, reloading configuration files
2019-05-05 00:04:13 UTC-5cce287a.6c-ERROR:  database "azure_sys" already exists
2019-05-05 00:04:13 UTC-5cce287a.6c-STATEMENT:  CREATE DATABASE azure_sys TEMPLATE template0
Before restarting the sysbench task, I wanted to ensure that the database is healthy, and therefore I fired up a second pgbench test:
[root@client scripts]# pgbench --protocol=prepared -P 60 --time=600 --client=950 --jobs=2048
starting vacuum...end.
connection to database "postgres" failed:
server closed the connection unexpectedly
        This probably means the server terminated abnormally
        before or while processing the request.
connection to database "postgres" failed:
server closed the connection unexpectedly
        This probably means the server terminated abnormally
        before or while processing the request.
connection to database "postgres" failed:
server closed the connection unexpectedly
        This probably means the server terminated abnormally
        before or while processing the request.
connection to database "postgres" failed:
server closed the connection unexpectedly
        This probably means the server terminated abnormally
        before or while processing the request.
According to the pg_stat_activity query monitor, the server died when the number of connections reached 710:
postgres@191:5432 postgres> watch 1
Sun 05 May 2019 12:44:11 AM UTC (every 1s)

            now              | count
-------------------------------+-------
2019-05-05 00:44:11.010413+00 |   220
(1 row)

Sun 05 May 2019 12:44:12 AM UTC (every 1s)

            now              | count
-------------------------------+-------
2019-05-05 00:44:12.041667+00 |   231
(1 row)

...

            now              | count
------------------------------+-------
2019-05-05 00:47:33.16533+00 |   710
(1 row)

Sun 05 May 2019 12:47:40 AM UTC (every 1s)

            now              | count
-------------------------------+-------
2019-05-05 00:47:40.524662+00 |   710
(1 row)
And from PostgreSQL logs we learn that something happened along the connection pipe:
2019-05-05 00:44:11 UTC-5cce31da.c60-LOG:  connection received: host=40.114.85.62 port=50925 pid=3168
2019-05-05 00:44:11 UTC-5cce31db.c58-LOG:  connection received: host=40.114.85.62 port=55256 pid=3160
2019-05-05 00:44:11 UTC-5cce31db.c5c-LOG:  connection received: host=40.114.85.62 port=34526 pid=3164
2019-05-05 00:44:11 UTC-5cce31db.c64-LOG:  connection received: host=40.114.85.62 port=1178 pid=3172
...
2019-05-05 00:47:32 UTC-5cce329a.146c-LOG:  connection received: host=40.114.85.62 port=41769 pid=5228
2019-05-05 00:47:33 UTC-5cce3287.1404-LOG:  connection authorized: user=postgresdatabase=postgres SSL enabled (protocol=TLSv1.1, cipher=ECDHE-RSA-AES256-SHA, compression=off)
2019-05-05 00:47:33 UTC-5cce3288.1428-LOG:  connection authorized: user=postgresdatabase=postgres SSL enabled (protocol=TLSv1.1, cipher=ECDHE-RSA-AES256-SHA, compression=off)
2019-05-05 00:47:33 UTC-5cce3289.1434-LOG:  connection authorized: user=postgresdatabase=postgres SSL enabled (protocol=TLSv1.1, cipher=ECDHE-RSA-AES256-SHA, compression=off)
2019-05-05 00:47:33 UTC-5cce3291.1448-LOG:  connection authorized: user=postgresdatabase=postgres SSL enabled (protocol=TLSv1.1, cipher=ECDHE-RSA-AES256-SHA, compression=off)
2019-05-05 00:47:33 UTC-5cce32a3.1484-LOG:  connection received: host=40.114.85.62 port=50296 pid=5252
2019-05-05 00:47:33 UTC-5cce32a5.1488-LOG:  connection received: host=40.114.85.62 port=28304 pid=5256
2019-05-05 00:47:39 UTC-5cce31d2.a24-LOG:  could not send data to client: An existing connection was forcibly closed by the remote host.
2019-05-05 00:47:39 UTC-5cce31d5.ae8-LOG:  could not receive data from client: An existing connection was forcibly closed by the remote host.
2019-05-05 00:47:39 UTC-5cce31e3.ee4-LOG:  could not send data to client: An existing connection was forcibly closed by the remote host.
2019-05-05 00:47:39 UTC-5cce31e9.1054-LOG:  could not receive data from client: An existing connection was forcibly closed by the remote host.
2019-05-05 00:47:39 UTC-5cce3291.1444-LOG:  could not receive data from client: An existing connection was forcibly closed by the remote host.
2019-05-05 00:47:40 UTC-5cce31cd.8ec-LOG:  could not send data to client: An existing connection was forcibly closed by the remote host.
Faced with the limitation in max_connections and the issues encountered during pgbench and sysbench tests, I started to grow curious about whether a 16-core database would exhibit the same behavior.
16-Core Database Instance
On a 16-core database instance max_connections limit is sufficiently large to accommodate 1000 clients:
postgres@191:5432 postgres> show max_connections ;
 max_connections
-----------------
 1900
(1 row)
That allowed me to run the same benchmark commands as I used on the previous cloud providers.
The benchmark completed successfully and the results are shown below:
pgbench
- Initialization:
[root@client scripts]# pgbench -i --fillfactor=90 --scale=10000 NOTICE: table "pgbench_history" does not exist, skipping NOTICE: table "pgbench_tellers" does not exist, skipping NOTICE: table "pgbench_accounts" does not exist, skipping NOTICE: table "pgbench_branches" does not exist, skipping creating tables... 100000 of 1000000000 tuples (0%) done (elapsed 0.08 s, remaining 807.39 s) 200000 of 1000000000 tuples (0%) done (elapsed 0.13 s, remaining 628.37 s) 300000 of 1000000000 tuples (0%) done (elapsed 0.16 s, remaining 527.89 s) ... 600100000 of 1000000000 tuples (60%) done (elapsed 2499.90 s, remaining 1665.90 s) 600200000 of 1000000000 tuples (60%) done (elapsed 2500.07 s, remaining 1665.33 s) ... 999900000 of 1000000000 tuples (99%) done (elapsed 4170.91 s, remaining 0.42 s) 1000000000 of 1000000000 tuples (100%) done (elapsed 4171.29 s, remaining 0.00 s) vacuum... set primary keys... total time: 13701.50 s (insert 4173.33 s, commit 0.05 s, vacuum 7098.74 s, index 2429.39 s) done. - Run:
[root@client scripts]# pgbench --protocol=prepared -P 60 --time=600 --client=1000 --jobs=2048
starting vacuum...end.
progress: 81.4 s, 5639.1 tps, lat 80.094 ms stddev 73.213
progress: 120.0 s, 4091.0 tps, lat 224.161 ms stddev 608.523
progress: 180.0 s, 6932.1 tps, lat 145.143 ms stddev 228.925
progress: 240.0 s, 7287.9 tps, lat 136.521 ms stddev 156.643
progress: 300.0 s, 7567.8 tps, lat 132.722 ms stddev 158.754
progress: 360.0 s, 8077.9 tps, lat 123.801 ms stddev 139.033
progress: 420.0 s, 6076.9 tps, lat 163.886 ms stddev 201.121
progress: 480.0 s, 5376.2 tps, lat 186.678 ms stddev 191.270
progress: 540.0 s, 4864.0 tps, lat 205.696 ms stddev 164.261
progress: 600.0 s, 3759.3 tps, lat 266.073 ms stddev 542.717
transaction type:
scaling factor: 10000
query mode: prepared
number of clients: 1000
number of threads: 1000
duration: 600 s
number of transactions actually processed: 3614386
latency average = 152.935 ms
latency stddev = 248.593 ms
tps = 6002.082008 (including connections establishing)
tps = 6513.306467 (excluding connections establishing)
That went reasonably well, however, there is no valid way to compare these results with those from AWS and G Cloud, as we’re not testing on a similar platform. But this is good enough to get us to the next point.
sysbench
As the pgbench tests completed successfully, I decided to take full advantage of the Azure $200 credit, and confirm that sysbench gets further than the previous run on the 8-core instance:
sysbench
   --test=/usr/local/share/sysbench/oltp.lua
   --pgsql-host=191.238.6.43
   --pgsql-db=postgres
   --pgsql-user=postgres@postresql-10-7-16vcpu-2560gb
   --pgsql-password=qazWSX1@
   --pgsql-port=5432
   --oltp-tables-count=250
   --oltp-table-size=450000 prepare

sysbench 0.5:  multi-threaded system evaluation benchmark

Creating table 'sbtest1'...
Inserting 450000 records into 'sbtest1'
Creating secondary indexes on 'sbtest1'...
Creating table 'sbtest2'...
Inserting 450000 records into 'sbtest2'
Creating secondary indexes on 'sbtest2'...
Creating table 'sbtest3'...
Inserting 450000 records into 'sbtest3'
Creating secondary indexes on 'sbtest3'...
Creating table 'sbtest4'...
That appeared to be working fine, and since I was getting close to my budget, I decided to stop the task.
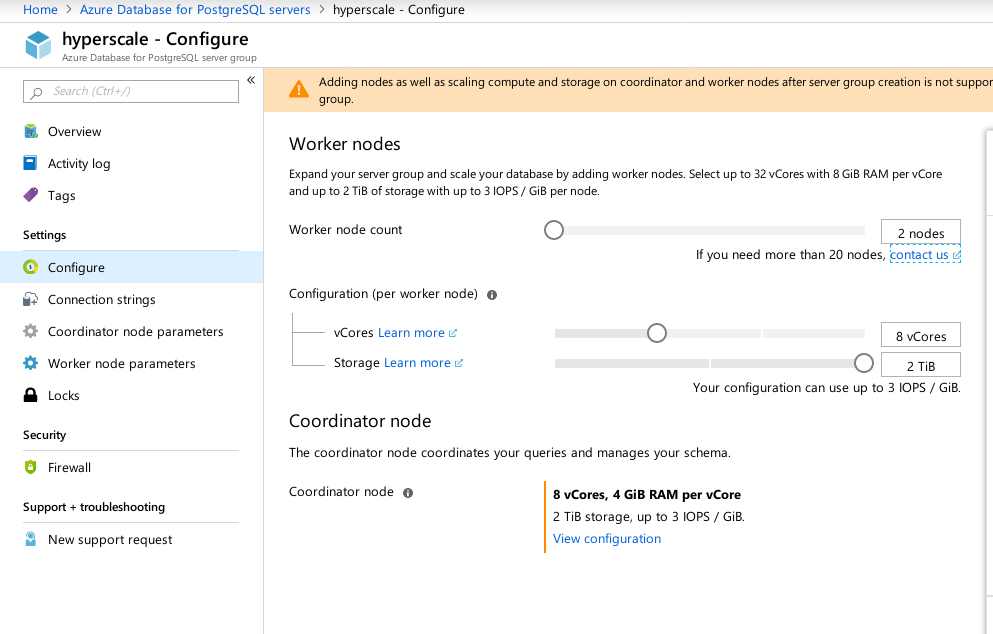
Hyperscale (Citus)
Although not production ready, this option deserved to be looked at, as it provides advanced features not available in AWS and G Cloud.
As a result of acquiring Citus Data Microsoft offers a preview version of their flagship PostgreSQL product, under the name of Hyperscale (Citus).
The portal wizard makes the setup of an otherwise complicated environment, a breeze:
I noted that in contrast to Azure PostgreSQL which runs on Windows, Hyperscale runs on Linux:
citus@hyperscale-c:5432 citus> select version();
                                                    version
----------------------------------------------------------------------------------------------------------------
 PostgreSQL 11.2 on x86_64-pc-linux-gnu, compiled by gcc (Ubuntu 5.4.0-6ubuntu1~16.04.5) 5.4.0 20160609, 64-bit
(1 row)
Unfortunately, while Hyperscale was promising an exciting journey, at this time I couldn’t go ahead with running the tests as max_connections is currently capped to 300, with no option for adjustment, although the ability is documented for the native Citus PosgreSQL:
citus@hyperscale-c:5432 citus> show max_connections ;
 max_connections
-----------------
 300
(1 row)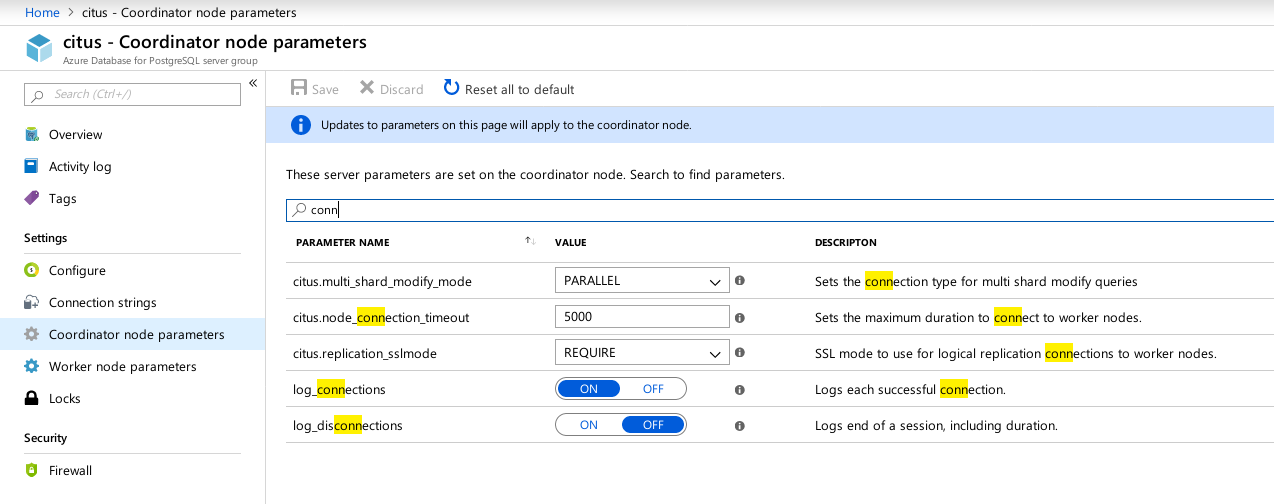
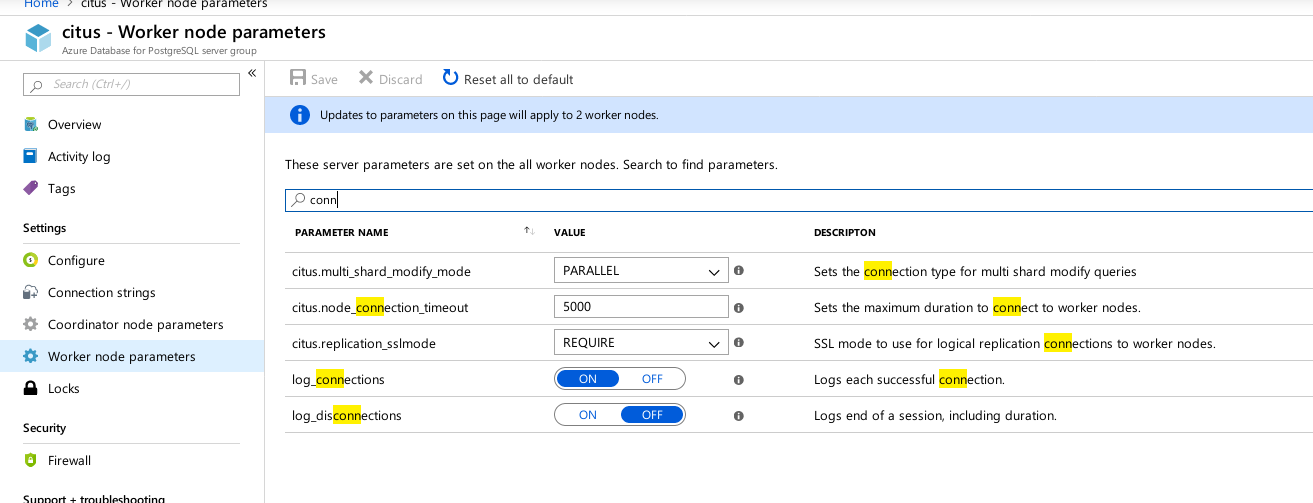
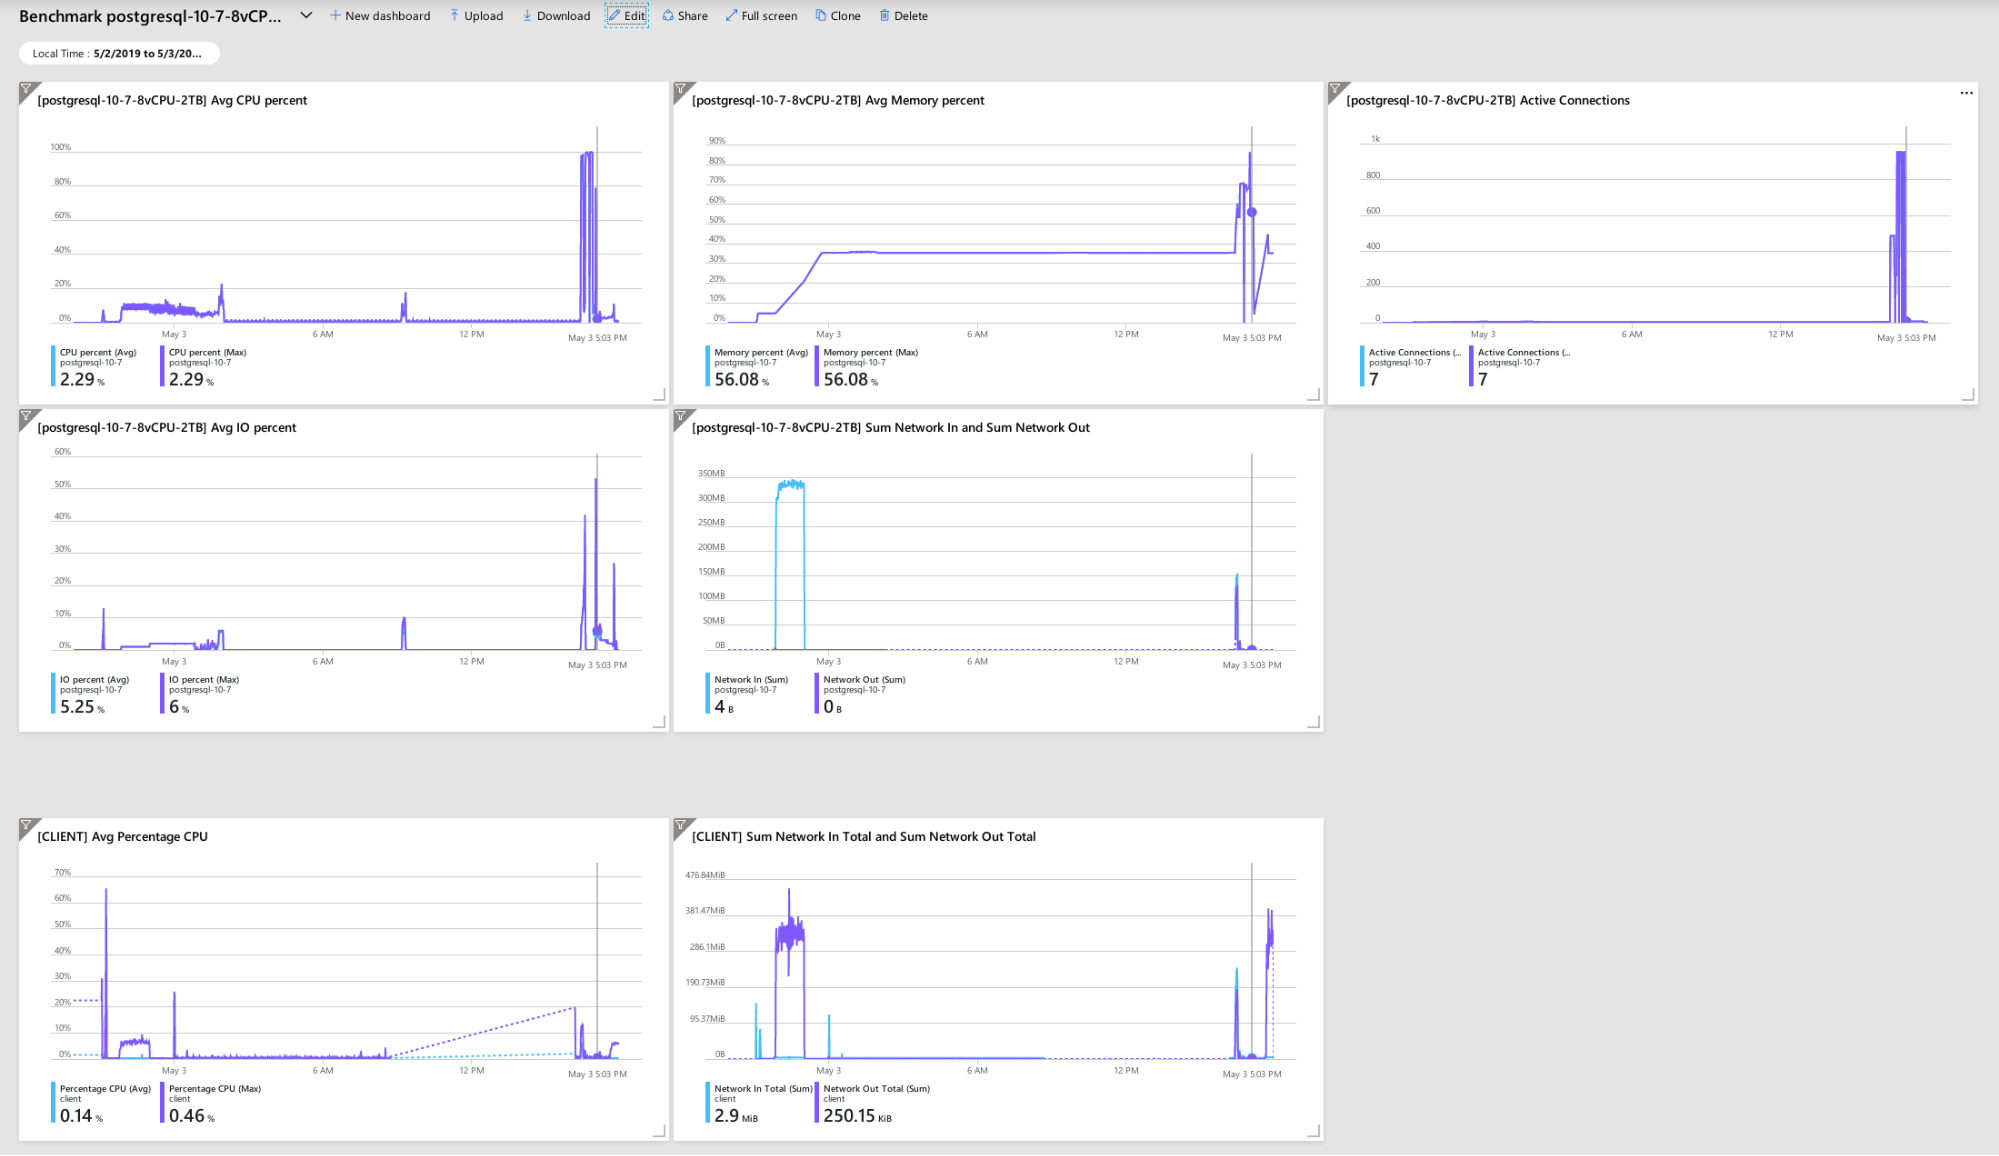
Benchmark Metrics
A few metrics indicative of client and server performance, and behavior:
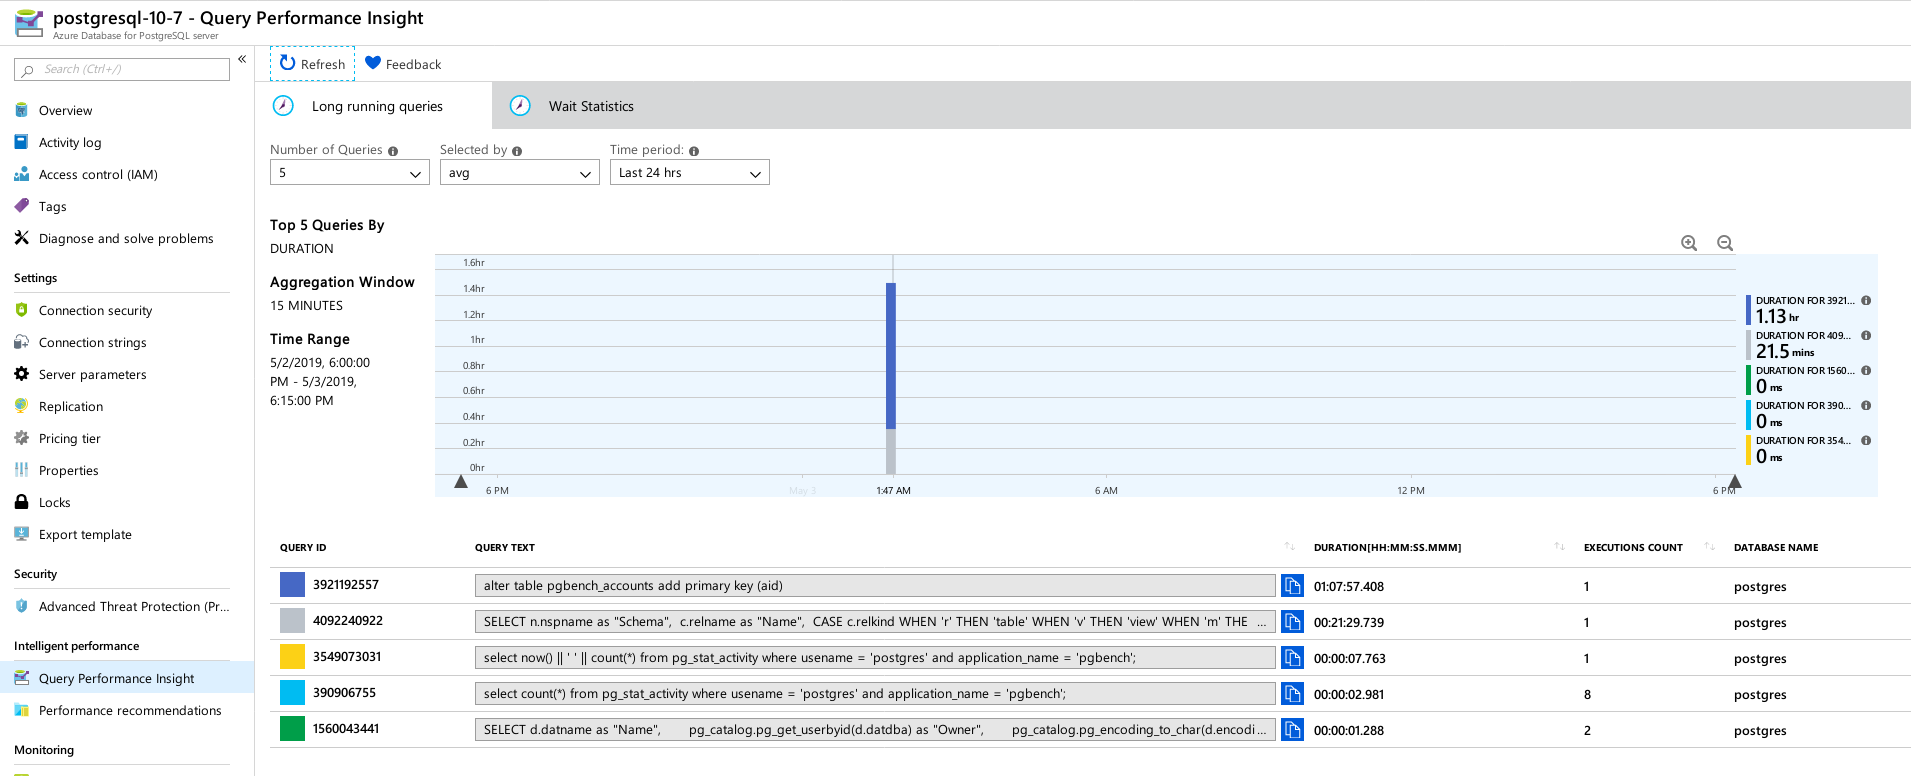
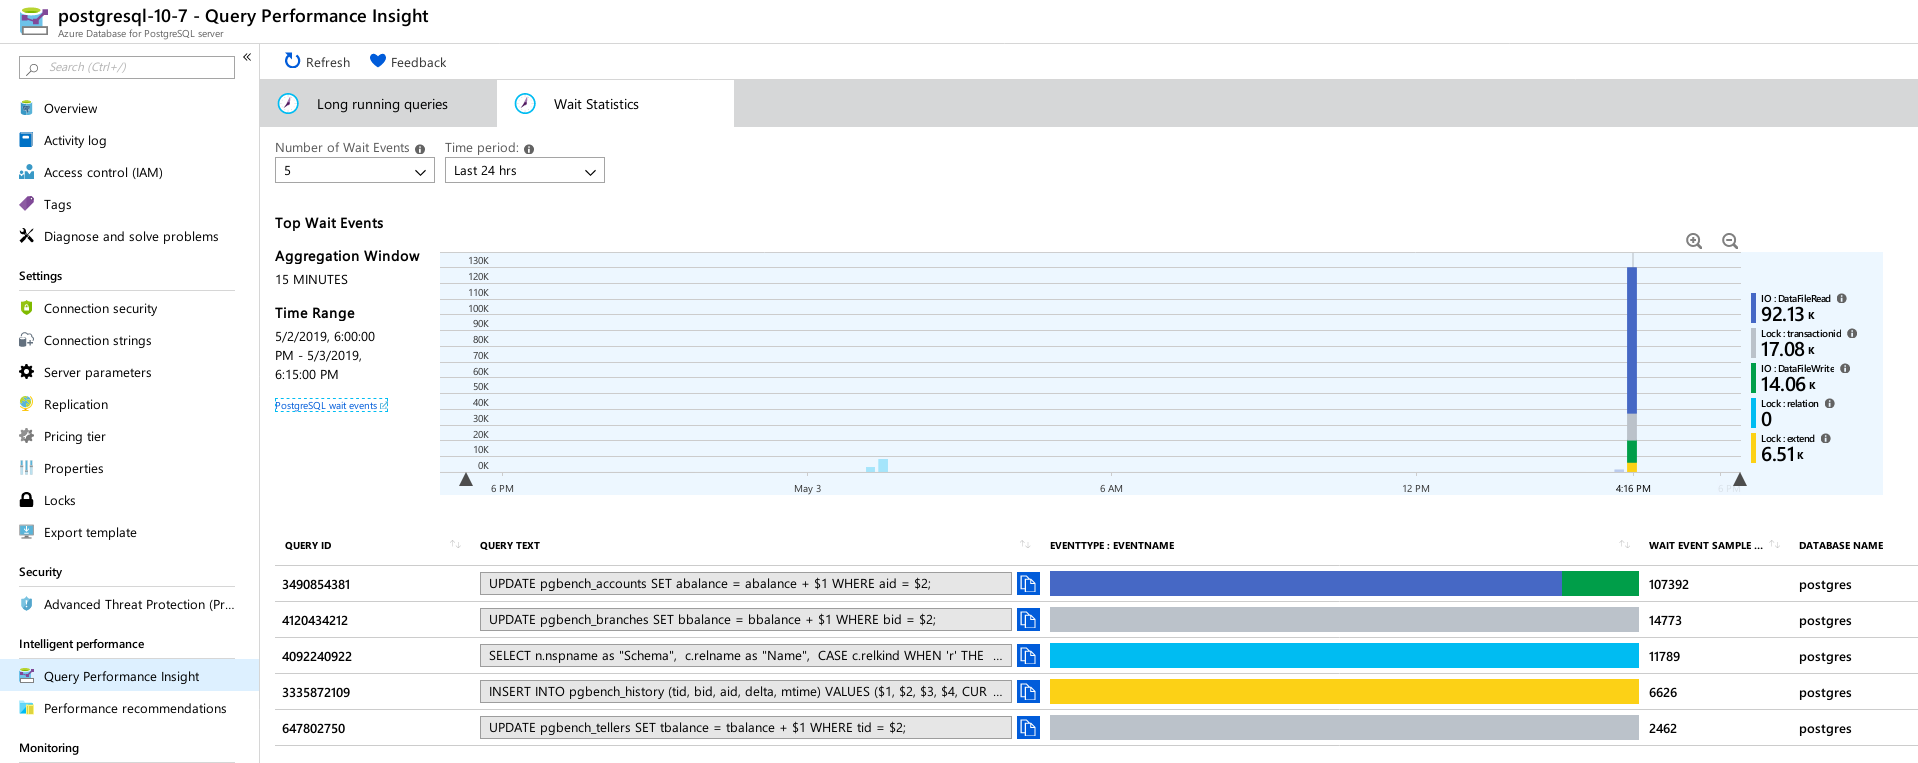
PostgreSQL metrics gathered using the Query Performance Insight:
Conclusion
First, if you made it this far, thank you for reading, and if you happen to spot any mistakes that may have caused the environment to misbehave, I would very much appreciate the feedback. Providing that I missed something obvious I am willing to repeat the tests.
The database engine crash leading to the “NT HARD ERROR” hex dump indicates that something out of user control happened, and a good managed service would recover by means of automation or alerting the SREs in charge. Had I waited more time that could have been the case, although it raises the question of how long users must wait until the service is restored.
Locking max_connections to a value based on pricing tier and vCores took me by surprise, especially after testing the three other managed services, with Google Cloud allowing the parameter to be configured by the user, even though the default value was much lower (600 on G Cloud vs 960 on Azure).
A test with the database instance in the 16-core range may be required in order to avoid altering the default values, although at that time I would prefer to test using better tools, such as HammerDB (see Part 1 for a discussion of tools).
</h2>tl;dr<>