blog
Benchmarking Managed PostgreSQL Cloud Solutions – Google Cloud: Part Three

In this 3rd part of Benchmarking Managed PostgreSQL Cloud Solutions, I took advantage of Google’s GCP free tier offering. It has been a worthwhile experience and as a sysadmin spending most of his time at the console I couldn’t miss the opportunity of trying out cloud shell, one of the console features that sets Google apart from the cloud provider I’m more familiar with, Amazon Web Services.
To quickly recap, in Part 1 I looked at the available benchmark tools and explained why I chose AWS Benchmark Procedure for Aurora. I also benchmarked Amazon Aurora for PostgreSQL version 10.6. In Part 2 I reviewed AWS RDS for PostgreSQL version 11.1.
During this round, the tests based on the AWS Benchmark Procedure for Aurora will be run against Google Cloud SQL for PostgreSQL 9.6 since the version 11.1 is still in beta.
Cloud Instances
Prerequisites
As mentioned in the previous two articles, I opted for leaving PostgreSQL settings at their cloud GUC defaults, unless they prevent tests from running (see further down below). Recall from previous articles that the assumption has been that out of the box the cloud provider should have the database instance configured in order to provide a reasonable performance.
The AWS pgbench timing patch for PostgreSQL 9.6.5 applied cleanly to Google Cloud version of PostgreSQL 9.6.10.
Using the information Google put out in their blog Google Cloud for AWS Professionals I matched up the specs for the client and the target instances with respect to the Compute, Storage, and Networking components. For example, Google Cloud equivalent of AWS Enhanced Networking is achieved by sizing the compute node based on the formula:
max( [vCPUs x 2Gbps/vCPU], 16Gbps)When it comes to setting up the target database instance, similarly to AWS, Google Cloud allows no replicas, however, the storage is encrypted at rest and there is no option to disable it.
Finally, in order to achieve the best network performance, the client and the target instances must be located in the same availability zone.
Client
The client instance specs matching the closest the AWS instance, are:
- vCPU: 32 (16 Cores x 2 Threads/Core)
- RAM: 208 GiB (maximum for the 32 vCPU instance)
- Storage: Compute Engine persistent disk
- Network: 16 Gbps (max of [32 vCPUs x 2 Gbps/vCPU] and 16 Gbps)
Instance details after initialization:
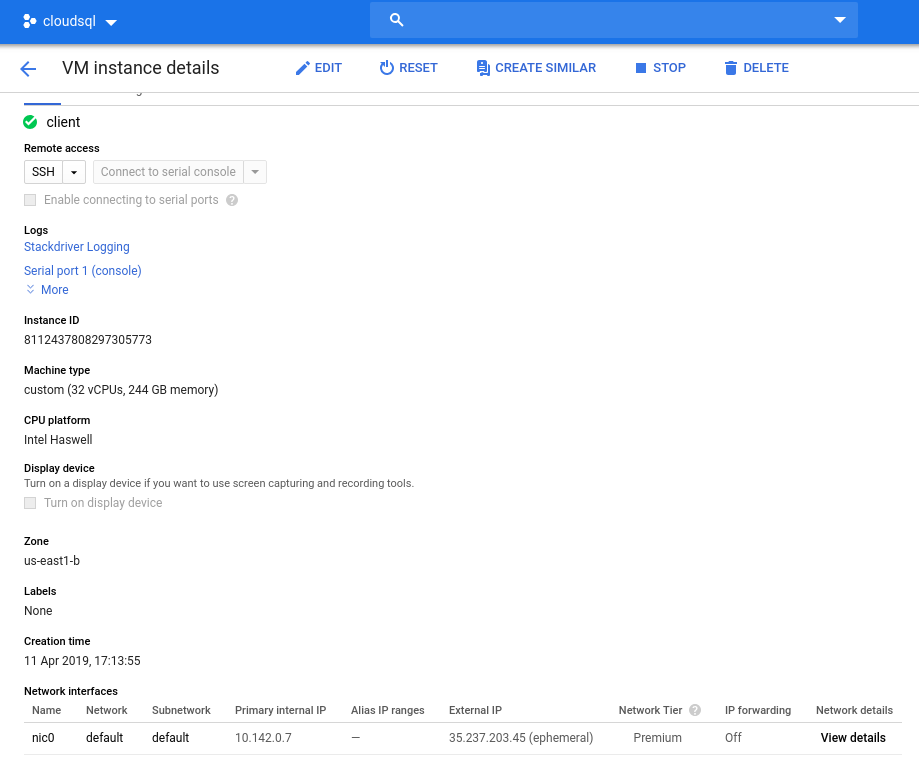
Note: Instances are by default limited to 24 vCPUs. Google Technical Support must approve the quota increase to 32 vCPUs per instance.
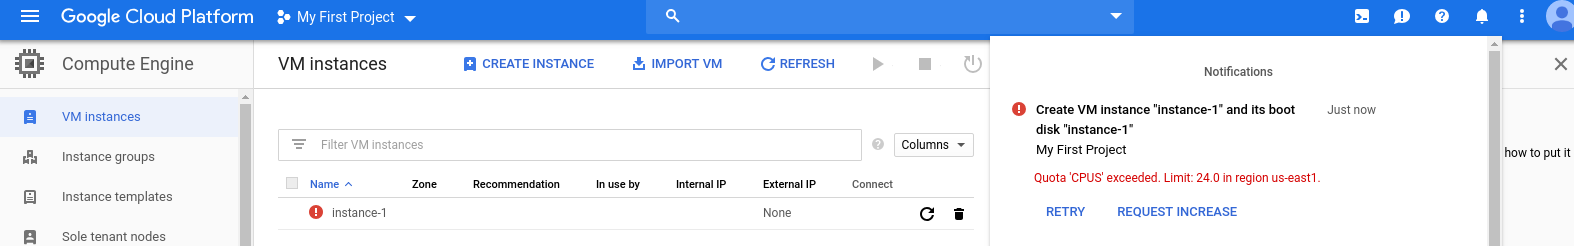
While such requests are usually handled within 2 business days, I have to give Google Support Services a thumbs up for completing my request in only 2 hours.
For the curious, the network speed formula is based on the compute engine documentation referenced in this GCP blog.
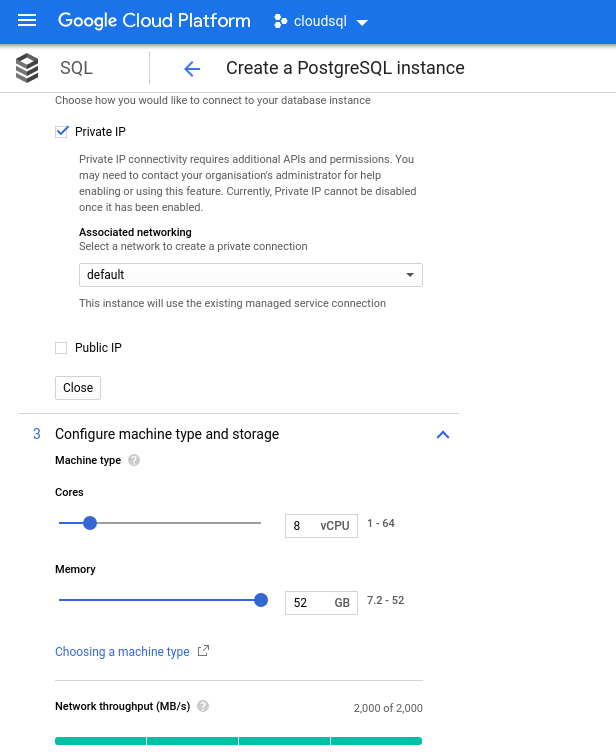
DB Cluster
Below are the database instance specs:
- vCPU: 8
- RAM: 52 GiB (maximum)
- Storage: 144 MB/s, 9,000 IOPS
- Network: 2,000 MB/s
Note that the maximum available memory for an 8 vCPU instance is 52 GiB. More memory can be allocated by selecting a larger instance (more vCPUs):
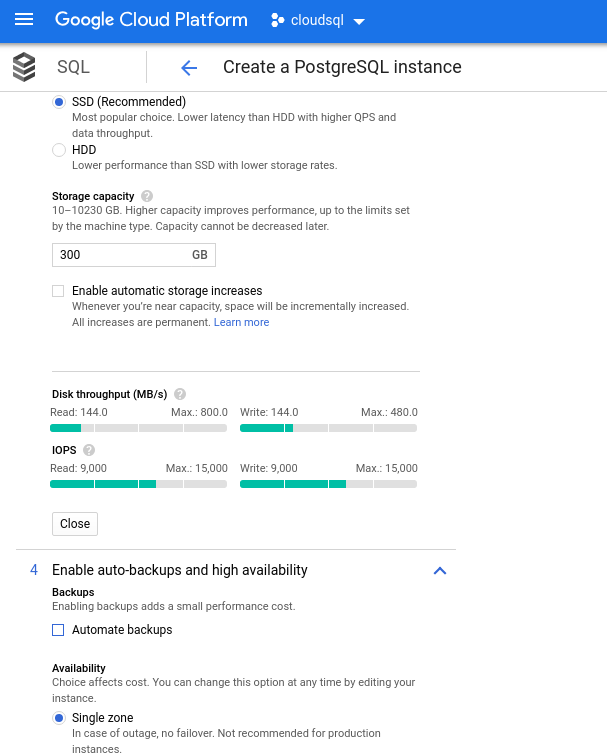
While Google SQL can automatically expand the underlying storage, which by the way is a really cool feature, I chose to disable the option in order to be consistent with the AWS feature set, and avoid a potential I/O impact during the resize operation. (“potential”, because it should have no negative impact at all, however in my experience resizing any type of underlying storage increases the I/O, even if for a few seconds).
Recall that the AWS database instance was backed up by an optimized EBS storage which provided a maximum of:
- 1,700 Mbps bandwidth
- 212.5 MB/s throughput
- 12,000 IOPS
With Google Cloud we achieve a similar configuration by adjusting the number of vCPUs (see above) and storage capacity:
Running the Benchmarks
Setup
Next, install the benchmark tools, pgbench and sysbench by following the instructions in the Amazon guide adapted to PostgreSQL version 9.6.10.
Initialize the PostgreSQL environment variables in .bashrc and set the paths to PostgreSQL binaries and libraries:
export PGHOST=10.101.208.7
export PGUSER=postgres
export PGPASSWORD=postgres
export PGDATABASE=postgres
export PGPORT=5432
export PATH=$PATH:/usr/local/pgsql/bin
export LD_LIBRARY_PATH=$LD_LIBRARY_PATH:/usr/local/pgsql/lib
Preflight checklist:
[root@client ~]# psql --version
psql (PostgreSQL) 9.6.10
[root@client ~]# pgbench --version
pgbench (PostgreSQL) 9.6.10
[root@client ~]# sysbench --version
sysbench 0.5
postgres=> select version();
                                                 version
---------------------------------------------------------------------------------------------------------
 PostgreSQL 9.6.10 on x86_64-pc-linux-gnu, compiled by gcc (Ubuntu 4.8.4-2ubuntu1~14.04.3) 4.8.4, 64-bit
(1 row)
And we are ready for takeoff:
pgbench
Initialize the pgbench database.
[root@client ~]# pgbench -i --fillfactor=90 --scale=10000…and several minutes later:
NOTICE: table "pgbench_history" does not exist, skipping
NOTICE: table "pgbench_tellers" does not exist, skipping
NOTICE: table "pgbench_accounts" does not exist, skipping
NOTICE: table "pgbench_branches" does not exist, skipping
creating tables...
100000 of 1000000000 tuples (0%) done (elapsed 0.09 s, remaining 872.42 s)
200000 of 1000000000 tuples (0%) done (elapsed 0.19 s, remaining 955.00 s)
300000 of 1000000000 tuples (0%) done (elapsed 0.33 s, remaining 1105.08 s)
400000 of 1000000000 tuples (0%) done (elapsed 0.53 s, remaining 1317.56 s)
500000 of 1000000000 tuples (0%) done (elapsed 0.63 s, remaining 1258.72 s)
...
500000000 of 1000000000 tuples (50%) done (elapsed 943.93 s, remaining 943.93 s)
500100000 of 1000000000 tuples (50%) done (elapsed 944.08 s, remaining 943.71 s)
500200000 of 1000000000 tuples (50%) done (elapsed 944.22 s, remaining 943.46 s)
500300000 of 1000000000 tuples (50%) done (elapsed 944.33 s, remaining 943.20 s)
500400000 of 1000000000 tuples (50%) done (elapsed 944.47 s, remaining 942.96 s)
500500000 of 1000000000 tuples (50%) done (elapsed 944.59 s, remaining 942.70 s)
500600000 of 1000000000 tuples (50%) done (elapsed 944.73 s, remaining 942.47 s)
...
999600000 of 1000000000 tuples (99%) done (elapsed 1878.28 s, remaining 0.75 s)
999700000 of 1000000000 tuples (99%) done (elapsed 1878.41 s, remaining 0.56 s)
999800000 of 1000000000 tuples (99%) done (elapsed 1878.58 s, remaining 0.38 s)
999900000 of 1000000000 tuples (99%) done (elapsed 1878.70 s, remaining 0.19 s)
1000000000 of 1000000000 tuples (100%) done (elapsed 1878.83 s, remaining 0.00 s)
vacuum...
set primary keys...
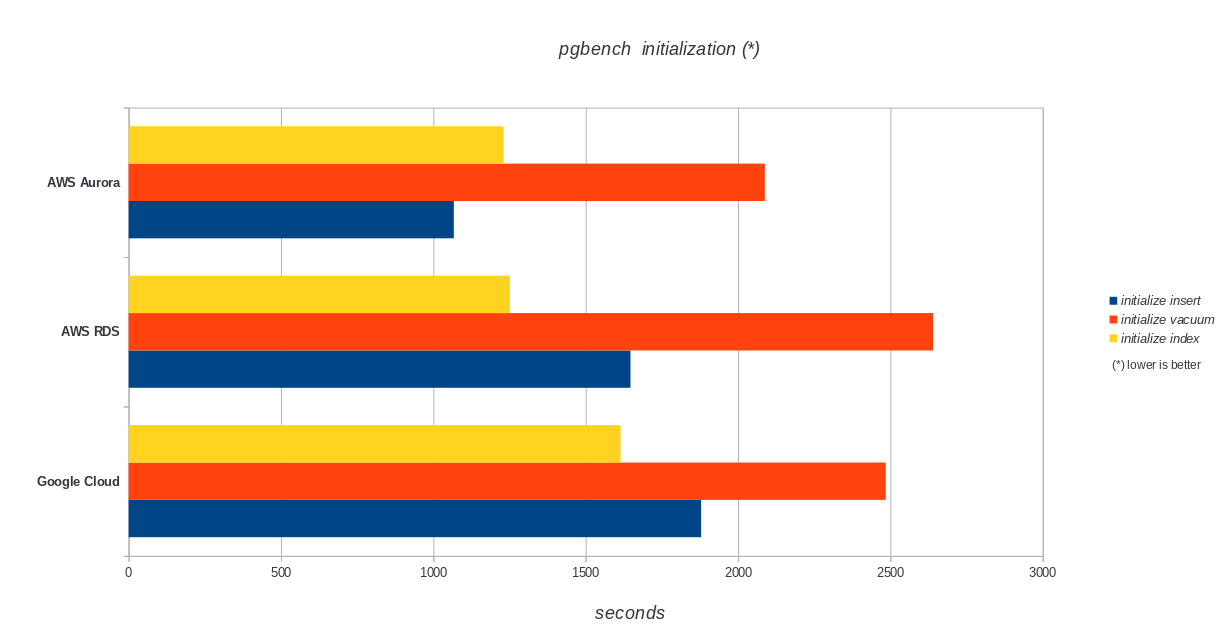
total time: 5978.44 s (insert 1878.90 s, commit 0.04 s, vacuum 2484.96 s, index 1614.54 s)
done.As we are now used to, the database size must be 160GB. Let’s verify that:
postgres=>  SELECT
postgres->       d.datname AS Name,
postgres->       pg_catalog.pg_get_userbyid(d.datdba) AS Owner,
postgres->       pg_catalog.pg_size_pretty(pg_catalog.pg_database_size(d.datname)) AS SIZE
postgres->    FROM pg_catalog.pg_database d
postgres->    WHERE d.datname = 'postgres';
   name   |       owner       |  size
----------+-------------------+--------
postgres | cloudsqlsuperuser | 160 GB
(1 row)
With all the preparations completed start the read/write test:
[root@client ~]# pgbench --protocol=prepared -P 60 --time=600 --client=1000 --jobs=2048
starting vacuum...end.
connection to database "postgres" failed:
FATAL:  sorry, too many clients already :: proc.c:341
connection to database "postgres" failed:
FATAL:  sorry, too many clients already :: proc.c:341
connection to database "postgres" failed:
FATAL:  remaining connection slots are reserved for non-replication superuser connections
Oops! What is the maximum?
postgres=> show max_connections ;
 max_connections
-----------------
 600
(1 row)
So, while AWS sets a largely enough max_connections as I didn’t encounter that issue, Google Cloud requires a small tweak…Back to the cloud console, update the database parameter, wait a few minutes and then check:
postgres=> show max_connections ;
 max_connections
-----------------
 1005
(1 row)
Restarting the test everything appears to be working just fine:
starting vacuum...end.
progress: 60.0 s, 5461.7 tps, lat 172.821 ms stddev 251.666
progress: 120.0 s, 4444.5 tps, lat 225.162 ms stddev 365.695
progress: 180.0 s, 4338.5 tps, lat 230.484 ms stddev 373.998
…but there is another catch. I was in for a surprise when attempting to open a new psql session in order to count the number of connections:
psql: FATAL: remaining connection slots are reserved for non-replication superuser connectionsCould it be that superuser_reserved_connections isn’t at its default?
postgres=> show superuser_reserved_connections ;
 superuser_reserved_connections
--------------------------------
 3
(1 row)
That is the default, then what else could it be?
postgres=> select usename from pg_stat_activity ;
   usename
---------------
cloudsqladmin
cloudsqlagent
postgres
(3 rows)
Bingo! Another bump of max_connections takes care of it, however, it required that I restart the pgbench test. And that is folks the story behind the apparent duplicate run in the graphs below.
And finally, the results are in:
progress: 60.0 s, 4553.6 tps, lat 194.696 ms stddev 250.663
progress: 120.0 s, 3646.5 tps, lat 278.793 ms stddev 434.459
progress: 180.0 s, 3130.4 tps, lat 332.936 ms stddev 711.377
progress: 240.0 s, 3998.3 tps, lat 250.136 ms stddev 319.215
progress: 300.0 s, 3305.3 tps, lat 293.250 ms stddev 549.216
progress: 360.0 s, 3547.9 tps, lat 289.526 ms stddev 454.484
progress: 420.0 s, 3770.5 tps, lat 265.977 ms stddev 470.451
progress: 480.0 s, 3050.5 tps, lat 327.917 ms stddev 643.983
progress: 540.0 s, 3591.7 tps, lat 273.906 ms stddev 482.020
progress: 600.0 s, 3350.9 tps, lat 296.303 ms stddev 566.792
transaction type:
scaling factor: 10000
query mode: prepared
number of clients: 1000
number of threads: 1000
duration: 600 s
number of transactions actually processed: 2157735
latency average = 278.149 ms
latency stddev = 503.396 ms
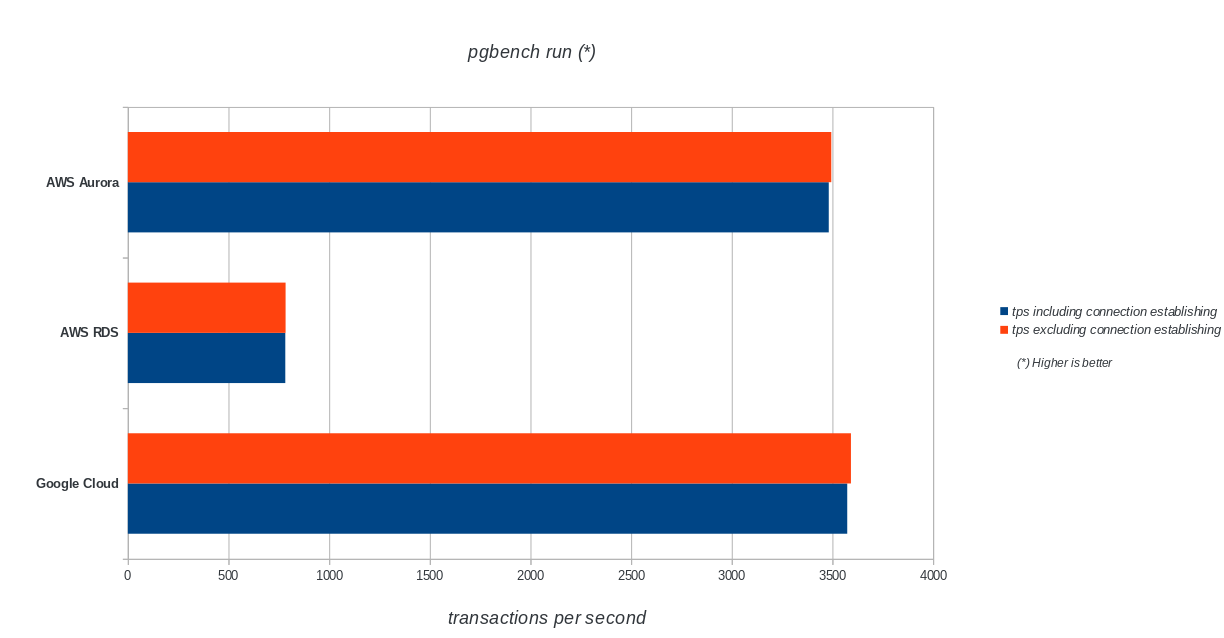
tps = 3573.331659 (including connections establishing)
tps = 3591.759513 (excluding connections establishing) sysbench
Populate the database:
sysbench --test=/usr/local/share/sysbench/oltp.lua
--pgsql-host=${PGHOST}
--pgsql-db=${PGDATABASE}
--pgsql-user=${PGUSER}
--pgsql-password=${PGPASSWORD}
--pgsql-port=${PGPORT}
--oltp-tables-count=250
--oltp-table-size=450000
prepare
Output:
sysbench 0.5:  multi-threaded system evaluation benchmark
Creating table 'sbtest1'...
Inserting 450000 records into 'sbtest1'
Creating secondary indexes on 'sbtest1'...
Creating table 'sbtest2'...
Inserting 450000 records into 'sbtest2'
...
Creating table 'sbtest249'...
Inserting 450000 records into 'sbtest249'
Creating secondary indexes on 'sbtest249'...
Creating table 'sbtest250'...
Inserting 450000 records into 'sbtest250'
Creating secondary indexes on 'sbtest250'...
And now run the test:
sysbench --test=/usr/local/share/sysbench/oltp.lua
--pgsql-host=${PGHOST}
--pgsql-db=${PGDATABASE}
--pgsql-user=${PGUSER}
--pgsql-password=${PGPASSWORD}
--pgsql-port=${PGPORT}
--oltp-tables-count=250
--oltp-table-size=450000
--max-requests=0
--forced-shutdown
--report-interval=60
--oltp_simple_ranges=0
--oltp-distinct-ranges=0
--oltp-sum-ranges=0
--oltp-order-ranges=0
--oltp-point-selects=0
--rand-type=uniform
--max-time=600
--num-threads=1000
run
And the results:
sysbench 0.5: multi-threaded system evaluation benchmark
Running the test with following options:
Number of threads: 1000
Report intermediate results every 60 second(s)
Random number generator seed is 0 and will be ignored
Forcing shutdown in 630 seconds
Initializing worker threads...
Threads started!
[ 60s] threads: 1000, tps: 1320.25, reads: 0.00, writes: 5312.62, response time: 1484.54ms (95%), errors: 0.00, reconnects: 0.00
[ 120s] threads: 1000, tps: 1486.77, reads: 0.00, writes: 5944.30, response time: 1290.87ms (95%), errors: 0.00, reconnects: 0.00
[ 180s] threads: 1000, tps: 1143.62, reads: 0.00, writes: 4585.67, response time: 1649.50ms (95%), errors: 0.02, reconnects: 0.00
[ 240s] threads: 1000, tps: 1498.23, reads: 0.00, writes: 5993.06, response time: 1269.03ms (95%), errors: 0.00, reconnects: 0.00
[ 300s] threads: 1000, tps: 1520.53, reads: 0.00, writes: 6058.57, response time: 1439.90ms (95%), errors: 0.02, reconnects: 0.00
[ 360s] threads: 1000, tps: 1234.57, reads: 0.00, writes: 4958.08, response time: 1550.39ms (95%), errors: 0.02, reconnects: 0.00
[ 420s] threads: 1000, tps: 1722.25, reads: 0.00, writes: 6890.98, response time: 1132.25ms (95%), errors: 0.00, reconnects: 0.00
[ 480s] threads: 1000, tps: 2306.25, reads: 0.00, writes: 9233.84, response time: 842.11ms (95%), errors: 0.00, reconnects: 0.00
[ 540s] threads: 1000, tps: 1432.85, reads: 0.00, writes: 5720.15, response time: 1709.83ms (95%), errors: 0.02, reconnects: 0.00
[ 600s] threads: 1000, tps: 1332.93, reads: 0.00, writes: 5347.10, response time: 1443.78ms (95%), errors: 0.02, reconnects: 0.00
OLTP test statistics:
queries performed:
read: 0
write: 3603595
other: 1801795
total: 5405390
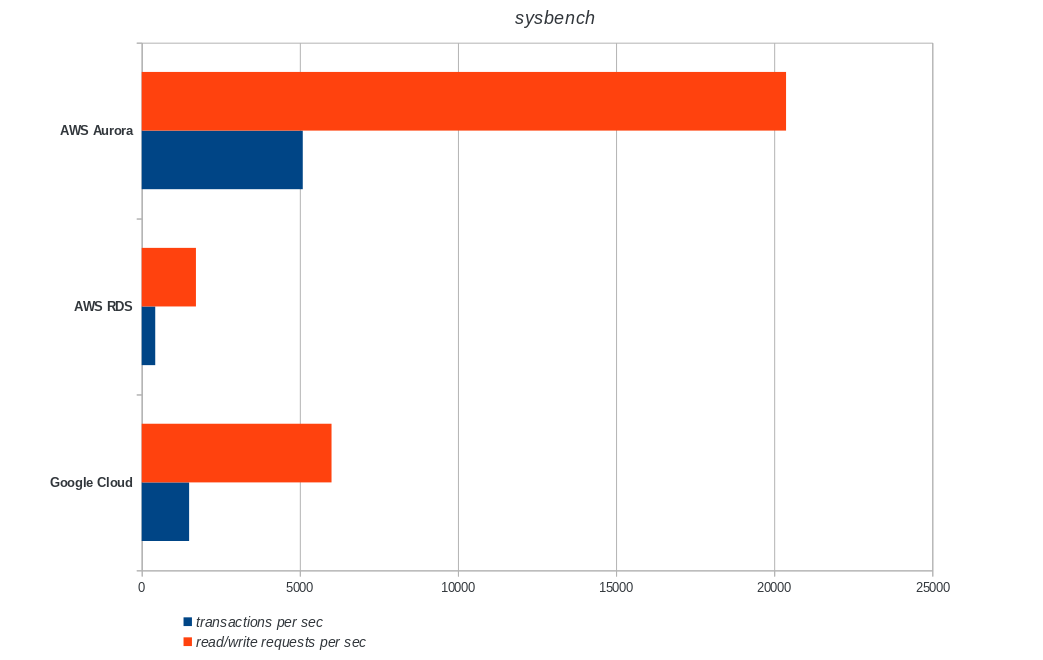
transactions: 900895 (1500.68 per sec.)
read/write requests: 3603595 (6002.76 per sec.)
other operations: 1801795 (3001.38 per sec.)
ignored errors: 5 (0.01 per sec.)
reconnects: 0 (0.00 per sec.)
General statistics:
total time: 600.3231s
total number of events: 900895
total time taken by event execution: 600164.2510s
response time:
min: 6.78ms
avg: 666.19ms
max: 4218.55ms
approx. 95 percentile: 1397.02ms
Threads fairness:
events (avg/stddev): 900.8950/14.19
execution time (avg/stddev): 600.1643/0.10Benchmark Metrics
The PostgreSQL plugin for Stackdriver has been deprecated as of February 28th, 2019. While Google recommends Blue Medora, for the purpose of this article I chose to do away with creating an account and to rely on available Stackdriver metrics.
- CPU Utilization:
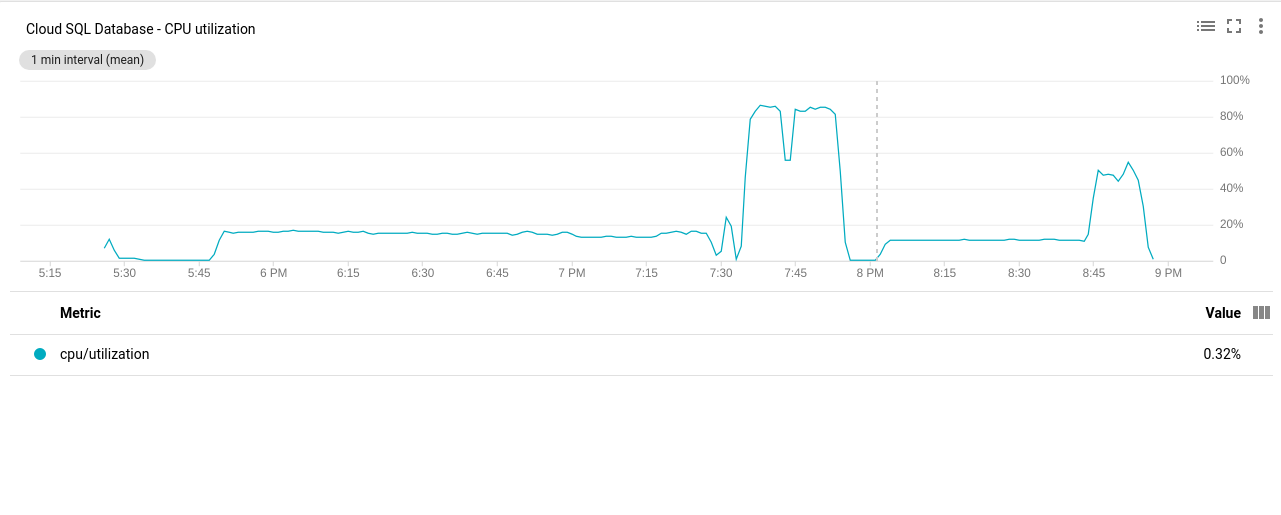 Google Cloud SQL: PostgreSQL CPU Utilization
 - Disk Read/Write operations:
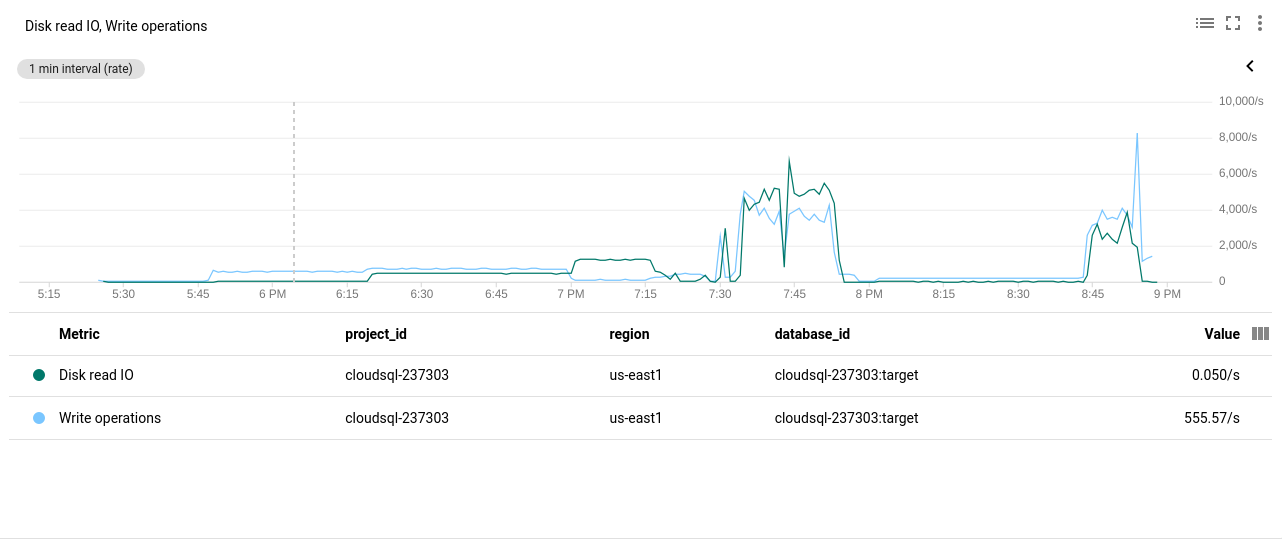 Google Cloud SQL: PostgreSQL Disk Read/Write operations
 - Network Sent/Received Bytes:
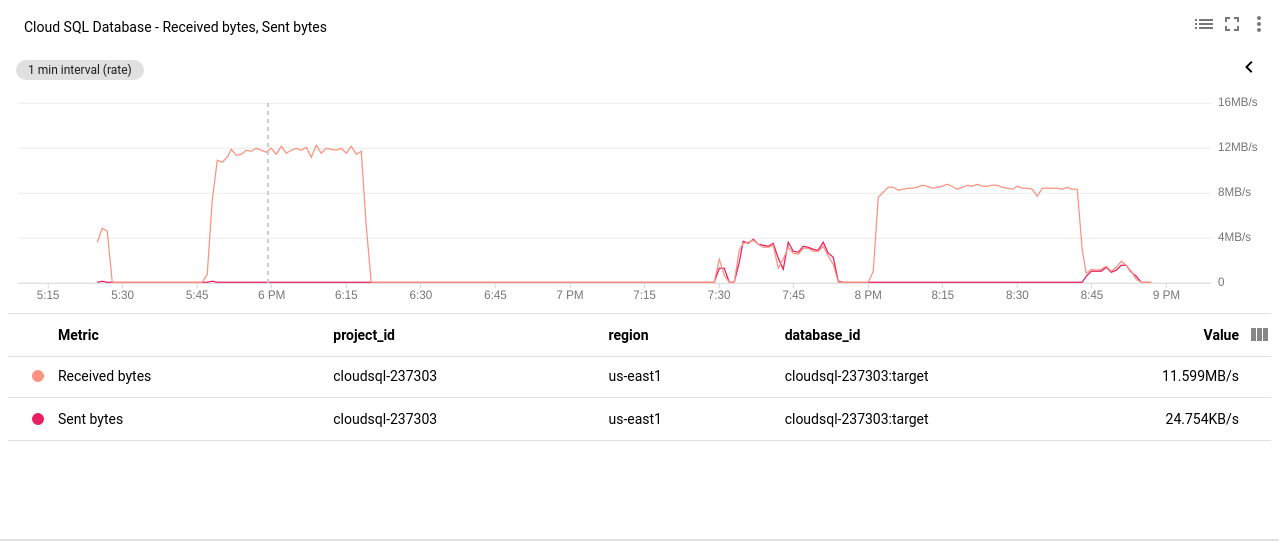 Google Cloud SQL: PostgreSQL Network Sent/Received bytes
 - PostgreSQL Connections Count:
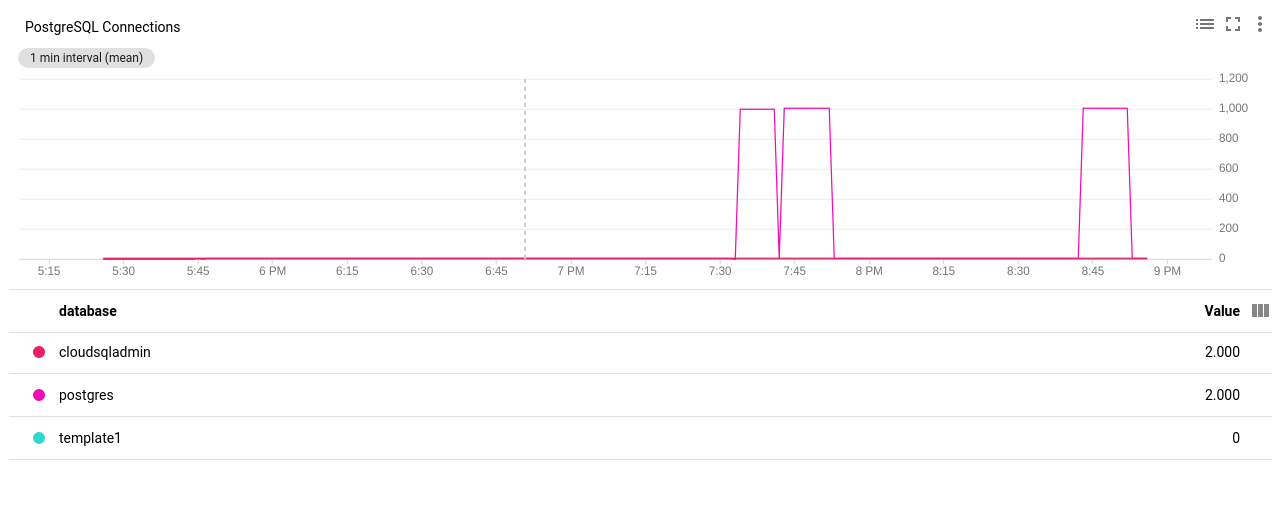 Google Cloud SQL: PostgreSQL Connections Count
Benchmark Results
pgbench Initialization
pgbench run
sysbench
Conclusion
Amazon Aurora comes first by far in write heavy (sysbench) tests, while being at par with Google Cloud SQL in the pgbench read/write tests. The load test (pgbench initialization) puts Google Cloud SQL in the first place, followed by Amazon RDS. Based on a cursory look at the pricing models for AWS Aurora and Google Cloud SQL, I would hazard to say that out of the box Google Cloud is a better choice for the average user, while AWS Aurora is better suited for high performance environments. More analysis will follow after completing all the benchmarks.
The next and last part of this benchmark series will be on Microsoft Azure PostgreSQL.
Thanks for reading and please comment below if you have feedback.