blog
What to Check if MySQL Memory Utilisation is High

One of the key factors of a performant MySQL database server is having good memory allocation and utilization, especially when running it in a production environment. But how can you determine if the MySQL utilization is optimized? Is it reasonable to have high memory utilization or does it require fine tuning? What if I come up against a memory leak?
Let’s cover these topics and show the things you can check in MySQL to determine traces of high memory utilization.
Memory Allocation in MySQL
Before we delve into the specific subject title, I’ll just give a short information about how MySQL uses memory. Memory plays a significant resource for speed and efficiency when handling concurrent transactions and running big queries. Each thread in MySQL demands memory which is used to manage client connections, and these threads share the same base memory. Variables like thread_stack (stack for threads), net_buffer_length (for connection buffer and result buffer), or with max_allowed_packet where connection and result will dynamically enlarge up to this value when needed, are variables that do affect memory utilization. When a thread is no longer needed, the memory allocated to it is released and returned to the system unless the thread goes back into the thread cache. In that case, the memory remains allocated. Query joins, query caches, sorting, table cache, table definitions do require memory in MySQL but these are attributed with system variables that you can configure and set.
In most cases, the memory-specific variables set for a configuration are targeted on a storage-based specific configuration such as MyISAM or InnoDB. When a mysqld instance spawns within the host system, MySQL allocates buffers and caches to improve performance of database operations based on the set values set on a specific configuration. For example, the most common variables every DBA will set in InnoDB are variables innodb_buffer_pool_size and innodb_buffer_pool_instances which are both related to buffer pool memory allocation that holds cached data for InnoDB tables. It’s desirable if you have large memory and are expecting to handle big transactions by setting innodb_buffer_pool_instances to improve concurrency by dividing the buffer pool into multiple buffer pool instances.
While for MyISAM, you have to deal with key_buffer_size to handle the amount of memory that the key buffer will handle. MyISAM also allocates buffer for every concurrent threads which contains a table structure, column structures for each column, and a buffer of size 3 * N are allocated (where N is the maximum row length, not counting BLOB columns). MyISAM also maintains one extra row buffer for internal use.
MySQL also allocates memory for temporary tables unless it becomes too large (determined by tmp_table_size and max_heap_table_size). If you are using MEMORY tables and variable max_heap_table_size is set very high, this can also take a large memory since max_heap_table_size system variable determines how large a table can grow, and there is no conversion to on-disk format.
MySQL also has a Performance Schema which is a feature for monitoring MySQL activities at a low level. Once this is enabled, it dynamically allocates memory incrementally, scaling its memory use to actual server load, instead of allocating required memory during server startup. Once memory is allocated, it is not freed until the server is restarted.
MySQL can also be configured to allocate large areas of memory for its buffer pool if using Linux and if kernel is enabled for large page support, i.e. using HugePages.
What To Check Once MySQL Memory is High
Check Running Queries
It’s very common for MySQL DBAs to touch base first what’s going on with the running MySQL server. The most basic procedures are check processlist, check server status, and check the storage engine status. To do these things, basically, you have just to run the series of queries by logging in to MySQL. See below:
To view the running queries,
mysql> SHOW [FULL] PROCESSLIST;Viewing the current processlist reveals queries that are running actively or even idle or sleeping processes. It is very important and is a significant routine to have a record of queries that are running. As noted on how MySQL allocates memory, running queries will utilize memory allocation and can drastically cause performance issues if not monitored.
View the MySQL server status variables,
mysql> SHOW SERVER STATUSGor filter specific variables like
mysql> SHOW SERVER STATUS WHERE variable_name IN ('', 'var2'...);MySQL’s status variables serve as your statistical information to grab metric data to determine how your MySQL performs by observing the counters given by the status values. There are certain values here which gives you a glance that impacts memory utilization. For example, checking the number of threads, the number of table caches, or the buffer pool usage,
...

| Created_tmp_disk_tables                 | 24240 |

| Created_tmp_tables                      | 334999 |

…

| Innodb_buffer_pool_pages_data           | 754         |

| Innodb_buffer_pool_bytes_data           | 12353536         |

...

| Innodb_buffer_pool_pages_dirty          | 6         |

| Innodb_buffer_pool_bytes_dirty          | 98304         |

| Innodb_buffer_pool_pages_flushed        | 30383         |

| Innodb_buffer_pool_pages_free           | 130289         |

…

| Open_table_definitions                  | 540 |

| Open_tables                             | 1024 |

| Opened_table_definitions                | 540 |

| Opened_tables                           | 700887 |

...

| Threads_connected                             | 5 |

...

| Threads_cached    | 2 |

| Threads_connected | 5     |

| Threads_created   | 7 |

| Threads_running   | 1 |
View the engine’s monitor status, for example, InnoDB status
mysql> SHOW ENGINE INNODB STATUSGThe InnoDB status also reveals the current status of transactions that the storage engine is processing. It gives you the heap size of a transaction, adaptive hash indexes revealing its buffer usage, or shows you the innodb buffer pool information just like the example below:
---TRANSACTION 10798819, ACTIVE 0 sec inserting, thread declared inside InnoDB 1201

mysql tables in use 1, locked 1

1 lock struct(s), heap size 1136, 0 row lock(s), undo log entries 8801

MySQL thread id 68481, OS thread handle 139953970235136, query id 681821 localhost root copy to tmp table

ALTER TABLE NewAddressCode2_2 ENGINE=INNODB


…

-------------------------------------

INSERT BUFFER AND ADAPTIVE HASH INDEX

-------------------------------------

Ibuf: size 528, free list len 43894, seg size 44423, 1773 merges

merged operations:

 insert 63140, delete mark 0, delete 0

discarded operations:

 insert 0, delete mark 0, delete 0

Hash table size 553193, node heap has 1 buffer(s)

Hash table size 553193, node heap has 637 buffer(s)

Hash table size 553193, node heap has 772 buffer(s)

Hash table size 553193, node heap has 1239 buffer(s)

Hash table size 553193, node heap has 2 buffer(s)

Hash table size 553193, node heap has 0 buffer(s)

Hash table size 553193, node heap has 1 buffer(s)

Hash table size 553193, node heap has 1 buffer(s)

115320.41 hash searches/s, 10292.51 non-hash searches/s

...

----------------------

BUFFER POOL AND MEMORY

----------------------

Total large memory allocated 2235564032

Dictionary memory allocated 3227698

Internal hash tables (constant factor + variable factor)

    Adaptive hash index 78904768        (35404352 + 43500416)

    Page hash           277384 (buffer pool 0 only)

    Dictionary cache    12078786 (8851088 + 3227698)

    File system         1091824 (812272 + 279552)

    Lock system         5322504 (5313416 + 9088)

    Recovery system     0 (0 + 0)

Buffer pool size   131056

Buffer pool size, bytes 2147221504

Free buffers       8303

Database pages     120100

Old database pages 44172

Modified db pages  108784

Pending reads      0

Pending writes: LRU 2, flush list 342, single page 0

Pages made young 533709, not young 181962

3823.06 youngs/s, 1706.01 non-youngs/s

Pages read 4104, created 236572, written 441223

38.09 reads/s, 339.46 creates/s, 1805.87 writes/s

Buffer pool hit rate 1000 / 1000, young-making rate 12 / 1000 not 5 / 1000

Pages read ahead 0.00/s, evicted without access 0.00/s, Random read ahead 0.00/s

LRU len: 120100, unzip_LRU len: 0

I/O sum[754560]:cur[8096], unzip sum[0]:cur[0]

…
Another thing to add, you can also use Performance Schema and sys schema for monitoring memory consumption and utilization by your MySQL server. By default, most instrumentations are disabled by default so there are manual things to do to use this.
Check for Swappiness
Either way, it’s probable that MySQL is swapping out its memory to disk. This is oftentimes a very common situation especially when MySQL server and the underlying hardware is not set optimally in parallel to the expected requirements. There are certain cases that the demand of traffic has not been anticipated, memory could grow increasingly especially if bad queries are run causing to consume or utilize a lot of memory space causing degrading performance as data are picked on disk instead of on the buffer. To check for swappiness, just run freemem command or vmstat just like below,
[root@node1 ~]# free -m

              total        used free      shared buff/cache available

Mem:           3790 2754         121 202 915         584

Swap:          1535 39        1496

[root@node1 ~]# vmstat 5 5

procs -----------memory---------- ---swap-- -----io---- -system-- ------cpu-----

 r  b swpd   free buff  cache si so    bi bo in cs us sy id wa st

 2  0 40232 124100      0 937072 2 3 194  1029 477 313 7 2 91 1  0

 0  0 40232 123912      0 937228 0 0   0 49 1247 704 13 3 84  0 0

 1  0 40232 124184      0 937212 0 0   0 35 751 478 6 1 93  0 0

 0  0 40232 123688      0 937228 0 0   0 15 736 487 5 1 94  0 0

 0  0 40232 123912      0 937220 0 0   3 74 1065 729 8 2 89  0 0
You may also check using procfs and gather information such as going to /proc/vmstat or /proc/meminfo.
Using Perf, gdb, and Valgrind with Massif
Using tools like perf, gdb, and valgrind helps you dig into a more advanced method of determining MySQL memory utilization. There are times that an interesting outcome becomes a mystery of solving memory consumption that leads to your bewilderment in MySQL. This turns in the need to have more skepticism and using these tools helps you investigate how MySQL is using handling memory from allocating it to utilizing it for processing transactions or processes. This is useful for example if you are observing MySQL is behaving abnormally that might cause bad configuration or could lead to a findings of memory leaks.
For example, using perf in MySQL reveals more information in a system level report:
[root@testnode5 ~]# perf report --input perf.data --stdio

# To display the perf.data header info, please use --header/--header-only options.

#

#

# Total Lost Samples: 0

#

# Samples: 54K of event 'cpu-clock'

# Event count (approx.): 13702000000

#

# Overhead  Command Shared Object        Symbol

# ........  ....... ...................  ...................................................................................................................................................................................................

#

    60.66%  mysqld [kernel.kallsyms]    [k] _raw_spin_unlock_irqrestore

     2.79%  mysqld   libc-2.17.so         [.] __memcpy_ssse3

     2.54%  mysqld   mysqld             [.] ha_key_cmp

     1.89%  mysqld   [vdso]             [.] __vdso_clock_gettime

     1.05%  mysqld   mysqld             [.] rec_get_offsets_func

     1.03%  mysqld   mysqld             [.] row_sel_field_store_in_mysql_format_func

     0.92%  mysqld   mysqld             [.] _mi_rec_pack

     0.91%  mysqld   [kernel.kallsyms]    [k] finish_task_switch

     0.90%  mysqld   mysqld             [.] row_search_mvcc

     0.86%  mysqld   mysqld             [.] decimal2bin

     0.83%  mysqld   mysqld             [.] _mi_rec_check

….
Since this can be a special topic to dig in, we suggest you look into these really good external blogs as your references, perf Basics for MySQL Profiling, Finding MySQL Scaling Problems Using perf, or learn how to debug using valgrind with massif.
Efficient Way To Check MySQL Memory Utilization
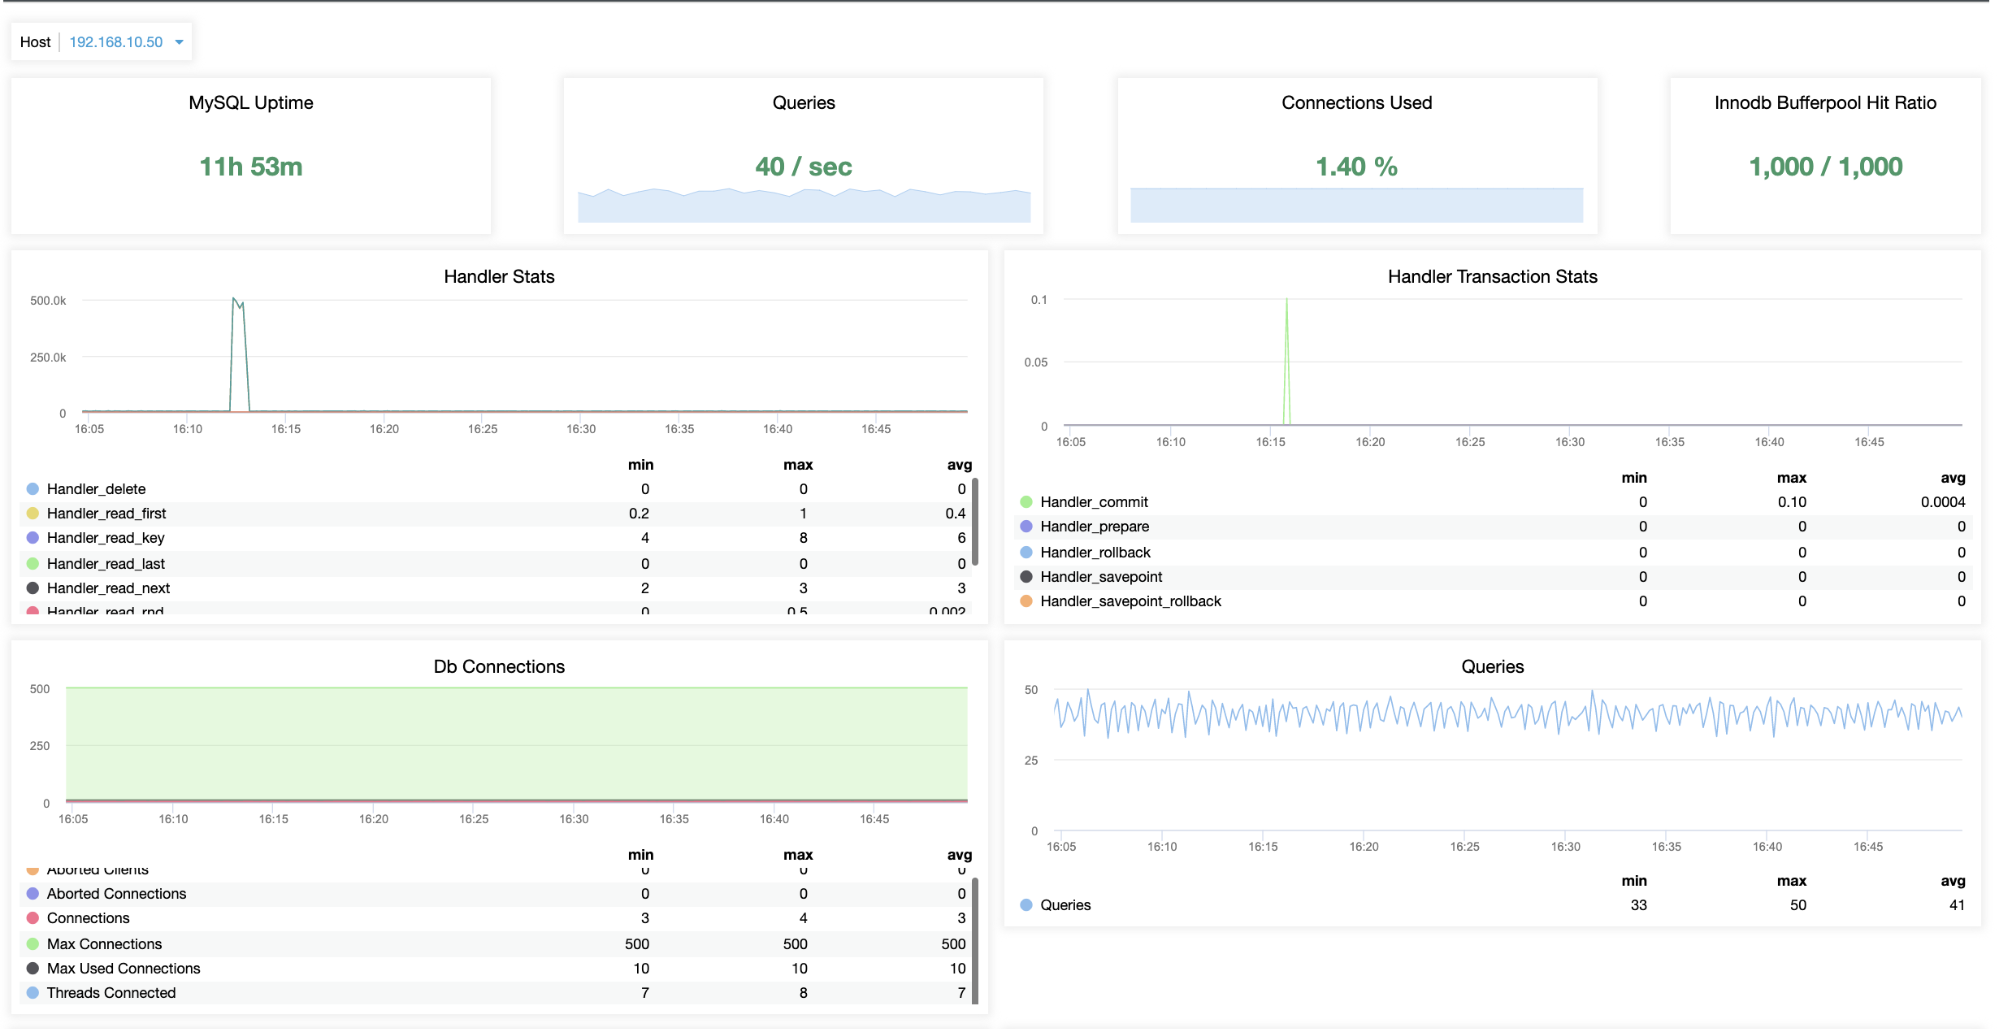
Using ClusterControl relieves any hassle routines like going over through your runbooks or even creating your own playbooks that would deliver reports for you. In ClusterControl, you have Dashboards (using SCUMM) where you can have a quick overview of your MySQL node(s). For example, viewing the MySQL General dashboard,

you can determine how the MySQL node performs,


You see that the images above reveal variables that impact MySQL memory utilization. You can check how the metrics for sort caches, temporary tables, threads connected, query cache, or storage engines innodb buffer pool or MyISAM’s key buffer.
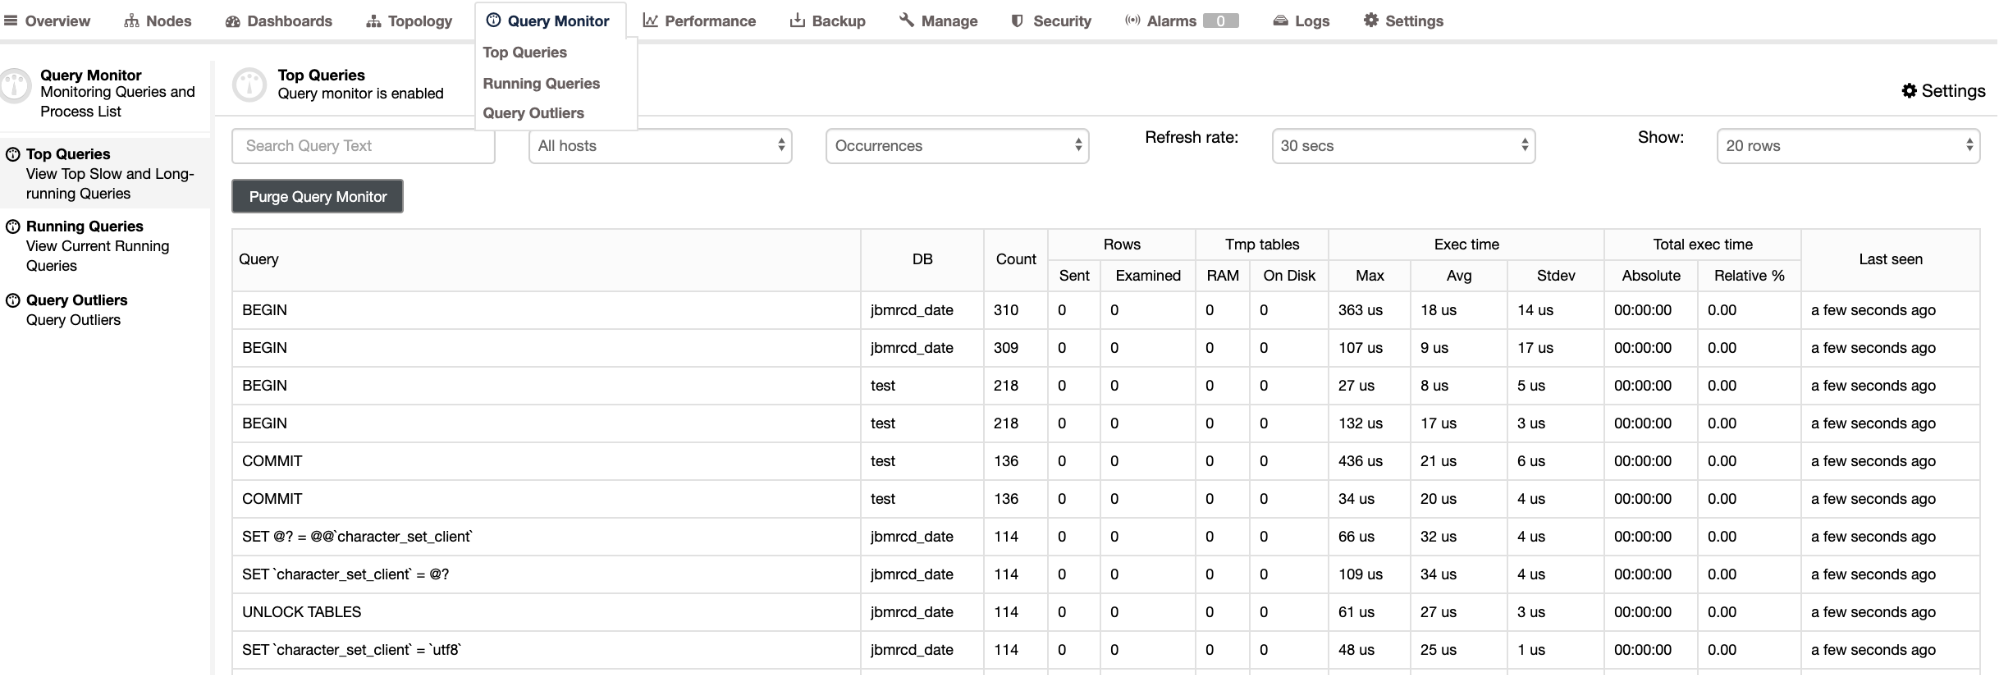
Using ClusterControl offers you a one-stop utility tool where you can also check queries running to determine those processes (queries) that can impact high memory utilization. See below for an example,

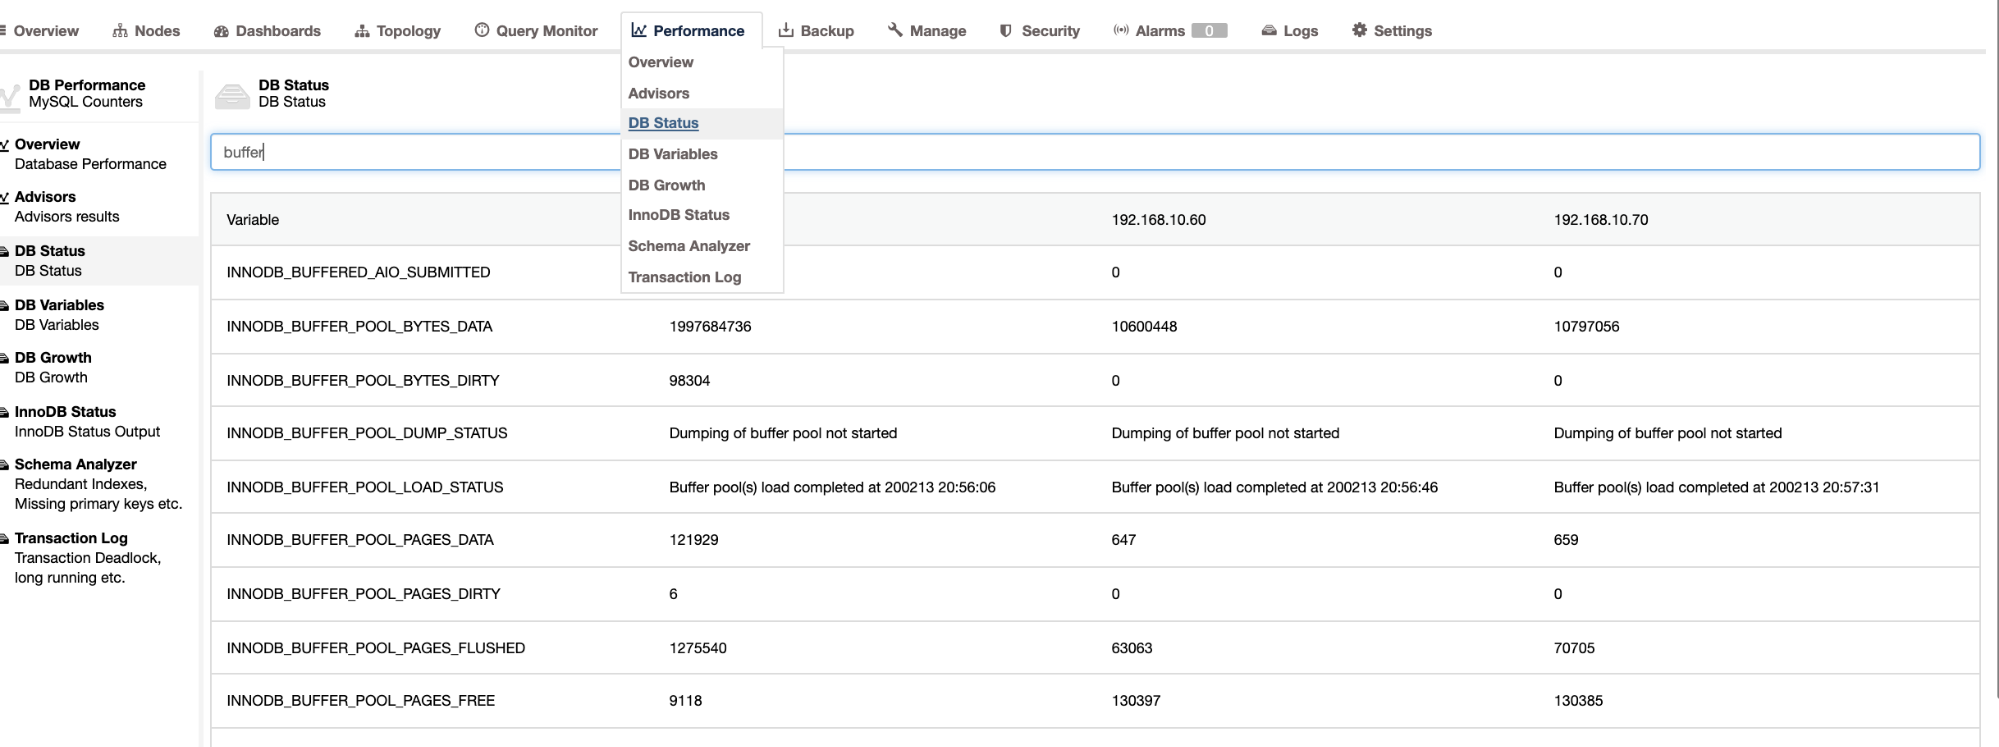
Viewing the status variables of MySQL is quiet easy,

You can even go to Performance -> Innodb Status as well to reveal the current InnoDB status of your database nodes. Also, in ClusterControl, an incident is detected, it will try to collect incident and shows history as a report that provides you InnoDB status as shown in our previous blog about MySQL Freeze Frame.
Summary
Troubleshooting and diagnosing your MySQL database when suspecting high memory utilization isn’t that difficult as long as you know the procedures and tools to use. Using the right tool offers you more flexibility and faster productivity to deliver fixes or solutions with a chance of greater result.


