blog
Tips for Monitoring MySQL for Moodle

Database monitoring is a critical part of any application’s maintenance. Finding database issues on time can help the application remain healthy and accessible. Without monitoring in place, database outages can be prolonged, resulting in increased downtime for users. In this blog we are going to explain what you need to monitor in a Moodle Database, and how you can do it using ClusterControl.
ClusterControl Monitoring
Using ClusterControl you can monitor the databases efficiently, it can do so by deploying agents on the database hosts or in an agentless fashion, by simply connecting to the databases via SSH . Data is presented in a GUI, in the form of a number of dashboards and charts.
How Does ClusterControl Monitoring Work ?
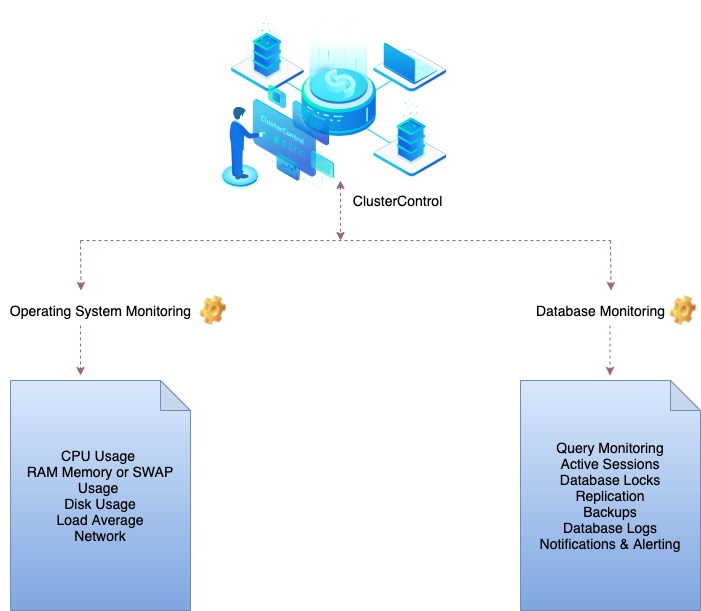
ClusterControl automatically collects database metrics as well as underlying server performance metrics. Since a high availability database stack would most probably consist of a load balancer (for Galera Cluster, one would have either HAProxy, ProxySQL or MaxScale), it is also included in the instances being monitored. It alerts on performance or availability problems for both database and server components. It also generates comprehensive reports to show database utilization and capacity issues.
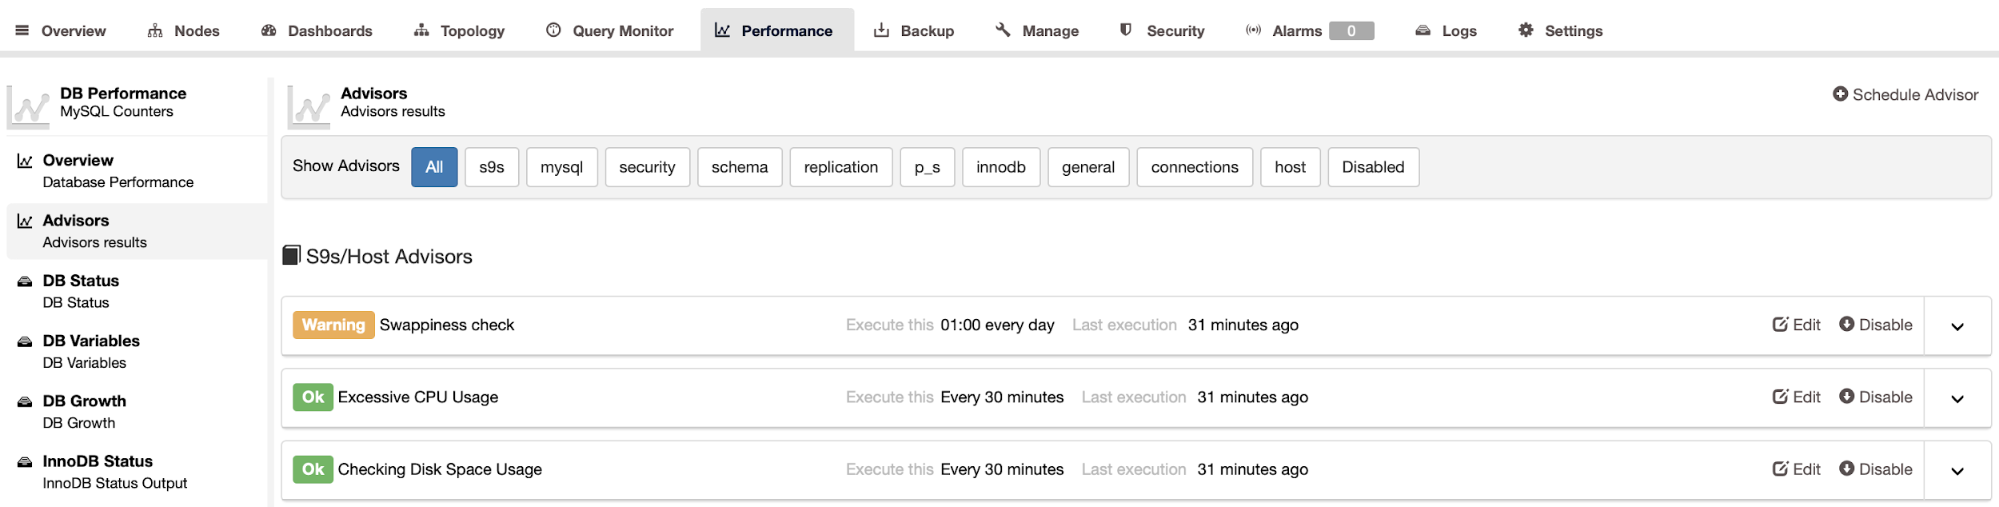
Real Time Monitoring
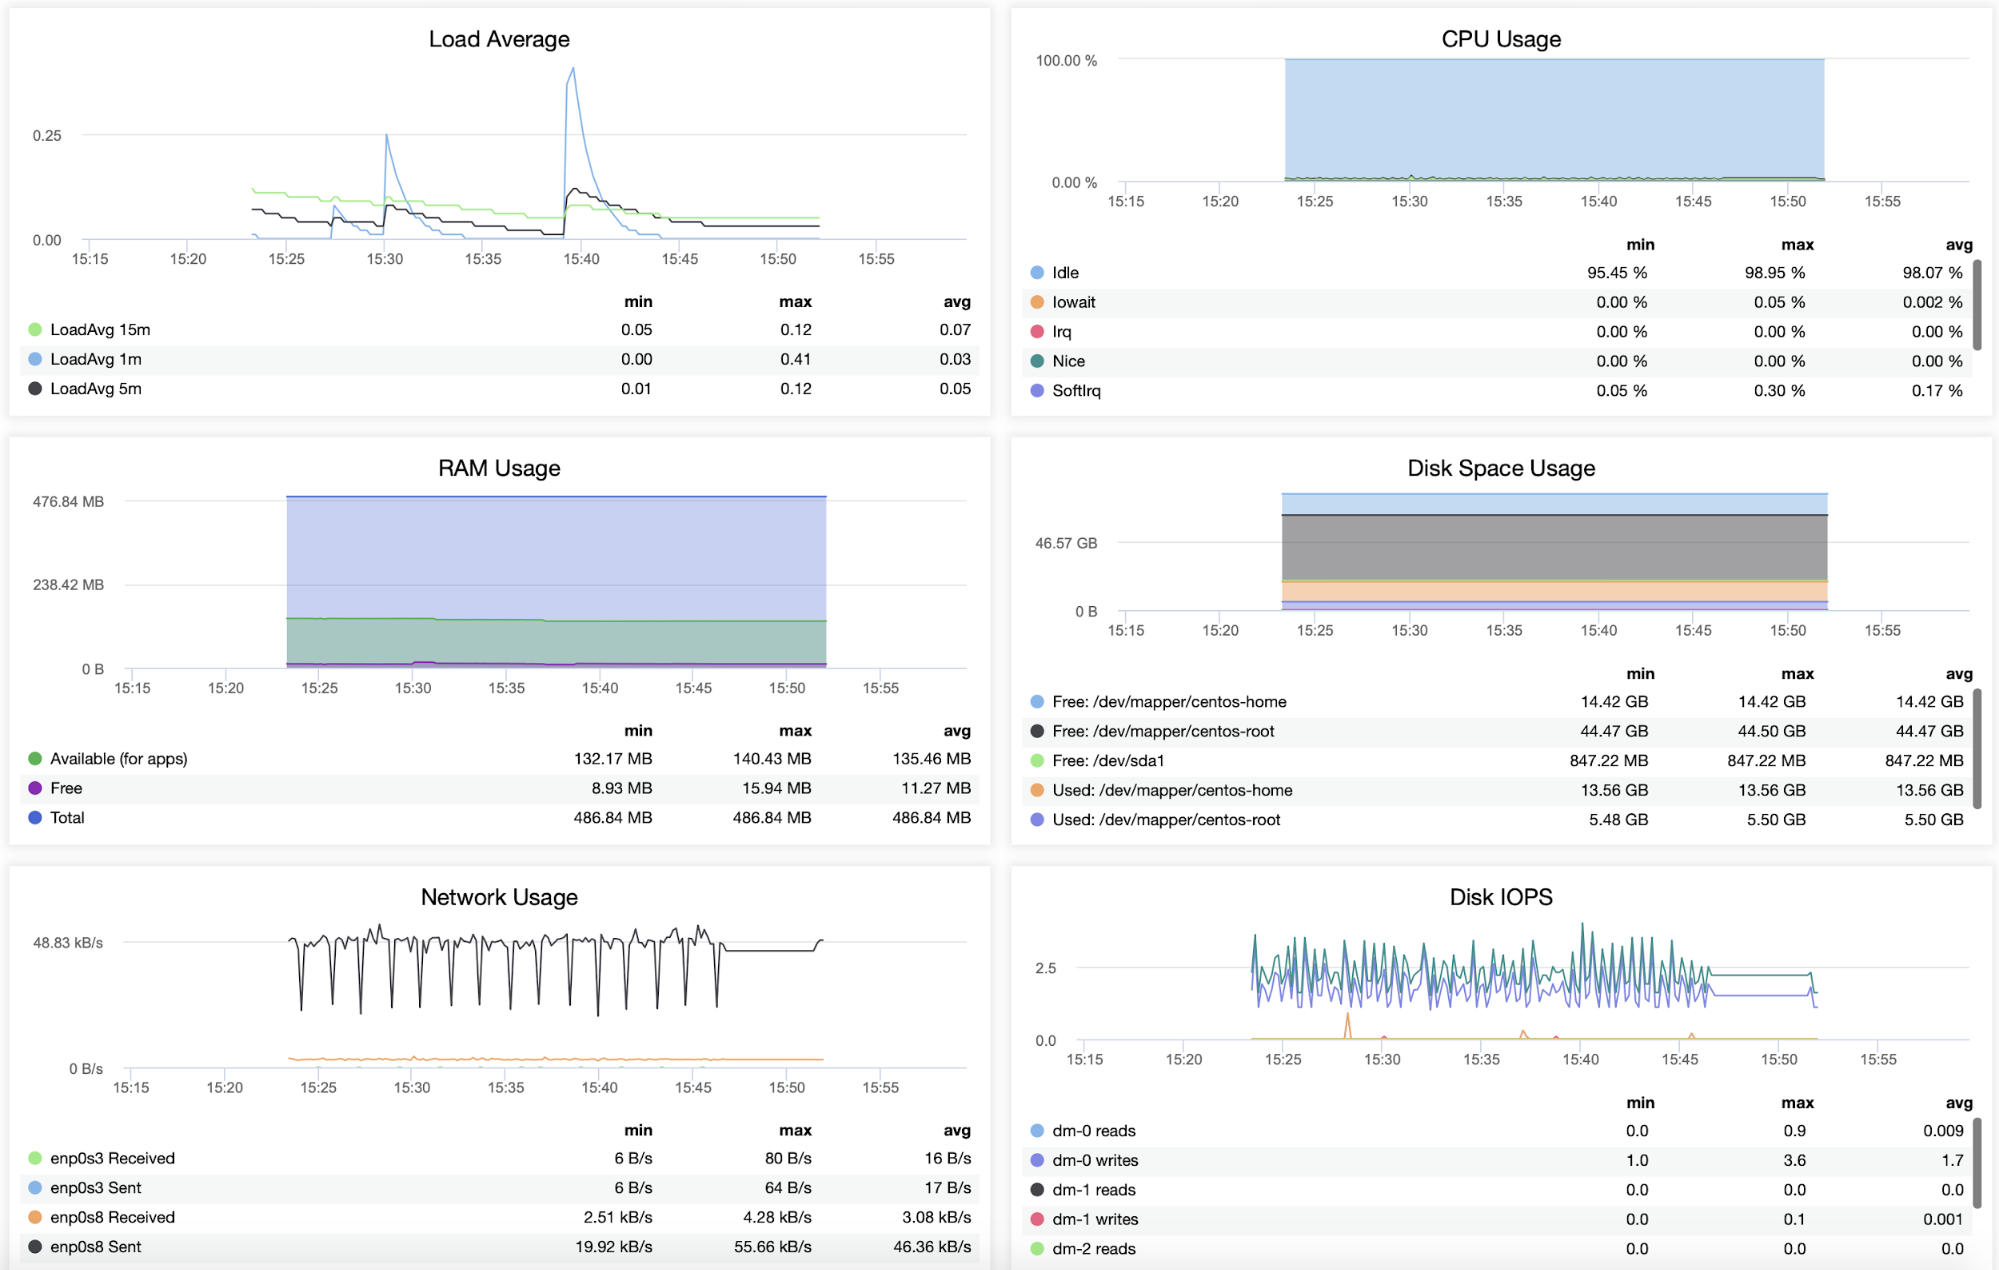
ClusterControl allows you to monitor your database servers in real-time. It has a predefined set of dashboards for you, to analyze some of the most common metrics mentioned above and even more.
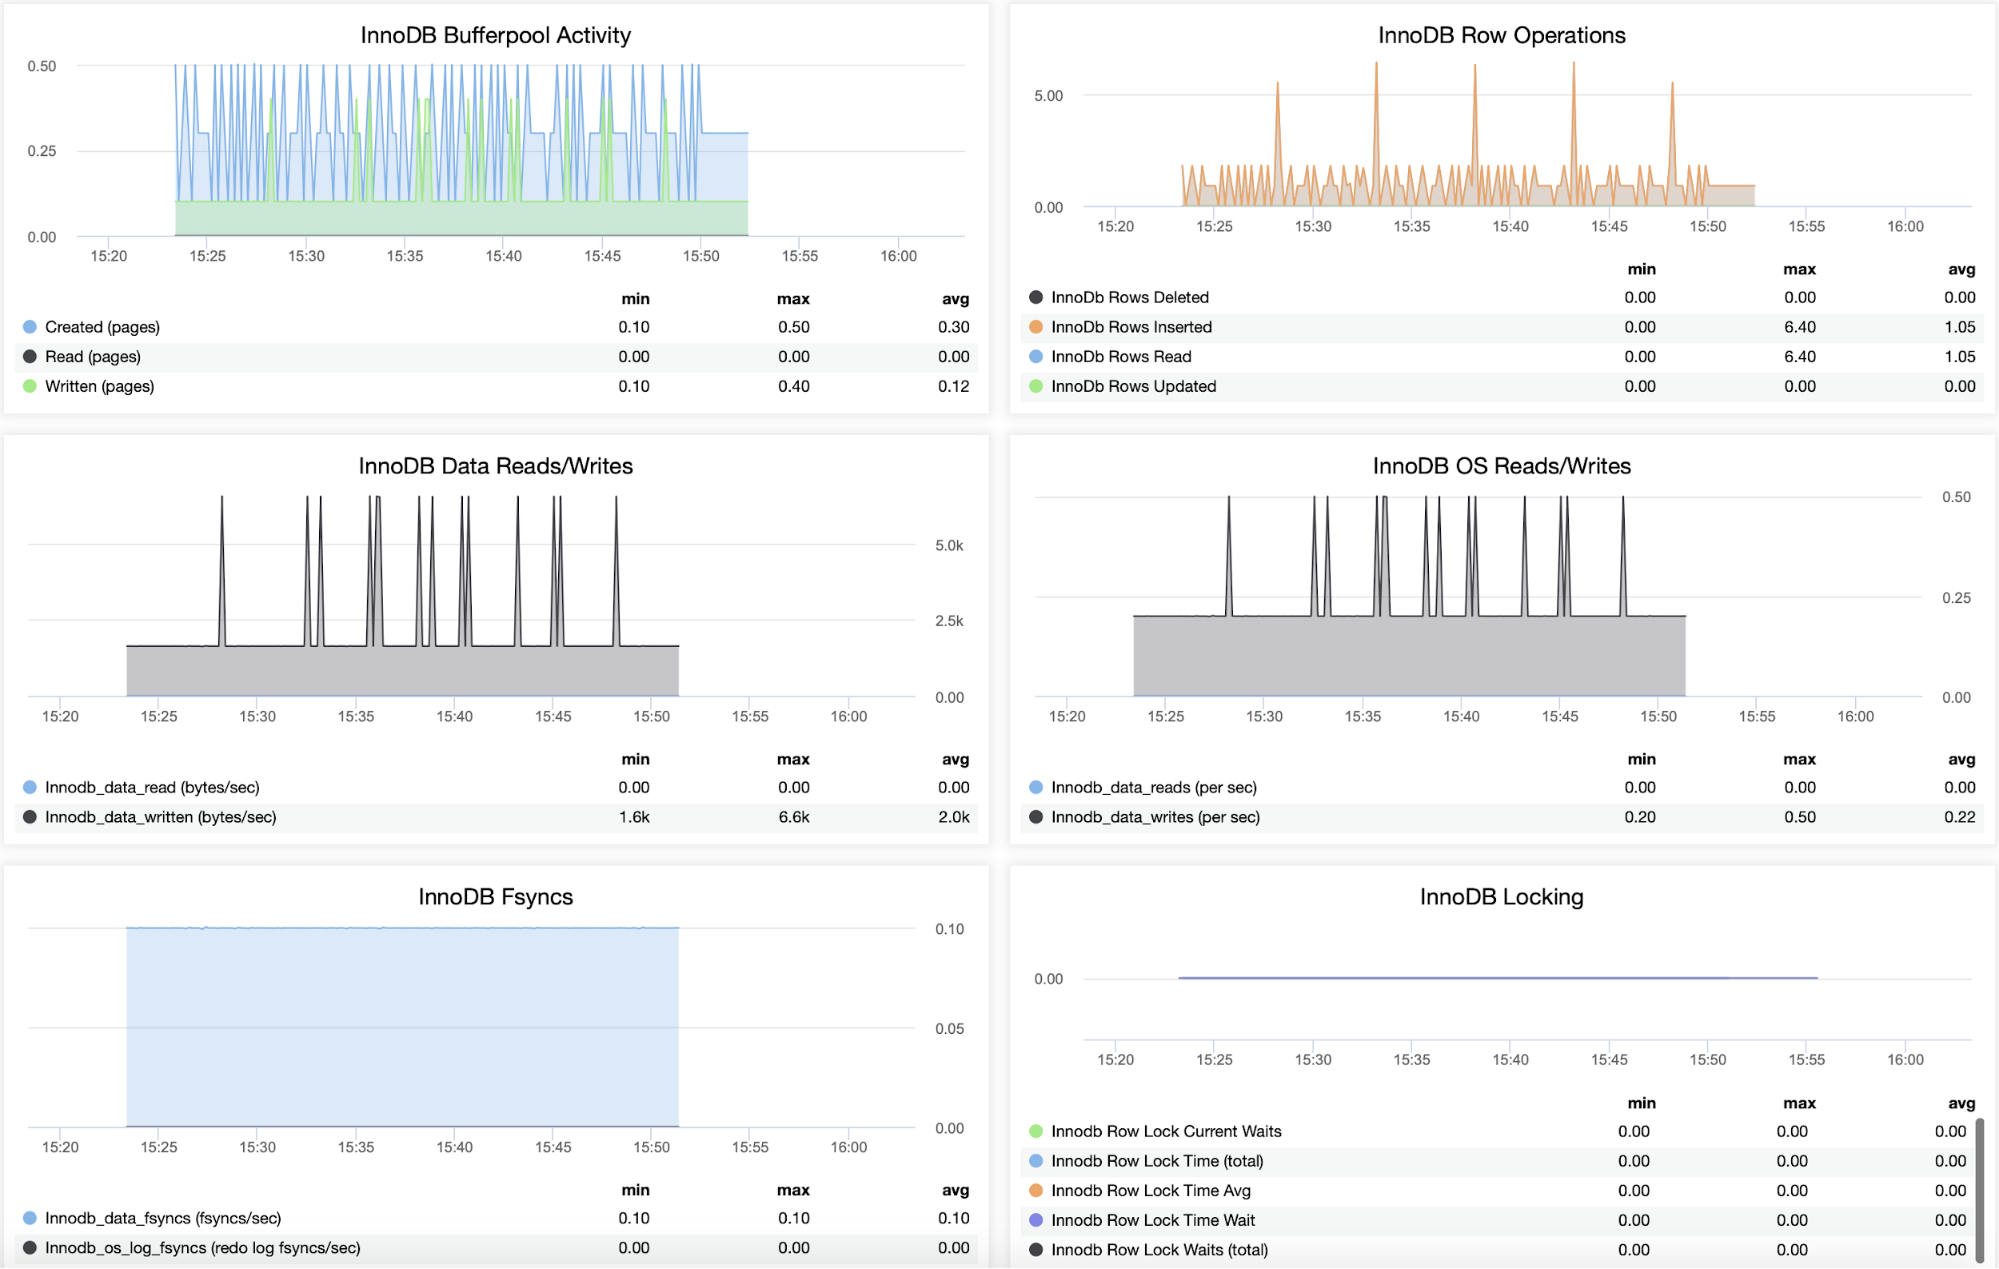
It also allows you to customize the graphs and you can enable agent-based monitoring to generate more detailed dashboards for both system level and DB level.
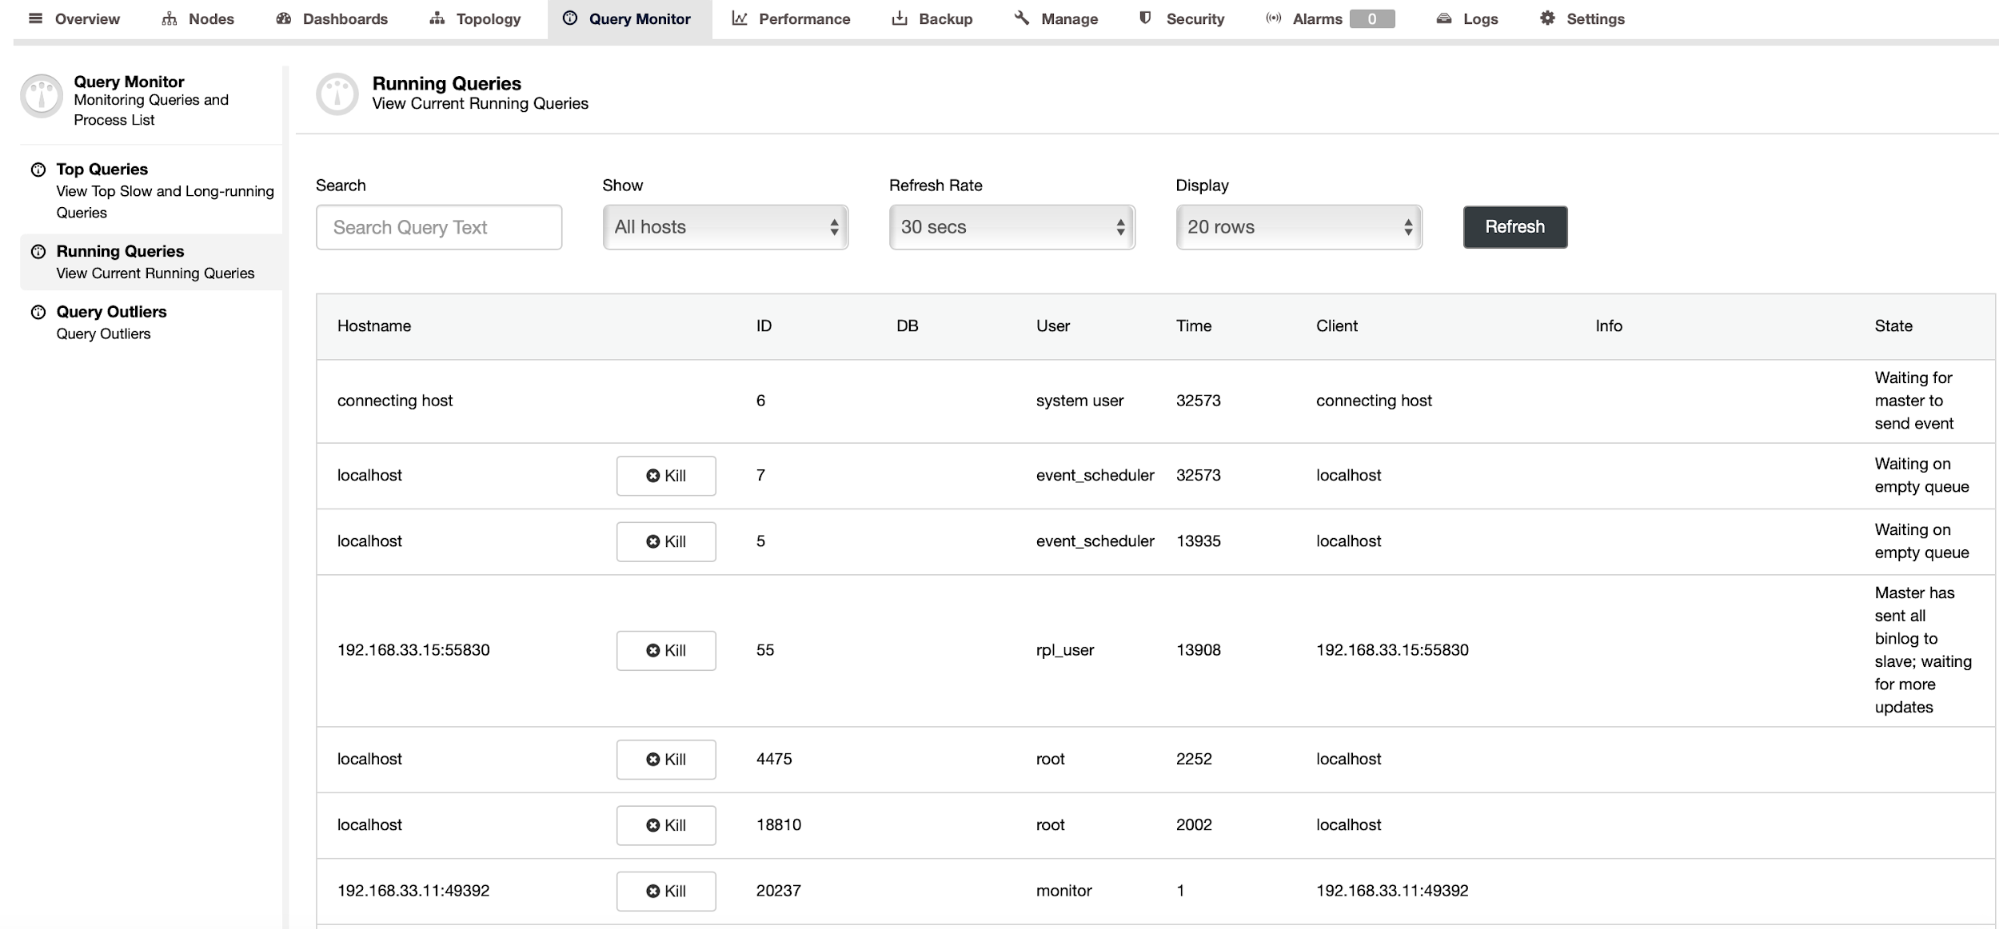
Query Monitoring
Also, you have the query monitor and the performance sections, where you can find all your database information. With these features, you can understand database activity. Slow queries and things like deadlocks can be devastating to the stability of a database, and can affect all users of the application. So it is important to keep track of them. Moodle itself has its own schema, but at the time of writing, there’s over 1700 third party Moodle plugins that come with their own database tables. So how do you keep track of how the queries in these plugins are performing, and identify poorly written queries that can drag down the performance of the entire Moodle database.
The query outliers show queries that take more time to execute than normally, longer being defined as a latency deviation of 2 sigmas + average_query_time. This can be an interesting feature as it would help identify queries that suddenly start to perform poorly, which might be because of a change in configuration, an upgrade, or for instance adding a new plugin.
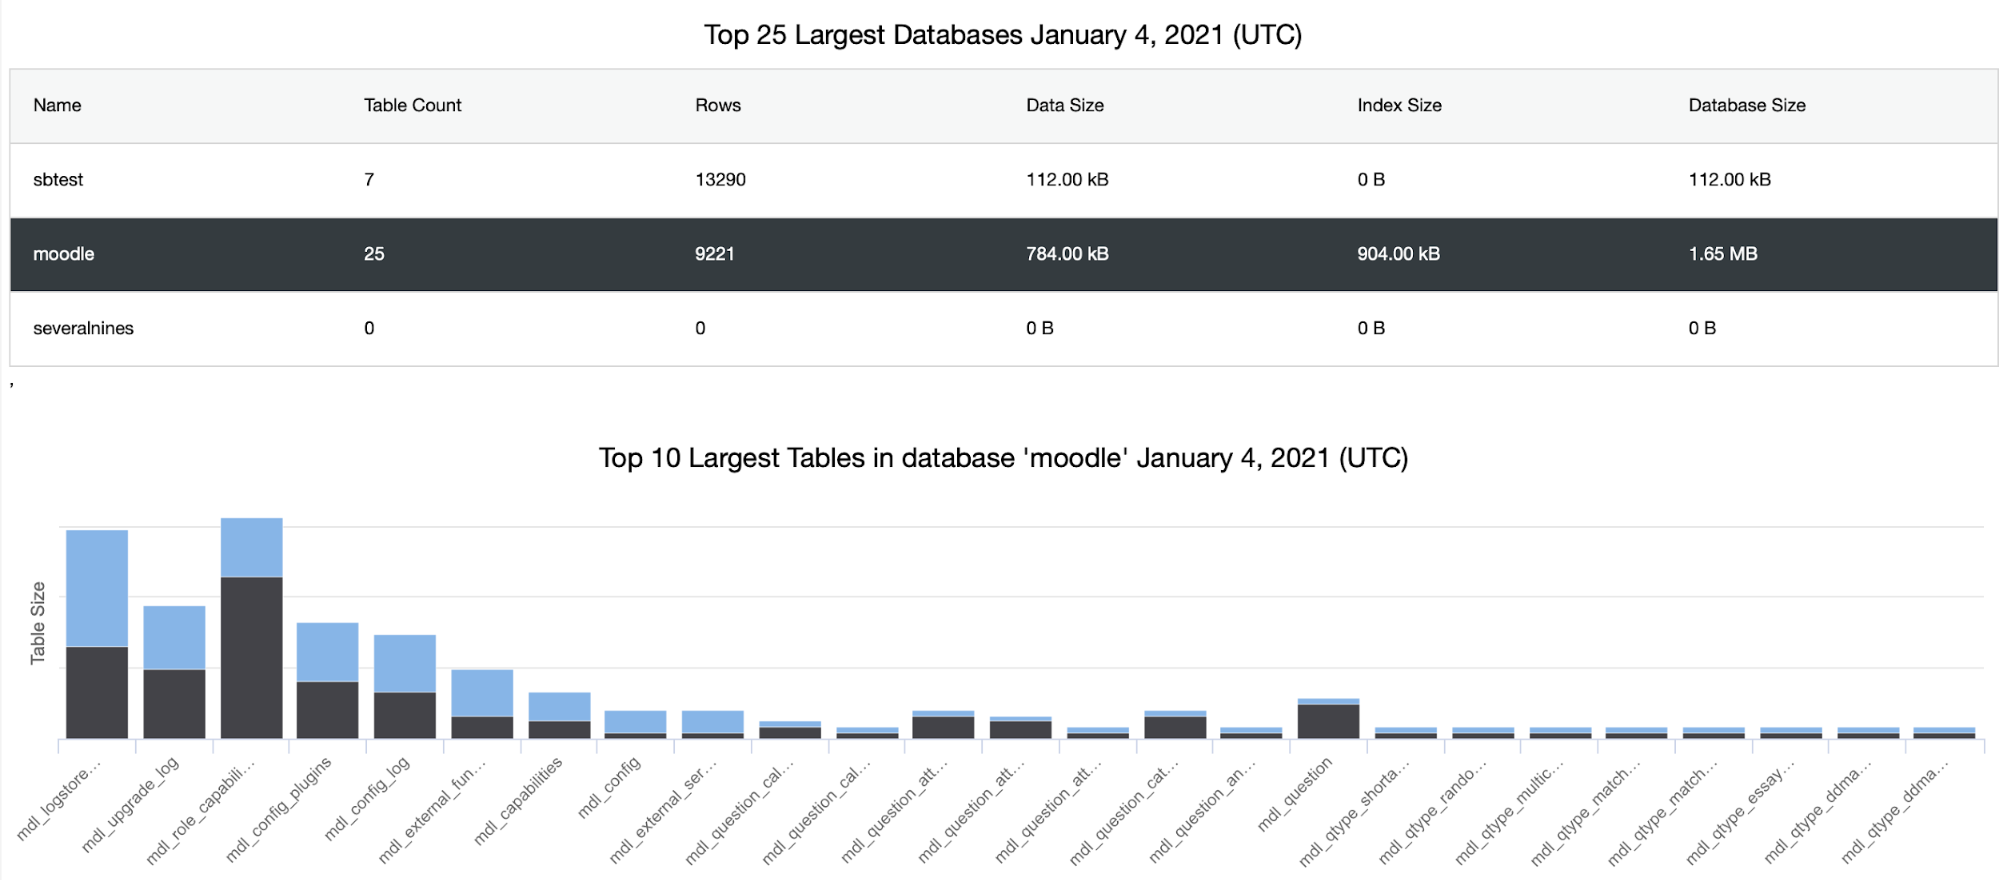
DB Growth
The ClusterControl frequently collects db, table, index stats. We can easily find the largest tables in your db. This can help understand when you might need to add more storage to the database, or for instance, if you need to do some cleanup on some tables.
Alerting
You can create alerts, which inform you of events in your cluster, or integrate it with different services such as PagerDuty, VictorOps or Slack.
Summary
In this blog, we mentioned some important metrics to monitor in your Moodle Database. Monitoring your moodle database is necessary but also a time-consuming task if you don’t have any tools to help with this.
We hope those couple of tips help to monitor your Moodle database backend much easier and to a greater extent.


