blog
Tips for Monitoring MariaDB Replication with ClusterControl

MariaDB replication is one of the most popular high availability solutions for MariaDB and widely used by top companies like Booking.com and Google. It is very easy to set up, with some trade-offs on the ongoing maintenance like software upgrades, schema changes, topology changes, failover and recovery which have always been tricky. Nevertheless, with the right toolset, you should be able to handle the topology with ease. In this blog post, we are going to look into some tips to monitor MariaDB replication efficiently using ClusterControl.
Using the Topology Viewer
A replication setup consists of a number of roles. A node in a replication setup could be a:
- Master – The primary writer/reader.
- Backup master – A read-only slave with semi-sync replication, solely for master redundancy.
- Intermediate master – Replicate from a master, while other slaves replicate from this node.
- Binlog server – Only collect/store binlogs without serving data.
- Slave – Replicate from a master, and commonly set as read-only.
- Multi-source slave – Replicate from multiple masters.
Every role has its own responsibility and limitation and one must understand the correct topology when dealing with the database nodes. This is also true for the application as well, where the application has to write only to the master node at any given time. Thus, it’s important to have an overview on which node is holding which role, so we don’t screw up our database.
In ClusterControl, the Topology Viewer can give you an overview of the replication topology and its state, as shown in the following screenshot:
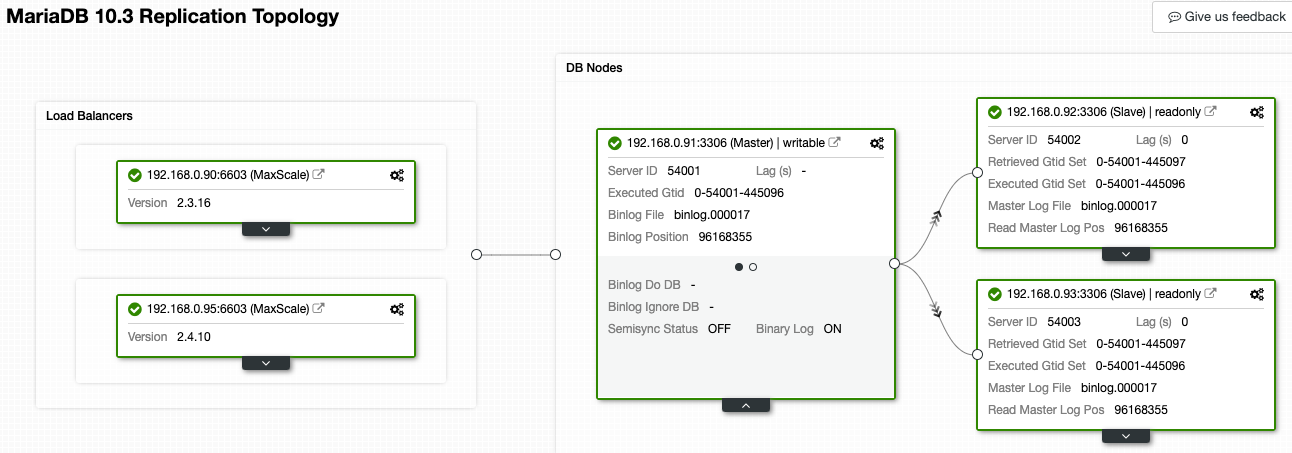
ClusterControl understands MariaDB replication and is able to visualize the topology with the correct replication data flow, as represented by the arrows pointed to the slave nodes. We can easily distinguish which node is the master, slaves and load balancers (MaxScale) in our replication setup. The green box indicates all the important services are running as expected with the assigned role.
Consider the following screenshot where a number of our nodes are having problems:
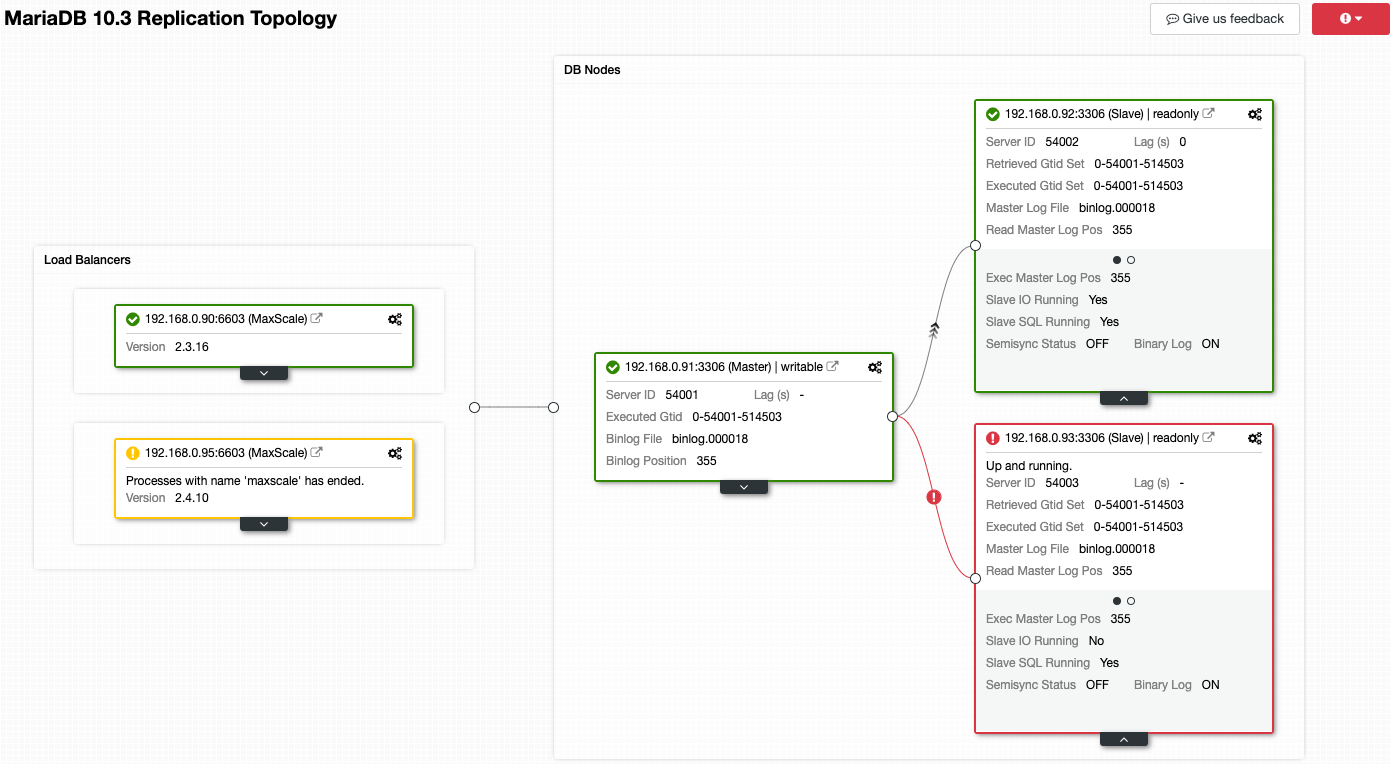
ClusterControl will immediately tell you what is wrong with the current topology. One of the slaves (red box) is showing “Slave IO Running” as No, to indicate some connectivity issue to replicate from the master. While the yellow box shows our MaxScale service is not running. We can also tell the MaxScale versions are not identical for both nodes. You can also perform management tasks by clicking on the gear icon (top right on every box) directly which reduces the risks of picking up a wrong node.
Replication Lag
This is the most important thing if you rely on data replication consistency. Replication lag occurs when the slaves cannot keep up with the updates happening on the master. Unapplied changes accumulate in the slaves’ relay logs and the version of the database on the slaves becomes increasingly different from the master.
In ClusterControl, you can find the replication lag histogram under Overview -> Replication Lag where ClusterControl constantly samples the Seconds_Behind_Master value from “SHOW SLAVE STATUS” output:
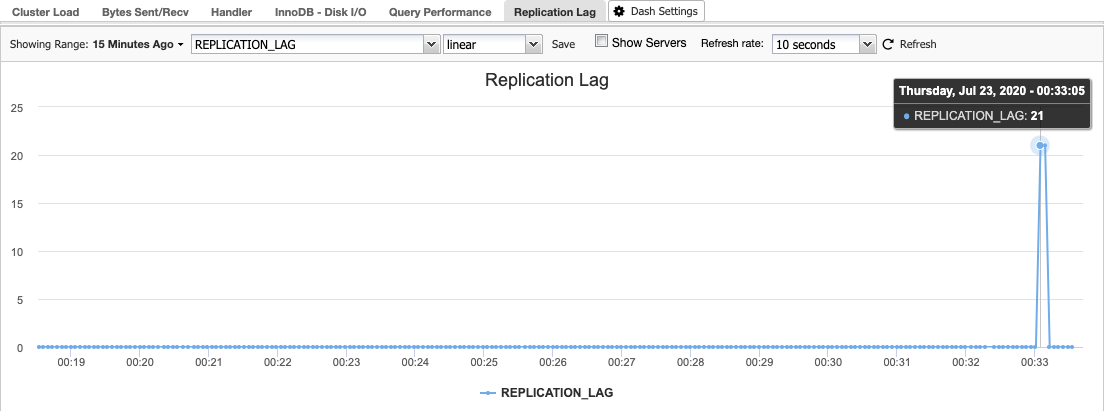
Replication lag happens when either the I/O Thread or SQL Thread cannot cope with the demands placed upon it. If the I/O Thread is suffering, this means that the network connection between the master and its slaves is slow or having problems. You might want to consider enabling the slave_compressed_protocol to compress network traffic or report to your network administrator.
If it’s the SQL thread then the problem is probably due to poorly-optimized queries that are taking the slave too long to apply. There may be long-running transactions or too much I/O activity. Having no primary key on the slave tables when using the ROW or MIXED replication format is also a common cause of lag on this thread. Check that the master and slave versions of tables have a primary key.
Some more tips and tricks are covered in this blog post, How to Reduce Replication Lag in Multi-Cloud Deployments.
Binary/Relay Log Size
It’s important to monitor the binary and relay logs disk size because it could consume a considerable amount of storage on every node in a replication cluster. Commonly, one would set the expire_logs_days system variable to expire binary log files automatically after a given number of days, for example, expire_logs_days=7. The size of binary logs is totally dependent on the number of binary events created (incoming writes) and little that we know how much disk space it would consume before the logs are going to be expired by MariaDB. Keep in mind if you enable log_slave_updates on the slaves, the size of logs will be almost doubled because of the existence of both binary and relay logs on the same server.
For ClusterControl, we can set a disk space utilization threshold under ClusterControl -> Settings -> Thresholds to get a warning and critical notifications as below:
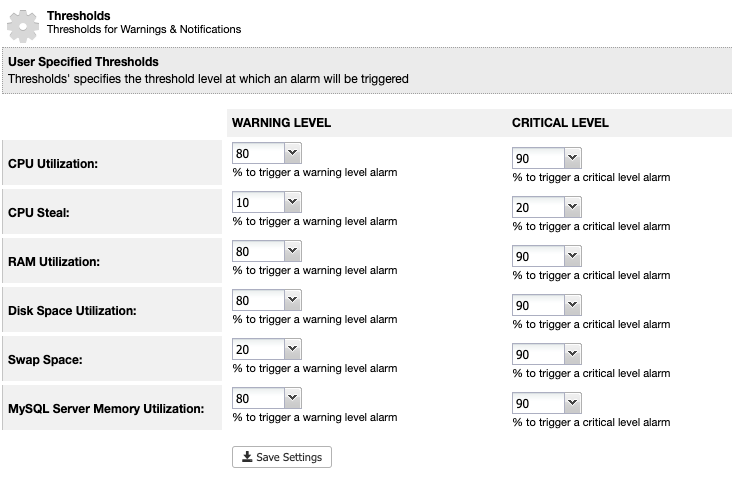
ClusterControl monitors all disk space related to MariaDB services like the location of MariaDB data directory, the binary logs directory and also the root partition. If you have reached the threshold, consider purging the binary logs manually by using the PURGE BINARY LOGS command, as explained and discussed in this article.
Enable Monitoring Dashboards
ClusterControl provides two monitoring options to sample the database nodes – agentless or agent-based. The default is agentless where sampling happens via SSH in a pull-only mechanism. Agent-based monitoring requires a Prometheus server to be running, and all monitored nodes to be configured with at least three exporters:
- Process exporter (port 9011)
- Node/system metrics exporter (port 9100)
- MySQL/MariaDB exporter (port 9104)
To enable the agent-based monitoring dashboard, one has to go to ClusterControl -> Dashboards -> Enable Agent Based Monitoring. Once enabled, you will see a set of dashboards configured for our MariaDB replication which gives us a much better insight on our replication setup. The following screenshot shows what you would see for the master node:
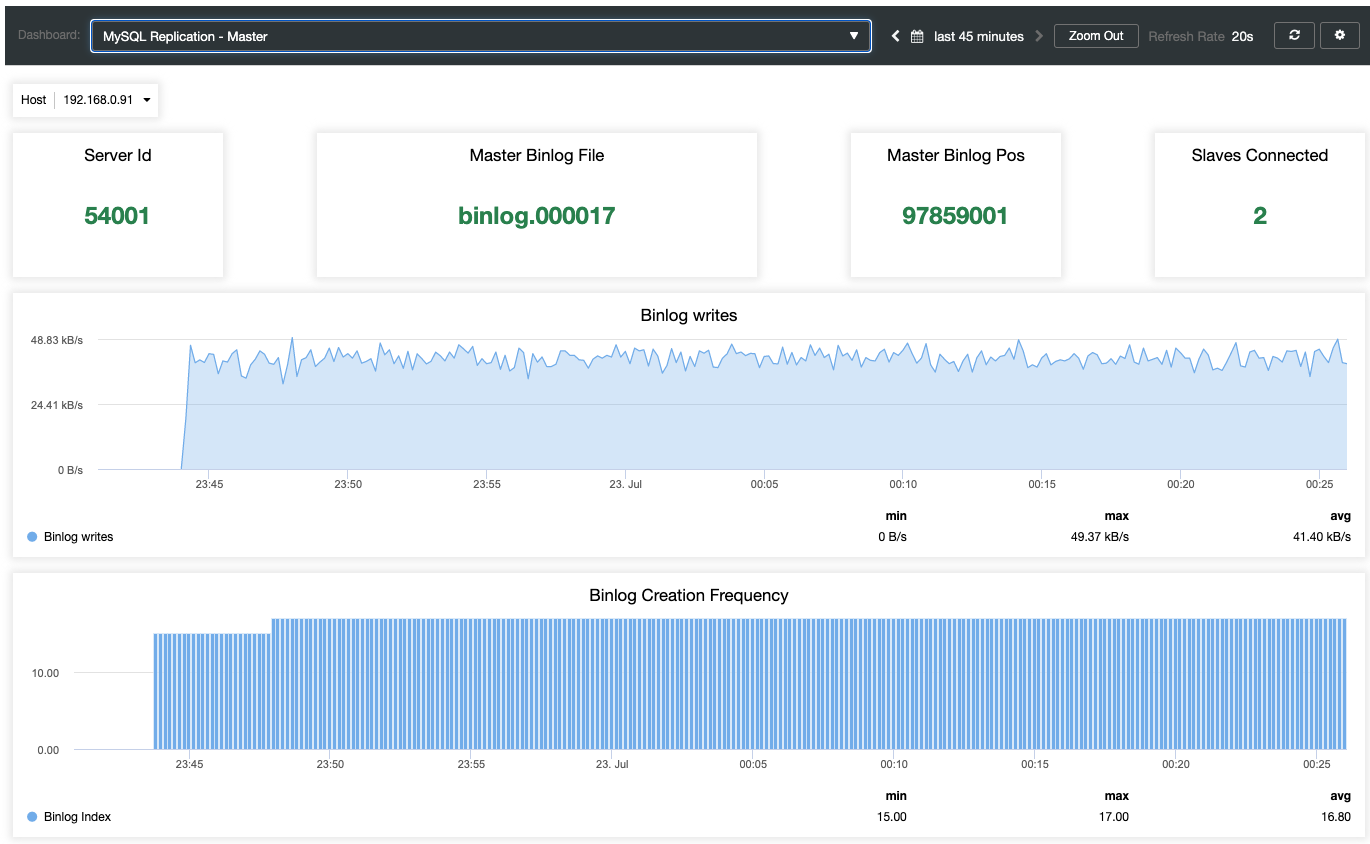
Apart from MariaDB standard monitoring dashboards like general, caches and InnoDB metrics, you will be presented with a replication dashboard. For the master node, we can get a lot of useful information regarding the state of the master, the write throughput and binlog creation frequency.
While for the slaves, all the important states are sampled and summarized as the following screenshot. if everything is green, you are in good hands:
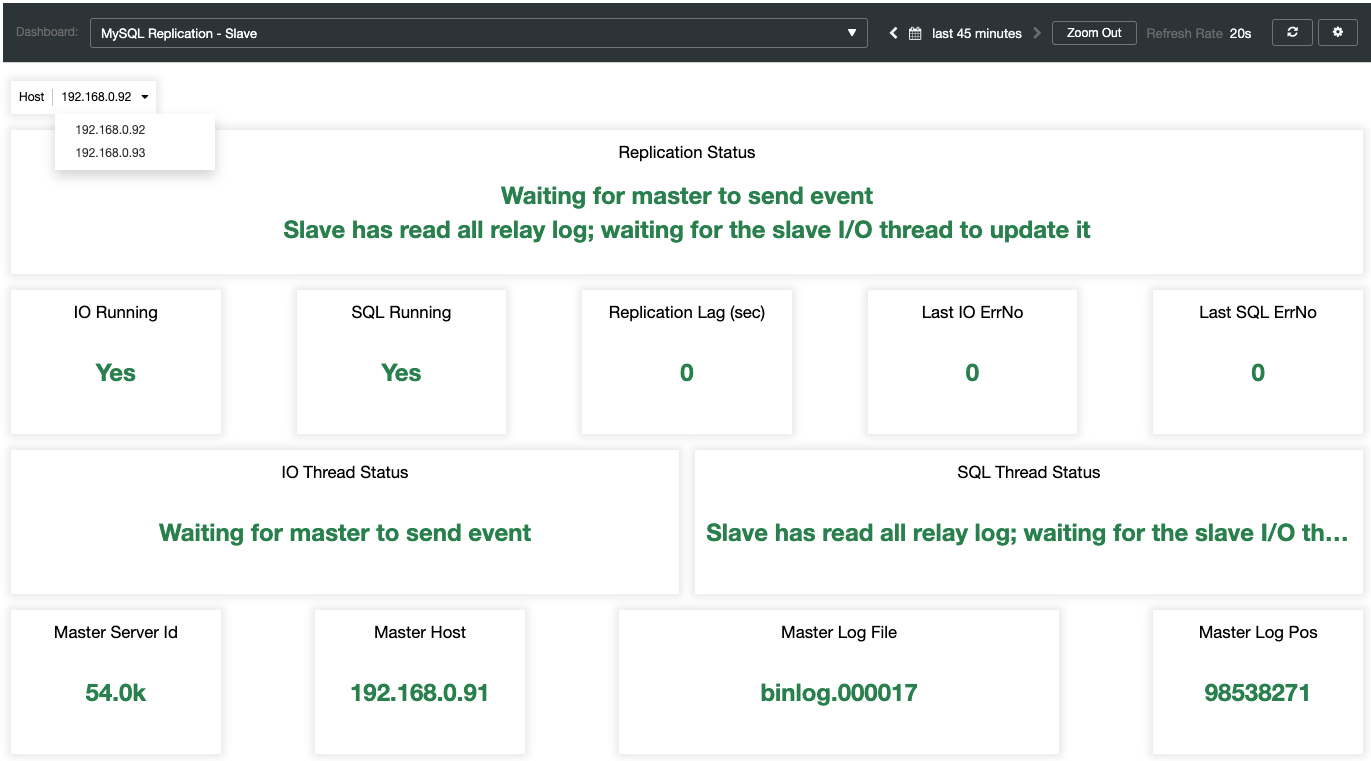
Understanding the MariaDB Error Log
MariaDB logs its important events inside the error log, which is useful to understand what was going on with the server, especially before, during and after a topology change. ClusterControl provides a centralized view of error logs under ClusterControl -> Logs -> System Logs by pulling them from every database node. You click on “Refresh Logs” to trigger a job to pull the latest logs from the server.
Collected files are represented in a navigation tree structure and a text area with syntax highlighting for better readability:
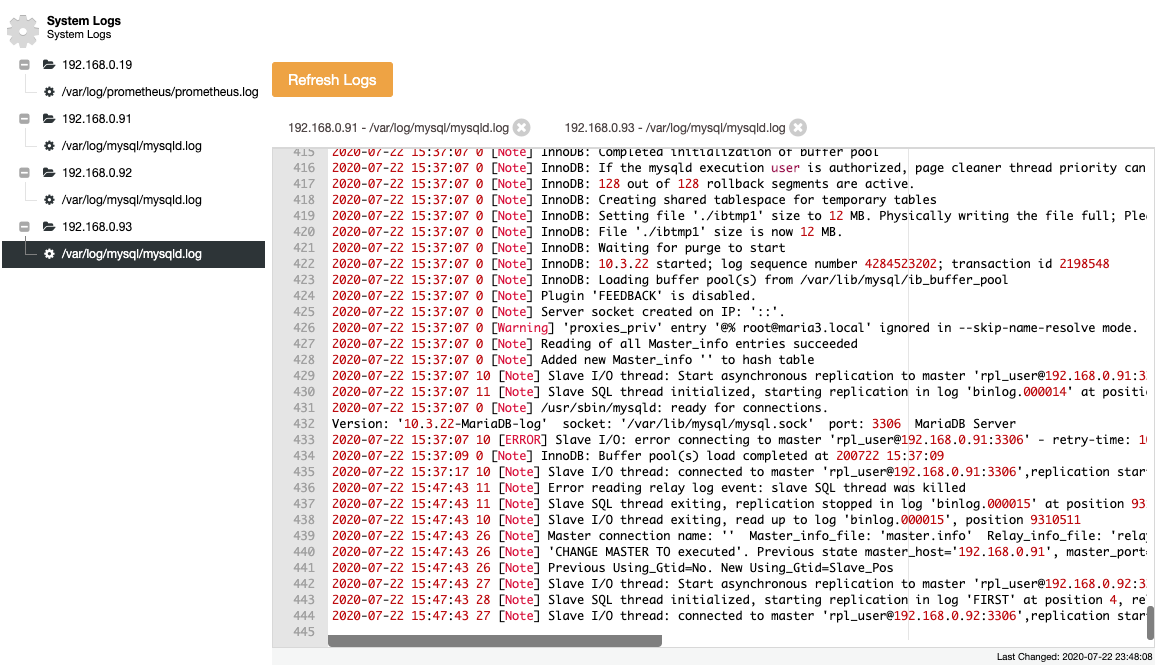
From the above screenshot, we can understand the sequence of events and what happened to this node during a topology change event. From the last 12 lines of the error log above, the slave had an error once connecting to the master and the last binary log file and position were recorded in the log before it stopped. Then a newer CHANGE MASTER command was executed with GTID information, as shown in the line “Previous Using_Gtid=No. New Using_Gtid=Slave_Pos” and then the replication resumes as what we wanted.
MariaDB Alert and Notifications
Monitoring is incomplete without alerts and notifications. All events and alarms generated by ClusterControl can be sent to the email or any other supported third-party tools. For email notifications, one can configure whether the type of events will be delivered immediately, ignored or digested (a daily summarized report):
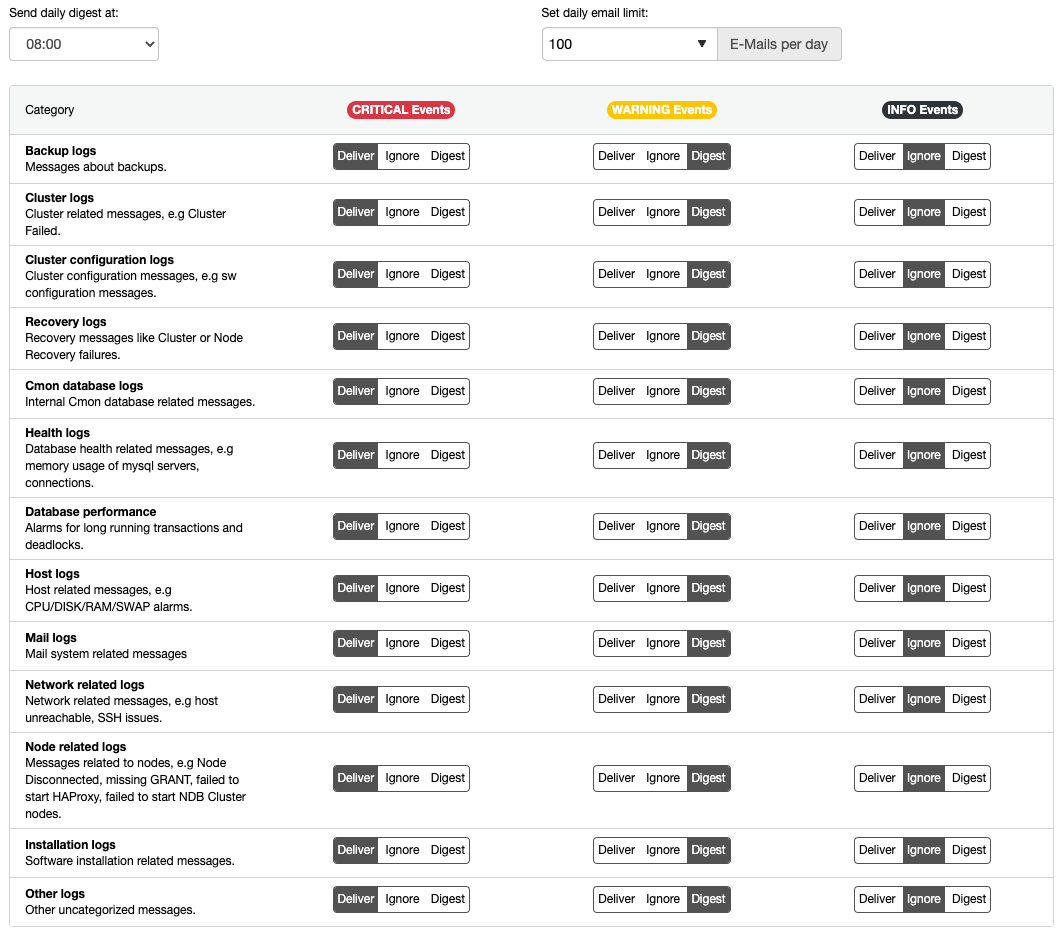
For all critical severity events, it’s recommended to set everything to “Deliver” so you will get the notifications as soon as possible. Set “Digest” to warning events so you are well aware of the cluster health and state.
You can integrate your preferred communication and messaging tools with ClusterControl by using the Notifications Management feature under ClusterControl -> Integrations -> 3rd Party Notifications. ClusterControl can send alarms and events to PagerDuty, VictorOps, OpsGenie, Slack, Telegram, ServiceNow or any user registered webhooks.
The following screenshot shows all critical events will be pushed to the configured telegram channel for our MariaDB 10.3 Replication cluster:

ClusterControl also supports chatbot integration, where you can interact with the controller service via s9s client right from your messaging tool as shown in this blog post, Automate Your Database with CCBot: ClusterControl Hubot Integration.
Conclusion
ClusterControl offers a complete set of proactive monitoring tools for your database clusters. Do use ClusterControl to monitor your MariaDB replication setup because most of the monitoring features are available for free in the community edition. Don’t miss those out!


