blog
Ten Tips for Going Into Production With PostgreSQL

Going into production is a very important task that must be carefully thought and planned beforehand. Some not so good decisions may be easily corrected afterwards, but some others not. So it is always better to spend that extra time in reading the official docs, books and research made by others early, than be sorry later. This is true for most computer systems deployments, and PostgreSQL is no exception.
System Initial Planning
Some decisions must be taken early on, before the system goes live. The PostgreSQL DBA must answer a number of questions: Will the DB run on bare metal, VMs or even containerized? Will it run on the organization’s premises or in the cloud? Which OS will be used? Is the storage going to be of spinning disks type or SSDs? For each scenario or decision, there are pros and cons and the final call will be made in cooperation with the stakeholders according to the organization’s requirements. Traditionally people used to run PostgreSQL on bare metal, but this has changed dramatically in the recent years with more and more cloud providers offering PostgreSQL as a standard option, which is a sign of the wide adoption and a result of increasing popularity of PostgreSQL. Independently of the specific solution, the DBA must ensure that the data will be safe, meaning that the database will be able to survive crashes, and this is the No1 criterion when making decisions about hardware and storage. So this brings us to the first tip!
Tip 1
No matter what the disk controller or disk manufacturer or cloud storage provider advertises, you should always make sure that the storage does not lie about fsync. Once fsync returns OK, the data should be safe on the medium no matter what happens afterwards (crash, power failure, etc). One nice tool that will help you test the reliability of your disks’ write-back cache is diskchecker.pl.
Just read the notes: https://brad.livejournal.com/2116715.html and do the test.
Use one machine to listen to events and the actual machine to test. You should see:
 verifying: 0.00%
 verifying: 10.65%
…..
 verifying: 100.00%
Total errors: 0
at the end of the report on the tested machine.
The second concern after reliability should be about performance. Decisions about system (CPU, memory), used to be much more vital since it was quite hard to change them later. But in today’s, in the cloud era, we can be more flexible about the systems that the DB runs on. The same is true for storage, especially in the early life of a system and while the sizes are still small. When the DB gets past the TB figure in size, then it gets harder and harder to change basic storage parameters without the need to entirely copy the database – or even worse, to perform a pg_dump, pg_restore. The second tip is about system performance.
Tip 2
Similarly to always testing the manufacturers’ promises regarding reliability, the same you should do about hardware performance. Bonnie++ is the most popular storage performance benchmark for Unix-like systems. For overall system testing (CPU, Memory and also storage) nothing is more representative than the DB’s performance. So the basic performance test on your new system would be running pgbench, the official PostgreSQL benchmark suite based on TCP-B.
Getting started with pgbench is fairly easy, all you have to do is:
postgres@debianpgsql1:~$ createdb pgbench
postgres@debianpgsql1:~$ pgbench -i pgbench
NOTICE:  table "pgbench_history" does not exist, skipping
NOTICE:  table "pgbench_tellers" does not exist, skipping
NOTICE:  table "pgbench_accounts" does not exist, skipping
NOTICE:  table "pgbench_branches" does not exist, skipping
creating tables...
100000 of 100000 tuples (100%) done (elapsed 0.12 s, remaining 0.00 s)
vacuum...
set primary keys...
done.
postgres@debianpgsql1:~$ pgbench pgbench
starting vacuum...end.
transaction type:
scaling factor: 1
query mode: simple
number of clients: 1
number of threads: 1
number of transactions per client: 10
number of transactions actually processed: 10/10
latency average = 2.038 ms
tps = 490.748098 (including connections establishing)
tps = 642.100047 (excluding connections establishing)
postgres@debianpgsql1:~$
You should always consult pgbench after any important change that you wish to assess and compare the results.
System Deployment, Automation and Monitoring
Once you go live it is very important to have your main system components documented and reproducible, to have automated procedures for creating services and recurring tasks and also have the tools to perform continuous monitoring.
Tip 3
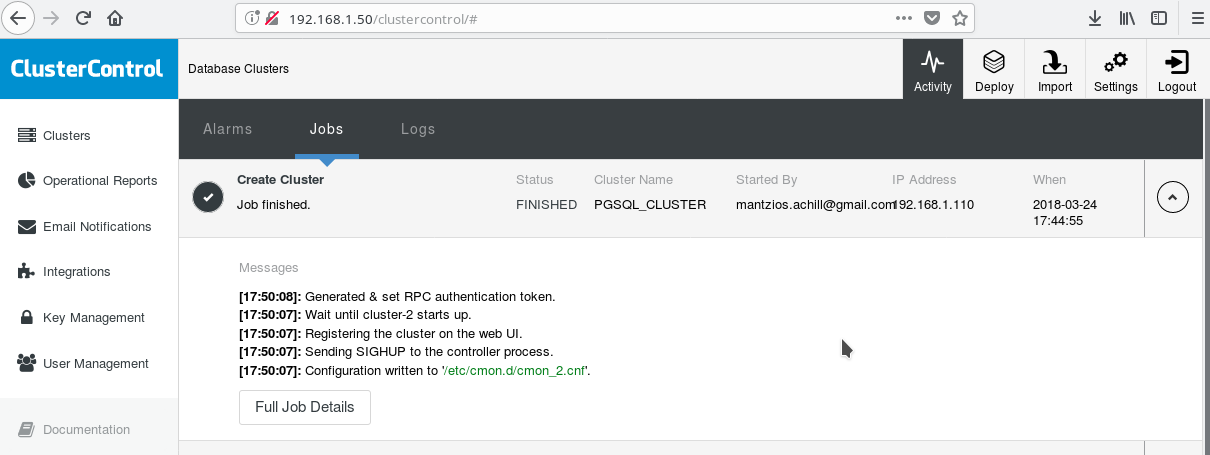
One handy way to start using PostgreSQL with all its advanced enterprise features is ClusterControl by Severalnines. One can have an enterprise-class PostgreSQL cluster, just by hitting a few clicks. ClusterControl provides all those aforementioned services and many more. Setting up ClusterControl is fairly easy, just follow the instructions on the official documentation. Once you have prepared your systems (typically one for running CC and one for PostgreSQL for a basic setup) and done the SSH setup, then you must enter the basic parameters (IPs, Port nos, etc), and if all goes well you should see an output like the following:
And in the main clusters screen:
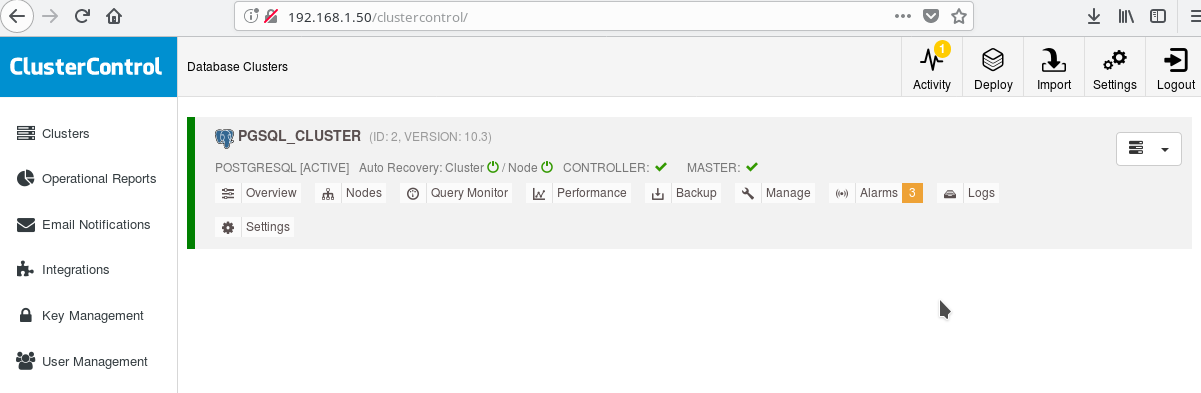
You can login to your master server and start creating your schema! Of course you can use as a basis the cluster you just created to further build up your infrastructure (topology). A generally good idea is to have a stable server file system layout and a final configuration on your PostgreSQL server and user/app databases before you start creating clones and standbys (slaves) based on your just created brand new server.
PostgreSQL Layout, Parameters and Settings
At cluster initialization phase the most important decision is whether to use data checksums on data pages or not. If you want maximum data safety for your valued (future) data, then this is the time to do it. If there is a chance that you may want this feature in the future and you neglect to do it at this stage, you won’t be able to change it later (without pg_dump/pg_restore that is). This is the next tip:
Tip 4
In order to enable data checksums run initdb as follows:
$ /usr/lib/postgresql/10/bin/initdb --data-checksums Note that this should be done at the time of tip 3 we described above. If you already created the cluster with ClusterControl you’ll have to rerun pg_createcluster by hand, as at the time of this writing there is no way to tell the system or CC to include this option.
Another very important step before you go into production is planning for the server file system layout. Most modern linux distros (at least the debian-based ones) mount everything on / but with PostgreSQL normally you don’t want that. It is beneficial to have your tablespace(s) on separate volume(s), to have one volume dedicated for the WAL files and another one for pg log. But the most important is to move the WAL to its own disk. This brings us to the next tip.
Tip 5
With PostgreSQL 10 on Debian Stretch, you can move your WAL to a new disk with the following commands (supposing the new disk is named /dev/sdb ):
# mkfs.ext4 /dev/sdb
# mount /dev/sdb /pgsql_wal
# mkdir /pgsql_wal/pgsql
# chown postgres:postgres /pgsql_wal/pgsql
# systemctl stop postgresql
# su postgres
$ cd /var/lib/postgresql/10/main/
$ mv pg_wal /pgsql_wal/pgsql/.
$ ln -s /pgsql_wal/pgsql/pg_wal
$ exit
# systemctl start postgresql
It is extremely important to setup correctly the locale and encoding of your databases. Overlook this at the createdb phase and you’ll regret this dearly, as your app/DB moves into the i18n, l10n territories. The next tip shows just how to do that.
Tip 6
You should read the official docs and decide on your COLLATE and CTYPE (createdb –locale=) settings (responsible for sort order and character classification) as well as the charset (createdb –encoding=) setting. Specifying UTF8 as the encoding will enable your database to store multi-language text.
PostgreSQL High Availability
Since PostgreSQL 9.0, when streaming replication became a standard feature, it became possible to have one or more readonly hot standbys, thus enabling the possibility to direct the read-only traffic to any of the available slaves. New plans exist for multimaster replication but at the point of this writing (10.3) it is only possible to have one read-write master, at least in the official open source product. For the next tip which deals with exactly this.
Tip 7
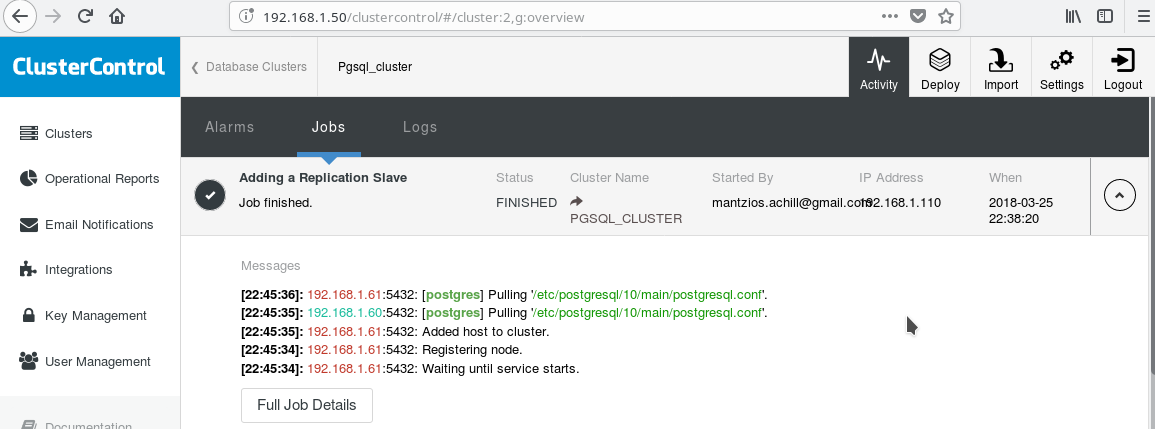
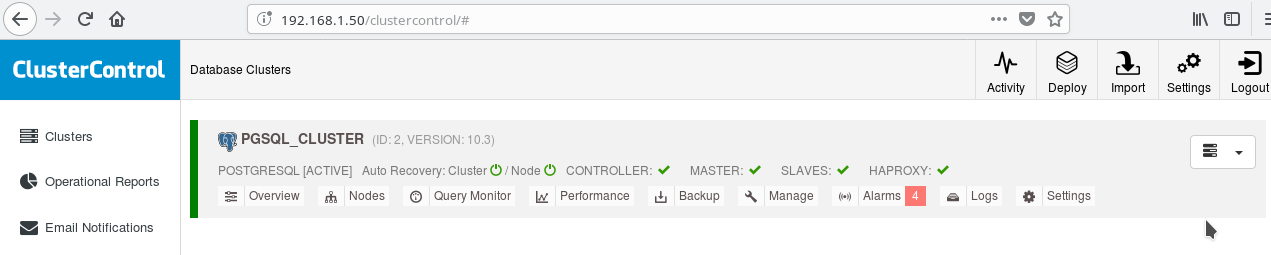
We will use our ClusterControl PGSQL_CLUSTER created in Tip 3. First we create a second machine which will act as our readonly slave (hot standby in PostgreSQL terminology). Then we click on Add Replication slave, and select our master and the new slave. After the job finishes you should see this output:
And the cluster now should look like:
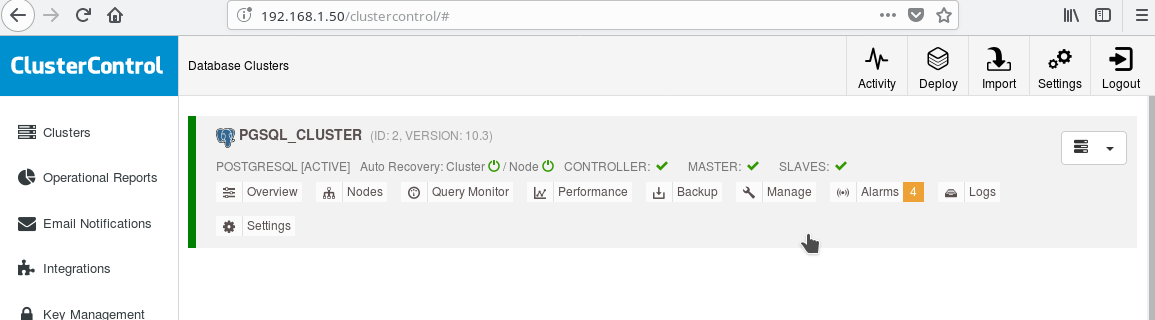
Note the green “ticked” icon on the “SLAVES” label next to “MASTER”. You can verify that the streaming replication works, by creating a database object (database, table, etc) or inserting some rows in a table on the master and see the change on the standby.
The presence of the read-only standby enables us to perform load balancing for the clients doing select-only queries between the two servers available, the master and the slave. This takes us to tip 8.
Tip 8
You can enable load balancing between the two servers using HAProxy. With ClusterControl this fairly easy to do. You click to Manage->Load Balancer. After choosing your HAProxy server, ClusterControl will install everything for you: xinetd on all instances you specified and HAProxy on your HAProxy designated server. After the job has completed successfully you should see:
Note the HAPROXY green tick next to the SLAVES. Now you can test that HAProxy works:
postgres@debianpgsql1:~$ psql -h localhost -p 5434
psql (10.3 (Debian 10.3-1.pgdg90+1))
SSL connection (protocol: TLSv1.2, cipher: ECDHE-RSA-AES256-GCM-SHA384, bits: 256, compression: off)
Type "help" for help.
postgres=# select inet_server_addr();
 inet_server_addr
------------------
 192.168.1.61
(1 row)
--
-- HERE STOP PGSQL SERVER AT  192.168.1.61
--
postgres=# select inet_server_addr();
FATAL:  terminating connection due to administrator command
SSL connection has been closed unexpectedly
The connection to the server was lost. Attempting reset: Succeeded.
postgres=# select inet_server_addr();
 inet_server_addr
------------------
 192.168.1.60
(1 row)
postgres=#
Tip 9
Besides configuring for HA and load balancing, it is always beneficial to have some sort of connection pool in front of the PostgreSQL server. Pgpool and Pgbouncer are two projects coming from the PostgreSQL community. Many enterprise application servers provide their own pools as well. Pgbouncer has been very popular due to its simplicity, speed and the “transaction pooling” feature, by which, connection to the server is freed once the transaction ends, making it reusable for subsequent transactions which might come from the same session or a different one. The transaction pooling setting breaks some session pooling features, but in general the conversion to a “transaction pooling”-ready setup is easy and the cons are not so important in the general case. A common setup is to configure the app server’s pool with semi-persistent connections: A rather larger pool of connections per user or per app (which connect to pgbouncer) with long idle timeouts. This way connection time from the app is minimal while pgbouncer will help keep connections to the server as few as possible.
One thing that will most probably be of concern once you go live with PostgreSQL is understanding and fixing slow queries. The monitoring tools we mentioned in the previous blog like pg_stat_statements and also the screens of tools like ClusterControl will help you identify and possibly suggest ideas for fixing slow queries. However once you identify the slow query you’ll need to run EXPLAIN or EXPLAIN ANALYZE in order to see exactly the costs and times involved in the query plan. The next tip is about a very useful tool in order to do that.
Tip 10
You must run your EXPLAIN ANALYZE on your database, and then copy the output and paste it on the depesz’s explain analyze online tool and click submit. Then you will see three tabs: HTML, TEXT and STATS. HTML contains cost, time and number of loops for every node in the plan. The STATS tab shows per node type statistics. You should observe the “% of query” column, so that you know where your query exactly suffers.
As you get more familiar with PostgreSQL you’ll find many more tips on your own!