blog
Proactive PostgreSQL Monitoring (Developer Studio/Advisors angle)

Monitoring is a way to know if your systems are working properly. Even when using a robust technology like PostgreSQL, it is important to have a good monitoring system that allows you to prevent issues before they affect your business. The best way to monitor your database in a proactive way is to have custom checks to adapt them to your workload and also notification to make sure you will be notified in case of failure.
This could be a time-consuming task as you need to create everything manually, but, what about using ClusterControl for this? Yes, you can do that, and in this blog, we will figure out how.
ClusterControl Notifications
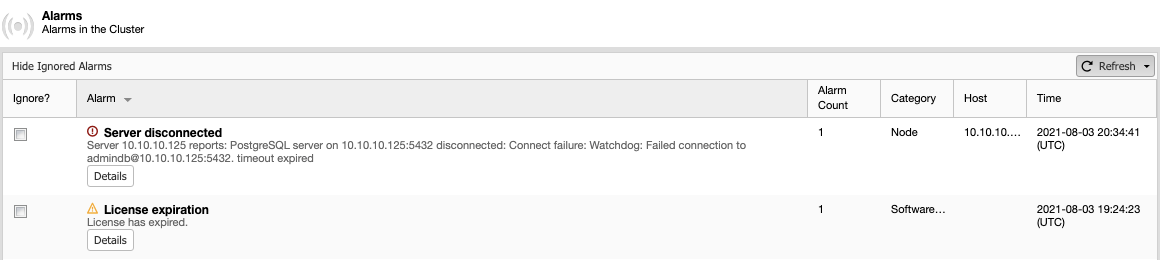
ClusterControl has an alarm system using Advisors to notify you in case of failure or unexpected behavior. It comes with some predefined advisors, but you can modify it or even create a new one using the Developer Studio integrated tool. Also, it has integration with 3rd party tools like Slack or PagerDuty, so you can receive notifications there too.
ClusterControl Advisors
ClusterControl has an internal mini-program called Advisors, where you write a small program that lives and runs within the structure of the ClusterControl objects. You can think of it as a scheduled function that executes a script created in Developer Studio and produces a result containing status, advice, and justification. This allows users to easily extend the functionality of ClusterControl by creating custom advisors that can run on-demand or on a schedule.
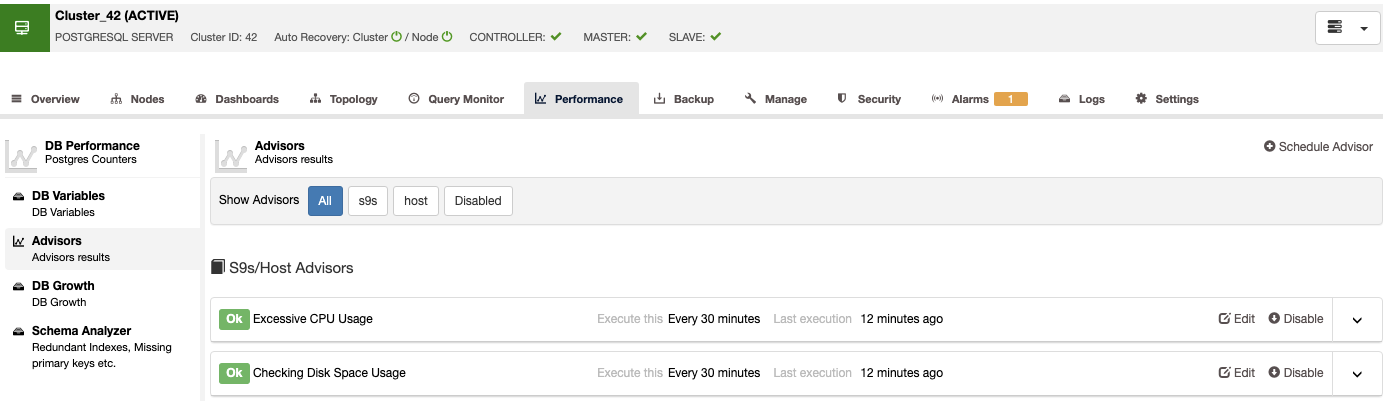
There are some predefined Advisors that can be found under ClusterControl -> Performance -> Advisors, but you can also schedule new ones using the Schedule Advisor option: the option will send you to the Developer Studio section.
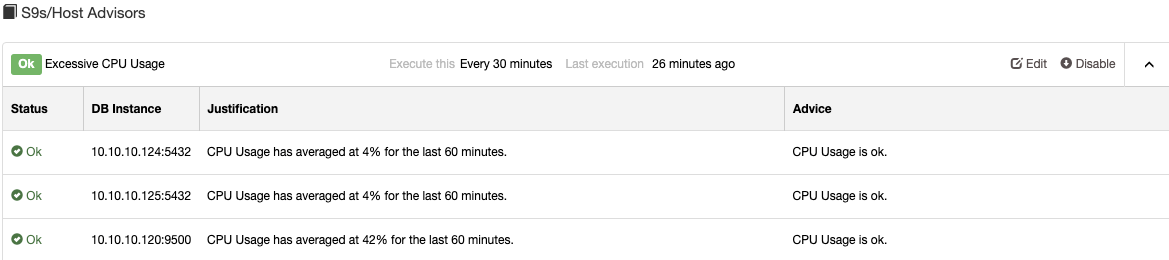
For the existing Advisors, you can see the schedule configuration, last execution, and also information like current status, database instance, a message about the output, and an advice if needed.
ClusterControl Developer Studio
The mentioned advisors are mini scripts written in the ClusterControl Domain Specific Language (DSL) that is a Javascript-like language. These scripts can be written, compiled, saved, executed, and scheduled in ClusterControl by using the Developer Studio tool integrated in ClusterControl.
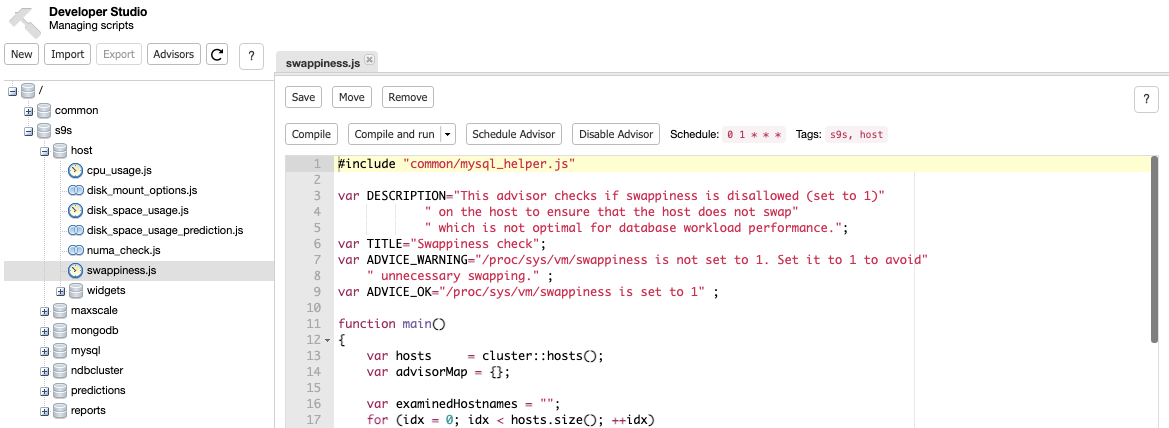
To access this tool, go to ClusterControl -> Manage -> Developer Studio. Once there, you will be able to see the available scripts but also new scripts can be created, imported, or exported too.
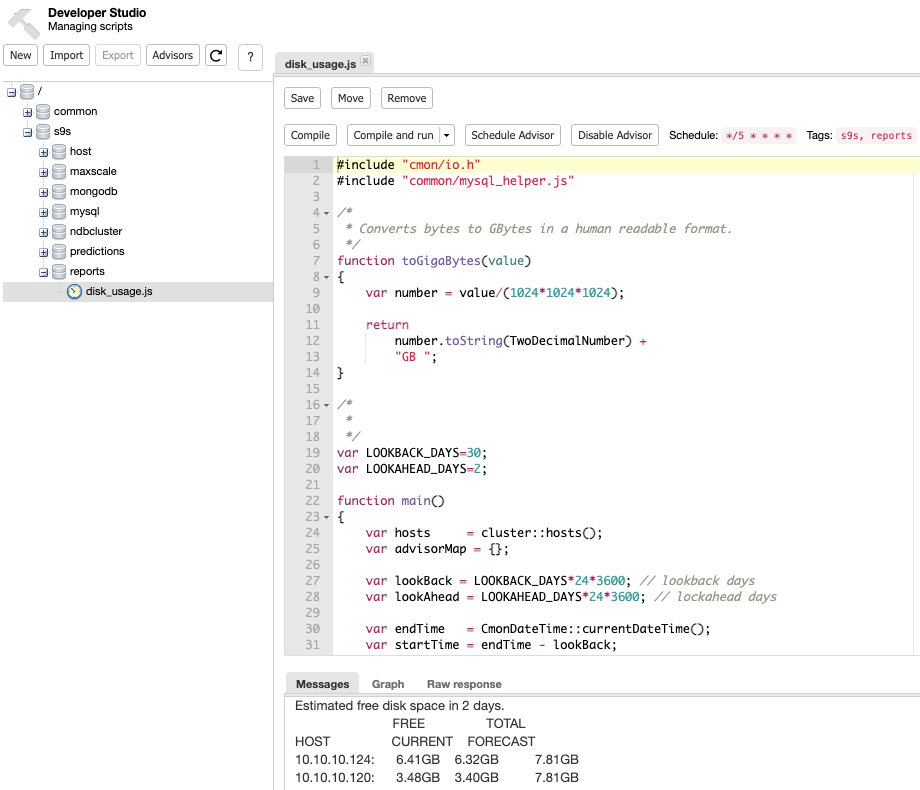
When you are changing or creating a script, you can compile your job, compile and run it, schedule or disable it altogether.
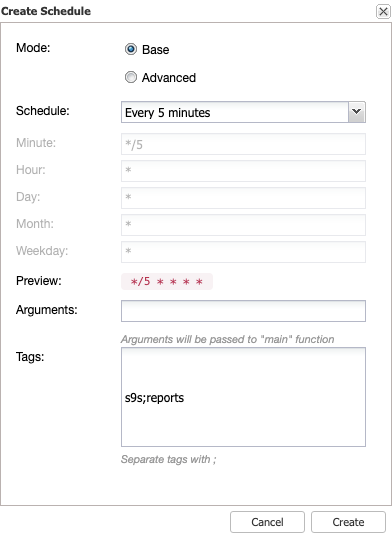
In case you want to schedule a new script, the configuration is basically a cron job, where you can specify when and how often you want to run it in two different modes: Basic (Base) or Advanced.
If you are scheduling an existing script, you can see the output in the message section.
And, if you want to create a new script, for example, to execute an SQL query on your PostgreSQL database to know the current version, there is a basic example:
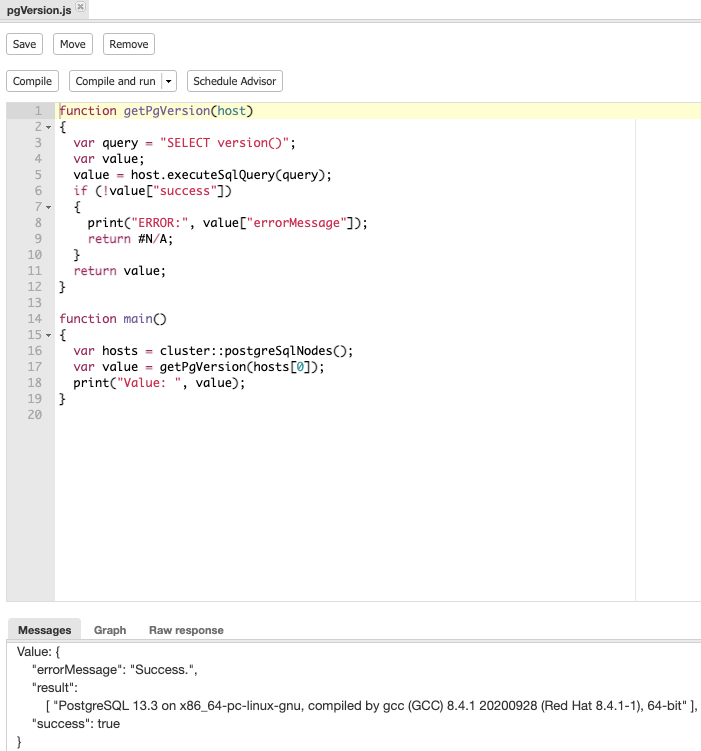
For more examples about the usage of the DSL language, you can refer to the Official Documentation.
Conclusion
A good monitoring system needs to be able to send notifications, show alarms, and also offer the possibility to customize the scripts to adapt them to your company.
ClusterControl has all the mentioned features: it can offer features ranging from many management and monitoring features like auto recovery, backups, deployment, to security and more.
At the beginning, creating custom advisors for your PostgreSQL database could be hard as you need javascript knowledge, and some basic knowledge about ClusterControl, but once you have your first advisor created, the rest should be an easy task.


