blog
pgDash Alternatives – PostgreSQL Database Monitoring with ClusterControl

Database monitoring and alerting is a particularly important part of database operations, as we must understand the current state of the database. If you don’t have good database monitoring in place, you will not be able to find problems in the database quickly. This could then result in downtime.
One tool available for monitoring is pgDash, a SaaS application for monitoring and alerting for the PostgreSQL database.
pgDash Installation Procedure
Registration for pgDash can be done via the website or can also be downloaded (self-hosted) as provided by RapidLoop.
The installation process of pgDash is simple, we just need to download the package needed from pgDash to be configured on the host / database server side.
You can run the process as follow:
[postgres@n5 ~]$ curl -O -L https://github.com/rapidloop/pgmetrics/releases/download/v1.9.0/pgmetrics_1.9.0_linux_amd64.tar.gz

  % Total    % Received % Xferd  Average Speed   Time    Time     Time  Current

                                 Dload  Upload   Total   Spent    Left  Speed

100   647  100   647    0     0    965      0 --:--:-- --:--:-- --:--:--   964

100 3576k  100 3576k    0     0   189k      0  0:00:18  0:00:18 --:--:--  345k

[postgres@n5 ~]$ tar xvf pgmetrics_1.9.0_linux_amd64.tar.gz

pgmetrics_1.9.0_linux_amd64/LICENSE

pgmetrics_1.9.0_linux_amd64/README.md

pgmetrics_1.9.0_linux_amd64/pgmetrics

[postgres@n5 ~]$ curl -O -L https://github.com/rapidloop/pgdash/releases/download/v1.5.1/pgdash_1.5.1_linux_amd64.tar.gz

  % Total    % Received % Xferd  Average Speed   Time    Time     Time  Current

                                 Dload  Upload   Total   Spent    Left  Speed

100   644  100   644    0     0   1370      0 --:--:-- --:--:-- --:--:--  1367

100 2314k  100 2314k    0     0   361k      0  0:00:06  0:00:06 --:--:--  560k

[postgres@n5 ~]$ tar xvf pgdash_1.5.1_linux_amd64.tar.gz

pgdash_1.5.1_linux_amd64/LICENSE

pgdash_1.5.1_linux_amd64/README.md

pgdash_1.5.1_linux_amd64/pgdash

[postgres@n5 ~]$ ./pgmetrics_1.9.0_linux_amd64/pgmetrics --no-password -f json ccdb | ./pgdash_1.5.1_linux_amd64/pgdash -a NrxaHk3JH2ztLI06qQlA4o report myserver1
Apart from pgDash you will need another package, pgmetrics, to be installed for monitoring. pgmetrics is an open source utility whose job is to collect information and statistics in the database needed by pgDash, while the job of pgdash is to send that information to the dashboard.
If you want to add more databases to the monitoring platform, you would need to repeat the above process for each database.
Although the installation of pgDash is simple, there are repetitive processes that can become a concern if there are additional databases that need to be monitored. You will most likely need to make an automation script for that.
pgDash Metrics
There are 3 main features under pgDash Dashboard, those are:
- Dashboard: consists of sub-menus such as: Overview, Database, Queries, Backend, Locks, Tablespace, Replication, WAL Files, BG Writers, Vacuum, Roles, Configuration.
- Tools: consists of sub-menus, such as Index Management, Tablespace Management, Diagnostics, and Top-K.
- Alerts: consist of sub-menus such as Alerts & Change Alerts.
PostgreSQL Monitoring by ClusterControl
Monitoring conducted by ClusterControl uses the ssh method and direct connection from the controller node to the target database node in gathering information needed to be displayed on the dashboard.
ClusterControl also has an Agent Based Monitoring feature that can easily be activated. You can see it below…
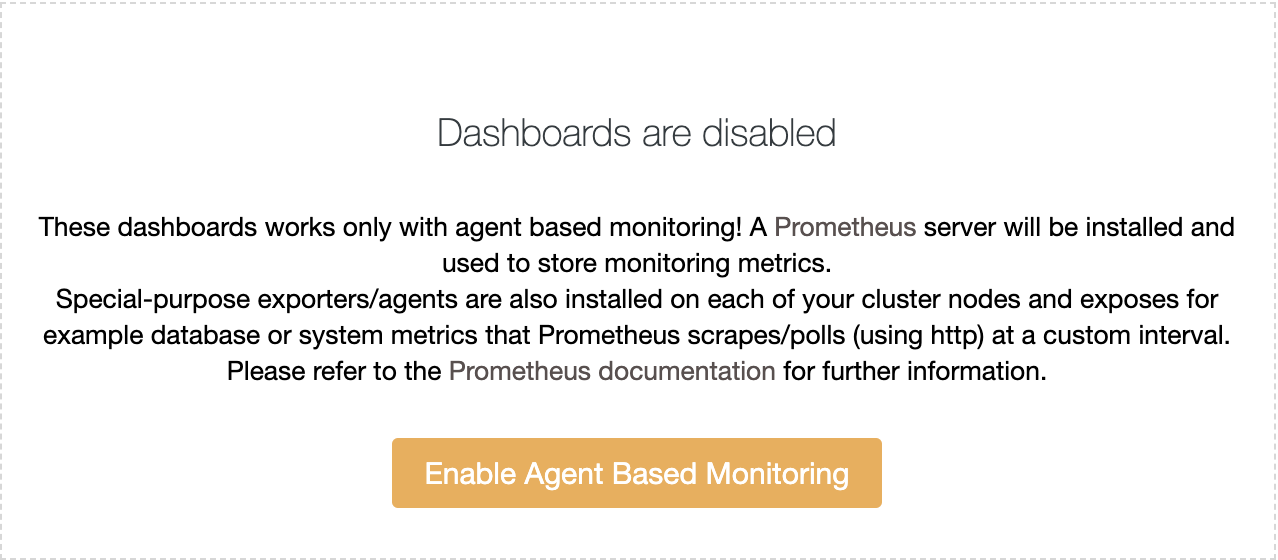
ClusterControl will then carry out the prometheus installation process, node exporters, and PostgreSQL exporters, in the targeted database that aims to gather and to collect information required by the dashboard to display metrics.
If Agent Based Monitoring is active, any new target database will be automatically added and monitored by Agent Based Monitoring.
ClusterControl Dashboards
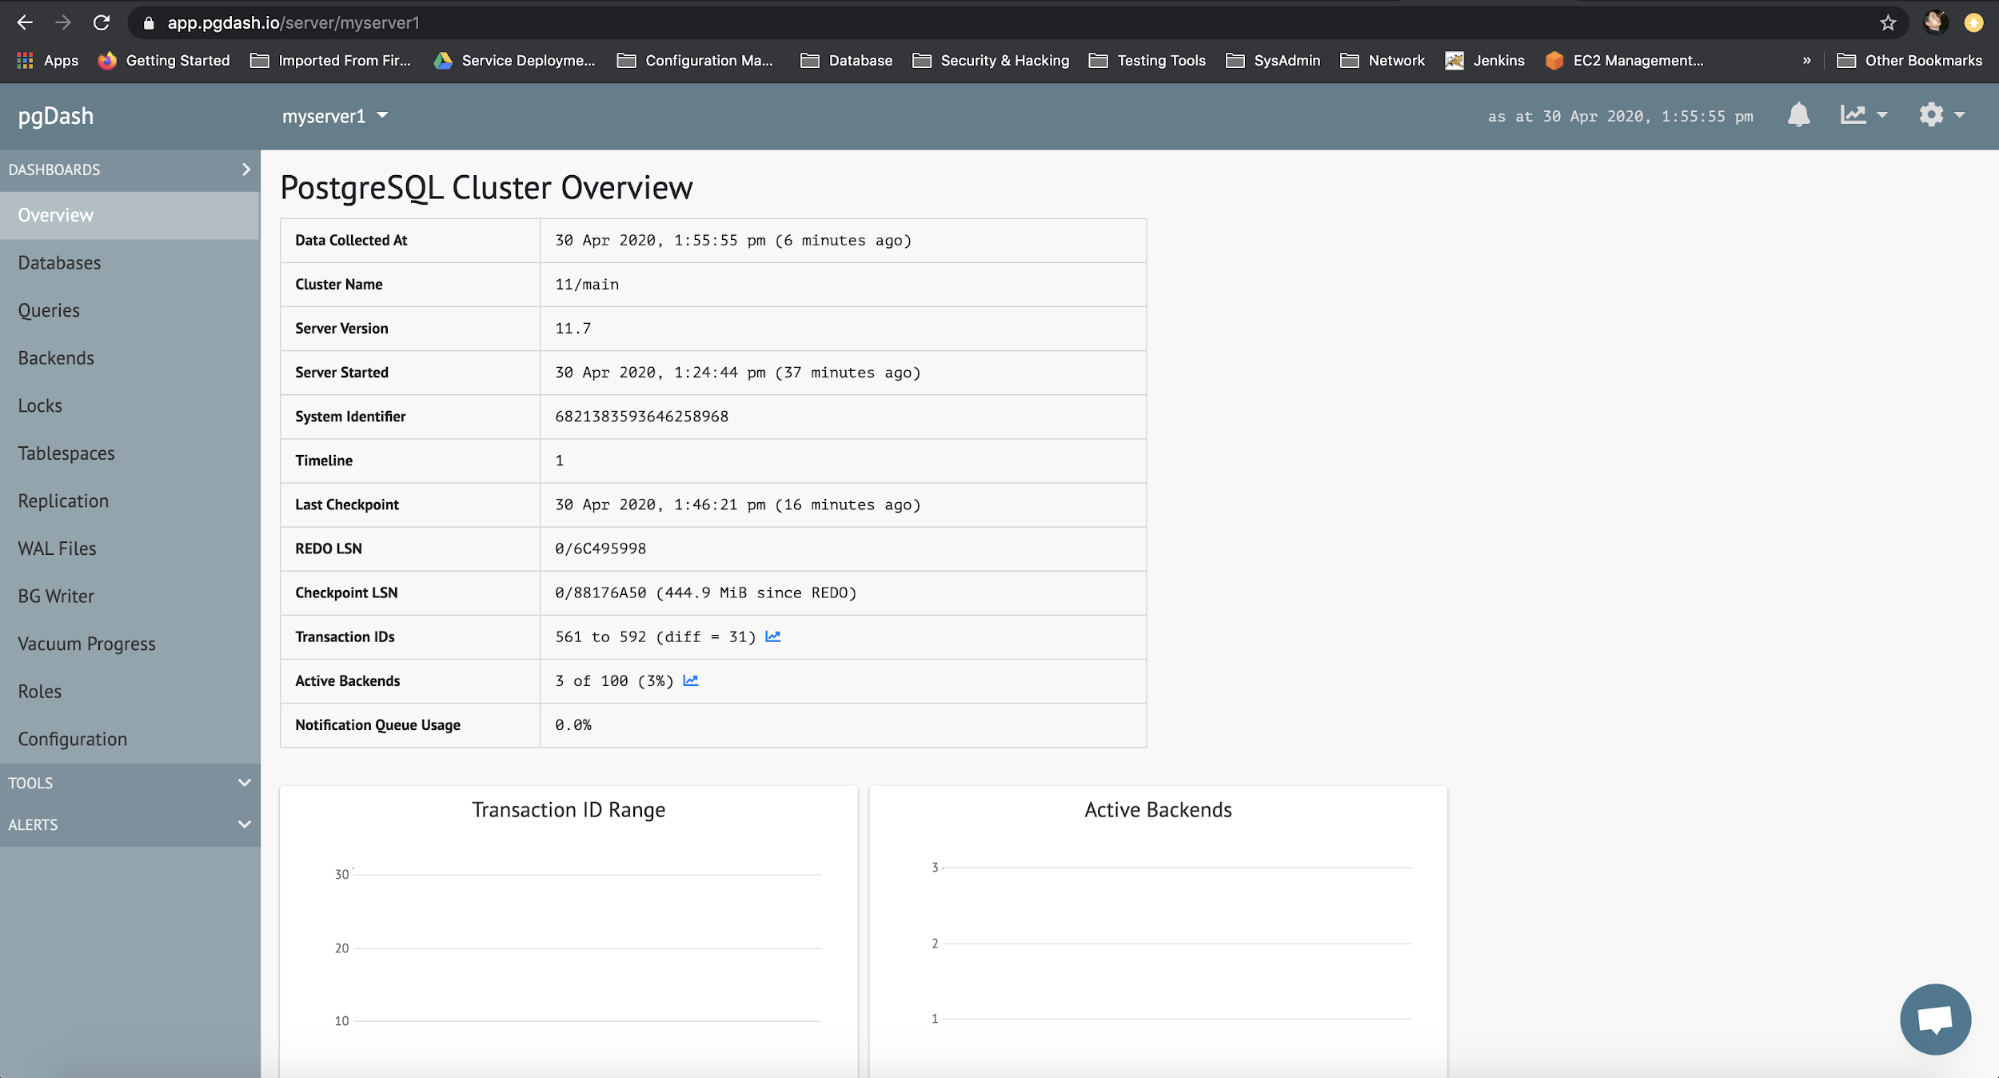
Here you can see information in the PostgreSQL Cluster Overview and System Information screens. In this function you can see detailed information such as db version, transaction ID, Last Checkpoint and Date and Time when the server is alive. This information is depicted below:

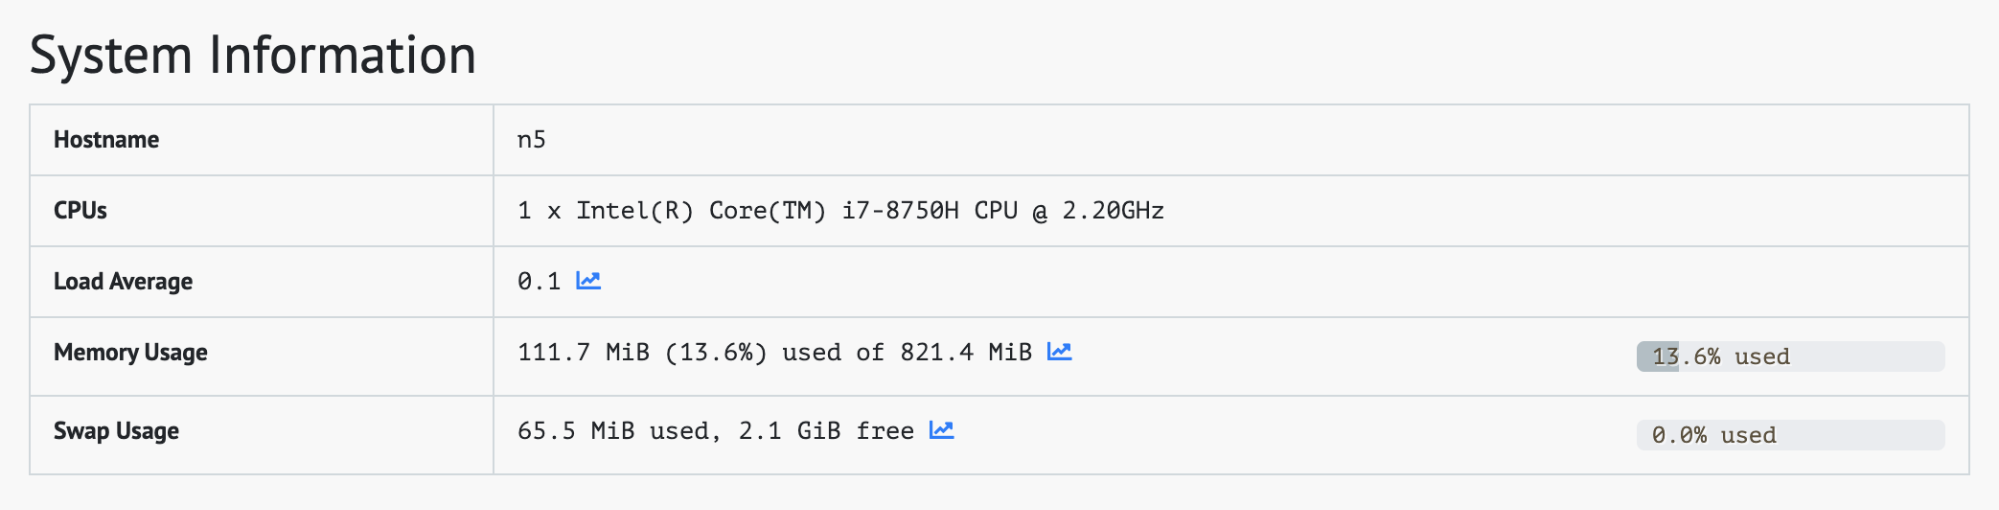
In System Information page, we can get the information such as Load Average, Memory Usage, Swap Usage, see the picture below:
- Database: you can get the information such as db name, db size, number of tables, index and also tablespace.
- Queries: you can monitor Calls, Disk Write, Disk Read, Buffer Hit from queries. Also, you can search any query that runs within a specific time period.
- Backend: you can monitor current state of database backend, within this information, critical details are provided, such as backends waiting for the locks, other waiting backends, transaction open too long, backend idling in transaction. You can also see all the backends that run in the database.
- Locks: You can check the number of total locks, locks not granted, and blocked queries.
- Tablespace: provides information related to tablespace, ie. tablespace size, usage of Disk and Inodes.
- Replications: you can monitor your Replication status in PostgreSQL database, start from Replication Slot, Incoming Replication, Outgoing Replication, Replication Publications, and Replication Subscriptions.
- Wal Files: provides information related to WAL (Write Ahead Log) and also statistics eg: WAL File Counts, WAL Generation Rate, WAL Files Generated Each Hours.
- BG Writers: provides information related to checkpoint database, buffer written, and parameters related to the Background Writer.
- Vacuum Progress: contains information related to the Vacuum which runs in the database, also vacuum parameters.
- Roles: contains information related to the roles which exist in the database including privileges.
- Configuration: contains parameters in database PostgreSQL.
Inside Tools, there are sub-menus such as Index Management that provided information ie. Unused Index, Bloat Index, dan Index with Low Cache Hit Ratio. Tablespace Management provides information related to Tablespace dan other objects available under.
Diagnostics, to understand the potential issues that may occur through Top 10 Most Bloated Tables, Top 10 Most Bloated Indexes, List of Inactive Replication Slots, Top 10 Longest Running Transactions, etc.
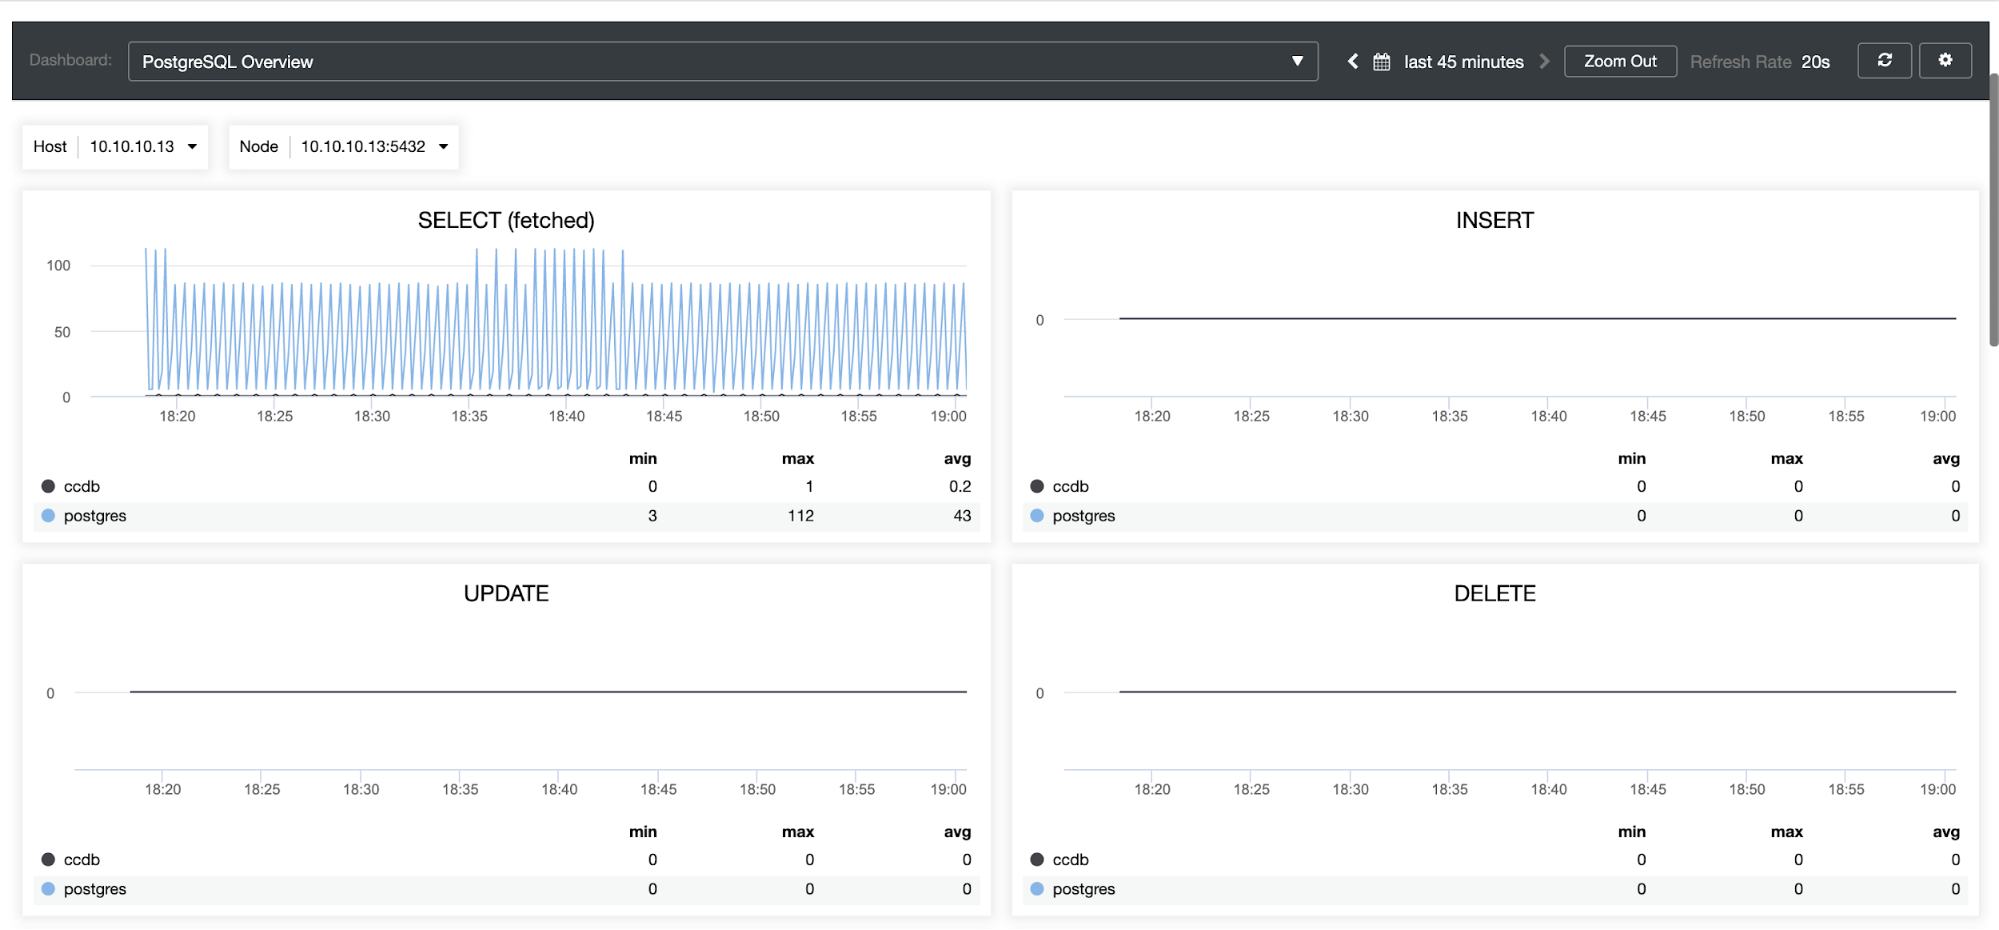
ClusterControl has several metrics under separated menu, those are Overview, Nodes, Dashboard, Query Monitor, and Performance, see picture below :
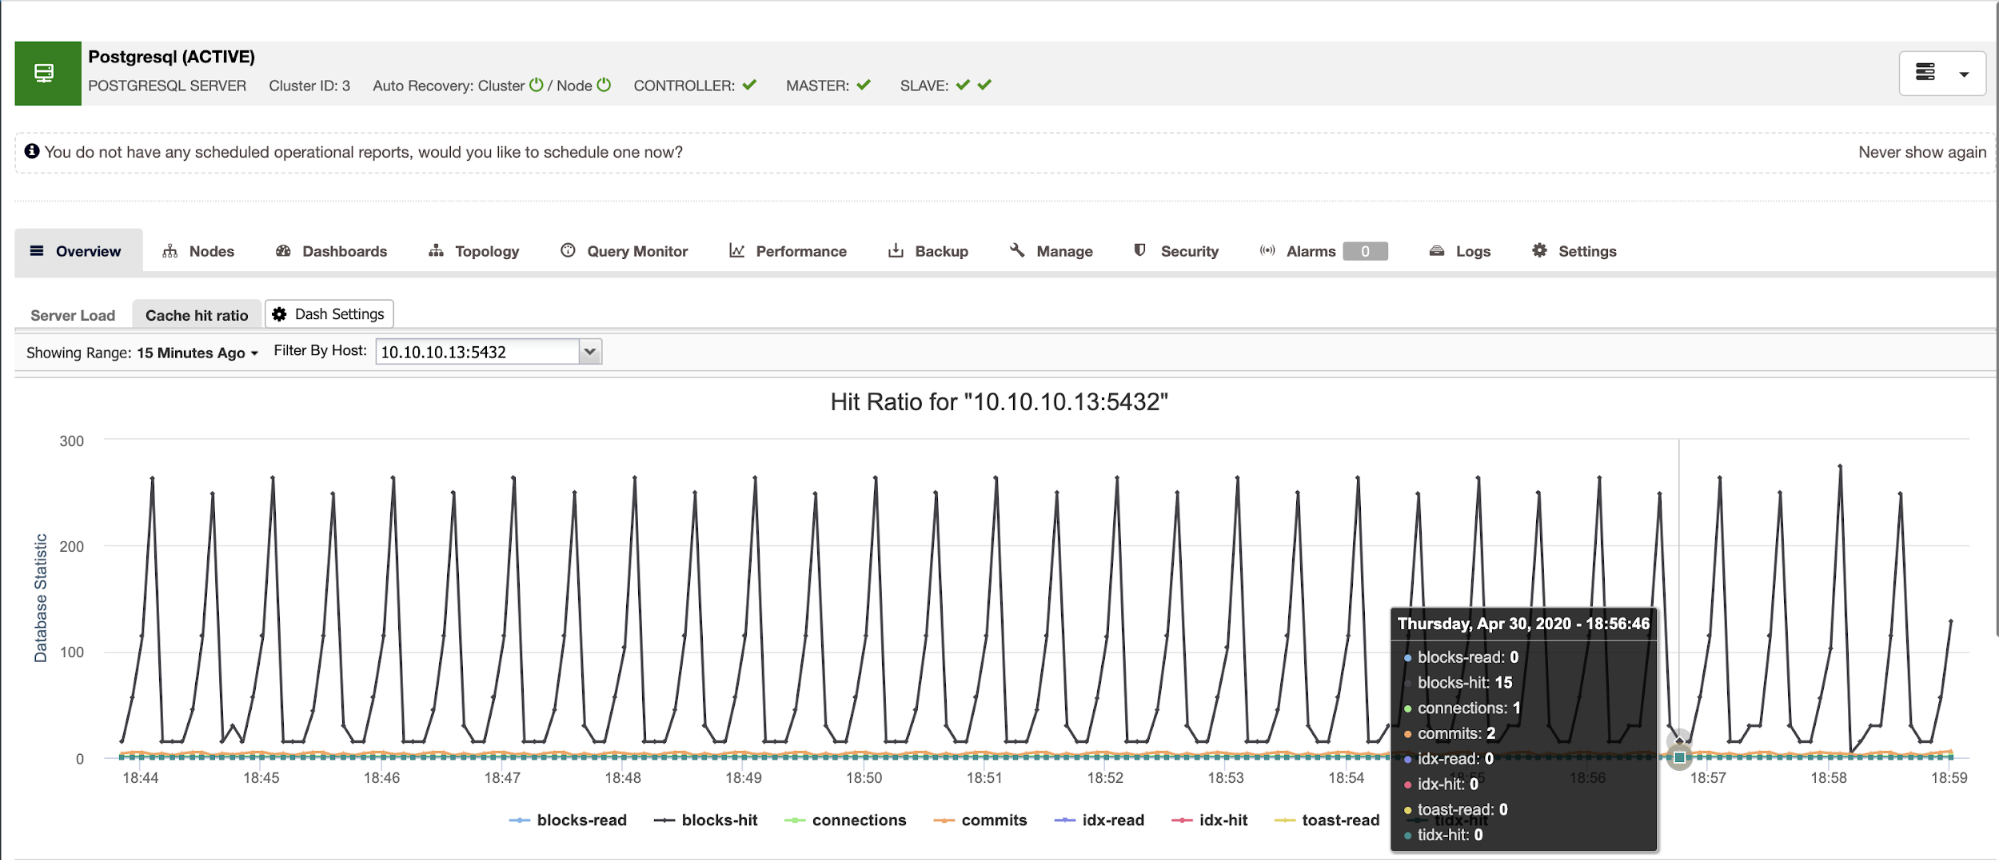
When Agent Based Monitoring is enabled, hence all of the information related to statistics and other information related to the database will be stored in a time series database (prometheus). You can see those information in ClusterControl as depicted below :
In the Query Monitor, you can find Top Queries, Running Queries, Query Outliers, or Query Statistics menus. They provide information related to running query, top query, and statistics of the database. You can also configure slow queries and non-indexing queries.
On Performance, there are sub-menus such as DB Growth that can show information of database and table size statistics. Schema Analyzer provides information related to Redundant Index and Table without primary key.
PostgreSQL Alerting
There are two parts of alerting…
- Alert Rules: alert rules play a major role, you can define limits as parameters that can trigger alarm to the DBA.
- Third Party Integration: is an integration channel to the incident management platform for communication and collaboration such as: PagerDuty, OpsGenie, Slack, or via Email.
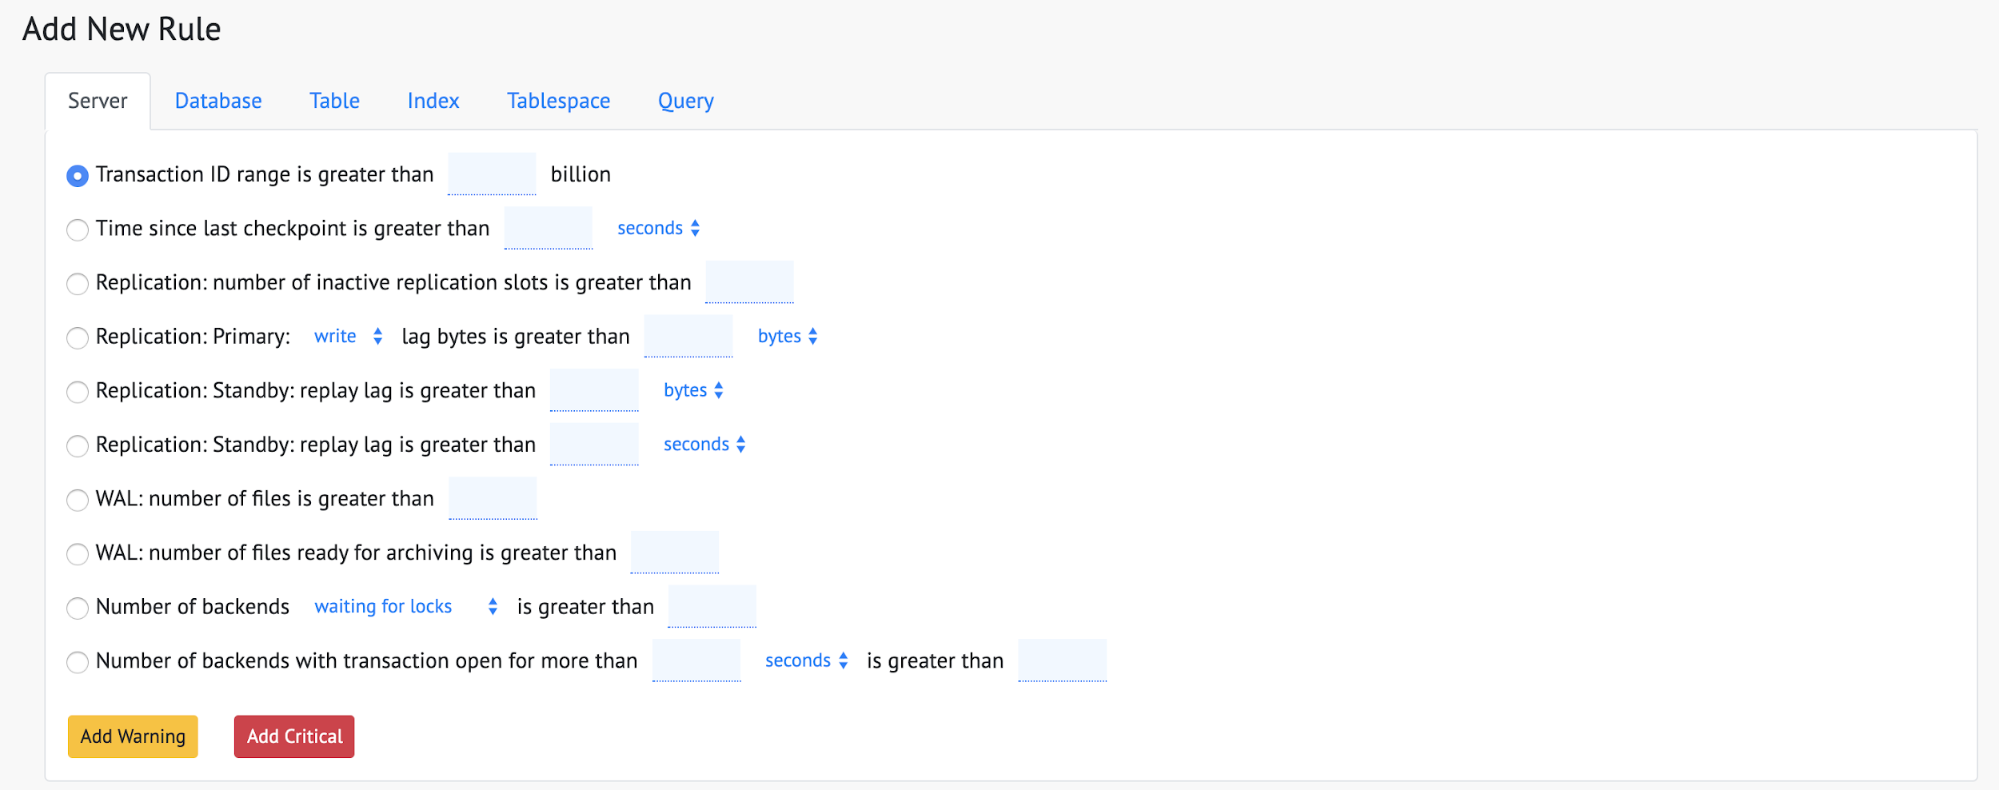
PgDash has many options of database parameters you can set related to the alert rule, divided in several layers starting from Server, Database, Table, Index, Tablespace, and Query. You can see those information in pgDash as depicted below…
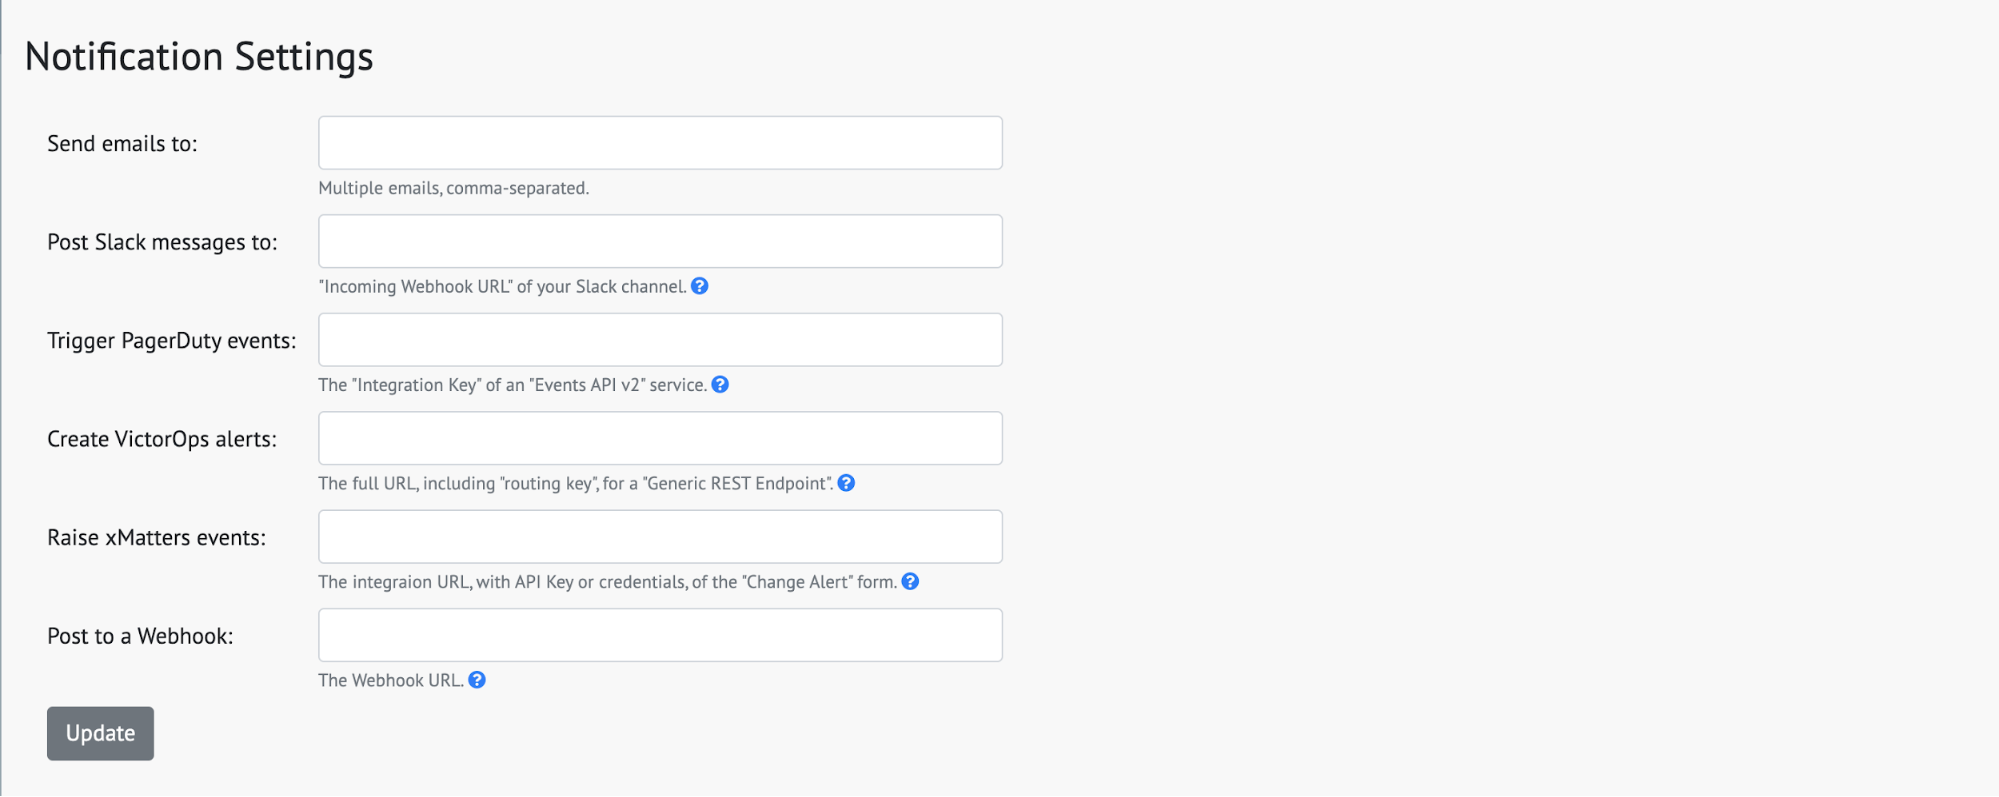
As for the third party integration channel, pgDash has support for several channels such as Slack, Pagerduty, VictorOps, Xmatters, e-mail, or making their own webhooks so they can be consumed by other services.
The following is the appearance of the Third party Integration of pgDash :
In contrast to pgDash, ClusterControl has a broader and more general event alert option, starting with alerts related to the host, network, cluster, and database itself. The following are examples of event options that can be selected :
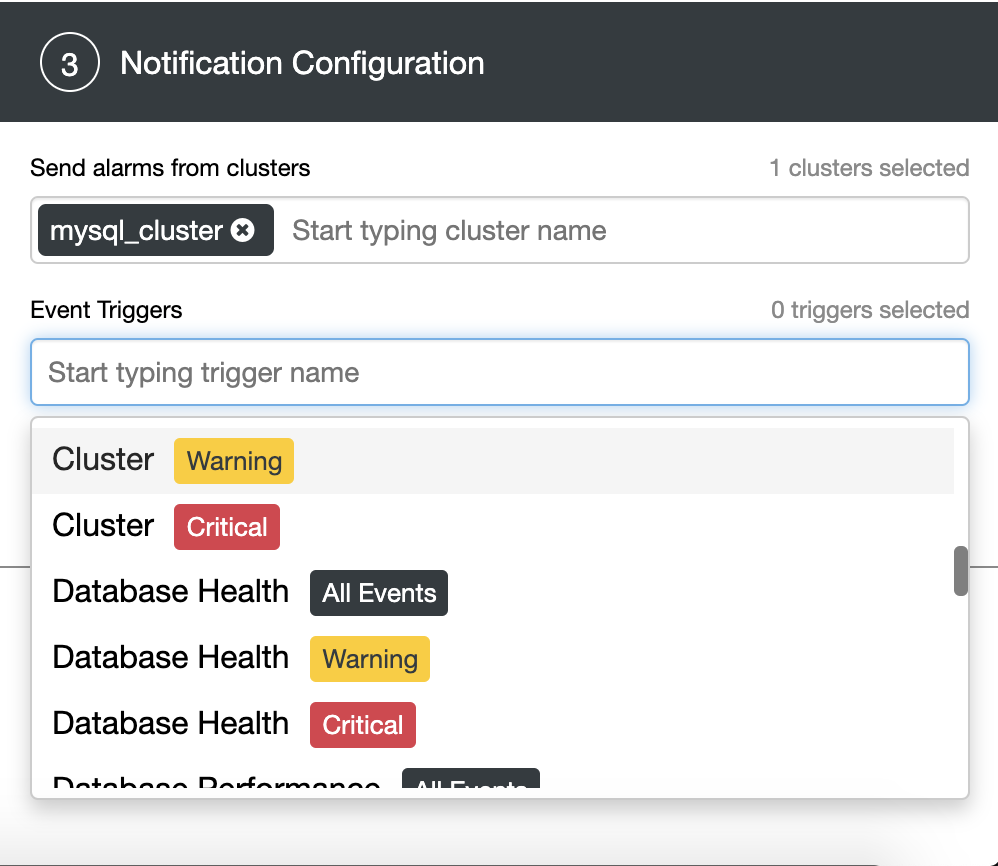
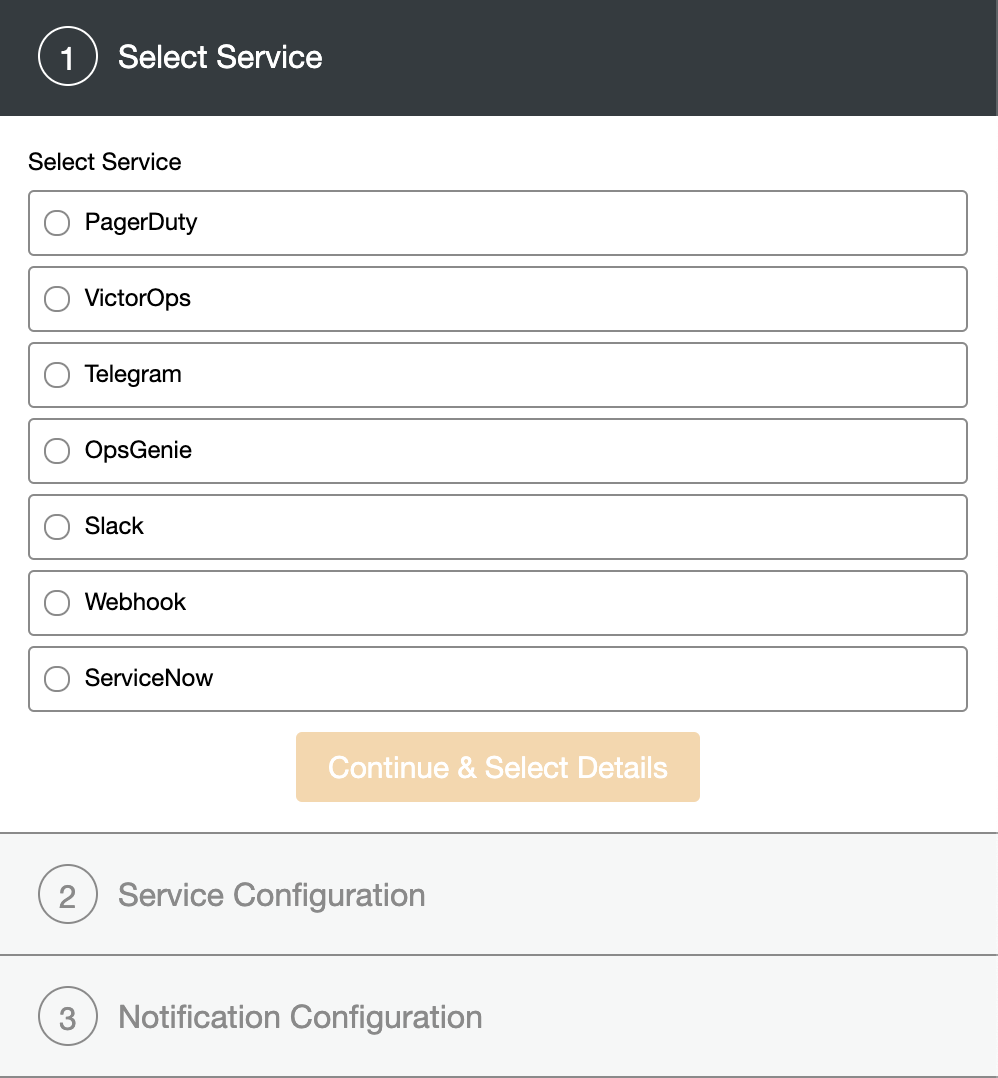
ClusterControl can select several database clusters in one event alert. Third party integration from ClusterControl supports several incident management and communication / collaboration tools such as PagerDuty, VictorOps, Telegram, OpsGenie, Slack, ServiceNow, or can create your own webhook.
In the alert rules section, both pgDash and ClusterControl have advantages and disadvantages. The advantage of pgDash is that you can set very detailed database alerts related to what will be sent, while the drawback is that you have to do these settings in each database (although there is a feature to import from other database configurations.
ClusterControl lacks detailed event alerts, only general database events, but ClusterControl can send alerts not only related to the database, but can send event alerts from nodes, clusters, networks, etc. Besides that you can set these alerts for several database clusters.
In the Third party Integration section, pgDash and ClusterControl both have support for various third party incident management and communication channels. Infact both of them can make their own webhook so that it can be consumed by other services (eg. Grafana).