blog
MySQL Troubleshooting with pt-stalk: Part 2

In our last post, we showed you how to use pt-stalk to help gather a bunch of data that can be used for troubleshooting. But what type of data does it collect? How do we parse the files to make sense of all that data?
This is the twentieth installment in the ‘Become a MySQL DBA’ blog series. Our previous posts in the DBA series include:
- Troubleshooting with pt-stalk,
- Troubleshooting Galera cluster issues – part 2,
- Troubleshooting Galera cluster issues – part 1,
- Galera cluster diagnostic logs,
- Understanding the MySQL error log,
- Optimizing Hints for faster queries,
- Using EXPLAIN to improve SQL Queries,
- Database Indexing,
- Deep Dive pt-query-digest,
- Analyzing SQL Workload with pt-query-digest,
- Query Tuning Process,
- Configuration Tuning,
- Live Migration using MySQL Replication,
- Database Upgrades,
- Replication Topology Changes,
- Schema Changes,
- High Availability,
- Monitoring & Trending.
After reading the previous post, you should know how to use pt-stalk to watch MySQL metrics and trigger data collection when a predefined situation happens. You should also know about a couple of different ways how you can collect the data, and how you can extend pt-stalk to cover some more complex cases.
Today, we’ll talk about the data you collected – what kind of data does pt-stalk provide you with, and how you can utilize it. Let’s start with answering the question – where and how pt-stalk stores its data?
By default, it uses /var/lib/pt-stalk directory but you can change it using –dest variable at pt-stalk invocation. If you take a look into the directory, you’ll see multiple files following the pattern of:
‘2015_12_03_15_45_20-*’Basically, every file from a single data set uses the same timestamp, which you’ll find very useful when searching through the different incidents. Each of the files contains specific type of data collected by a particular process executed by pt-stalk. Some of the files are created all the time, some of them only when a particular condition is matched. An example of such a file can be ‘*-lock-waits’ – file created only when at least one transaction was in the ‘LOCK_WAIT’ state. Otherwise you won’t find it in the output.
We will not cover all of the files created by pt-stalk in detail – there are too many of them and some are useful only in edge cases. We want to focus on those which are used most often.
Disk status
Pt-stalk collects some data about the state of the storage layer. Most important aspects are stored in following files.
*-df
Sample of data from this file may look like this:
TS 1449157522.002282558 2015-12-03 15:45:22
Filesystem     1K-blocks     Used Available Use% Mounted on
/dev/xvda1       8115168  2286260   5393632  30% /
none                   4        0         4   0% /sys/fs/cgroup
udev             2018468       12   2018456   1% /dev
tmpfs             404688      412    404276   1% /run
none                5120        0      5120   0% /run/lock
none             2023428        0   2023428   0% /run/shm
none              102400        0    102400   0% /run/user
/dev/xvdf      104806400 11880864  92925536  12% /var/lib/mysql
TS 1449157523.008747734 2015-12-03 15:45:23
Filesystem     1K-blocks     Used Available Use% Mounted on
/dev/xvda1       8115168  2286264   5393628  30% /
none                   4        0         4   0% /sys/fs/cgroup
udev             2018468       12   2018456   1% /dev
tmpfs             404688      412    404276   1% /run
none                5120        0      5120   0% /run/lock
none             2023428        0   2023428   0% /run/shm
none              102400        0    102400   0% /run/user
/dev/xvdf      104806400 11879236  92927164  12% /var/lib/mysql
This is a simple output of df command, executed every second for the duration of 30s. This is a pretty common pattern in pt-stalk, it tries to collect some data samples over time to make it easier to compare the changes. In this particular case, we are presented with information about disk space in the system – may come handy when e.g. binary logs filled the disk, triggering some weird behavior.
*-diskstats
This file contains samples from /proc/diskstats collected for 30 seconds. Raw output is not very useful but we can use it together with pt-diskstats, another tool from Percona Toolkit, to present some nice info about I/O utilization. Here’s a sample of this output.
root@ip-172-30-4-156:/var/lib/pt-stalk# pt-diskstats --columns-regex='_s|time|cnc|prg' 2015_12_03_15_45_20-diskstats

  #ts device    rd_s rd_mb_s rd_cnc    wr_s wr_mb_s wr_cnc in_prg    io_s  qtime stime
  1.0 xvda       0.0     0.0    0.0    37.8     0.6    2.3      0    37.8   31.2   2.0
  1.0 xvda1      0.0     0.0    0.0    37.8     0.6    2.3      0    37.8   31.2   2.0
  1.0 xvdf      48.7     0.7    3.8   217.6    15.3   37.8      0   266.3  127.3   2.4

  #ts device    rd_s rd_mb_s rd_cnc    wr_s wr_mb_s wr_cnc in_prg    io_s  qtime stime
  2.0 xvda       0.0     0.0    0.0     0.0     0.0    0.0      0     0.0    0.0   0.0
  2.0 xvda1      0.0     0.0    0.0     0.0     0.0    0.0      0     0.0    0.0   0.0
  2.0 xvdf      73.5     1.0    0.6   136.3     5.4    2.0      0   209.8    7.7   1.9

  #ts device    rd_s rd_mb_s rd_cnc    wr_s wr_mb_s wr_cnc in_prg    io_s  qtime stime
  3.0 xvda       0.0     0.0    0.0     1.0     0.0    0.0      0     1.0    0.0   0.0
  3.0 xvda1      0.0     0.0    0.0     1.0     0.0    0.0      0     1.0    0.0   0.0
  3.0 xvdf      73.8     0.9    0.5   141.5     5.8    1.8      0   215.3    6.3   2.1

  #ts device    rd_s rd_mb_s rd_cnc    wr_s wr_mb_s wr_cnc in_prg    io_s  qtime stime
  4.0 xvda       0.0     0.0    0.0     1.0     0.0    0.0      0     1.0    0.0   0.0
  4.0 xvda1      0.0     0.0    0.0     1.0     0.0    0.0      0     1.0    0.0   0.0
  4.0 xvdf      57.1     0.8    1.0   192.3     8.9    3.7      0   249.4   12.1   1.7

  #ts device    rd_s rd_mb_s rd_cnc    wr_s wr_mb_s wr_cnc in_prg    io_s  qtime stime
  5.0 xvda       0.0     0.0    0.0     1.0     0.0    0.0      0     1.0    0.0   0.0
  5.0 xvda1      0.0     0.0    0.0     1.0     0.0    0.0      0     1.0    0.0   0.0
  5.0 xvdf      79.0     1.0    0.5   180.0    10.9    4.4    110   259.0   37.5   1.8

  #ts device    rd_s rd_mb_s rd_cnc    wr_s wr_mb_s wr_cnc in_prg    io_s  qtime stime
  6.0 xvda       0.0     0.0    0.0     5.9     0.1    0.1      0     5.9    0.5   2.1
  6.0 xvda1      0.0     0.0    0.0     5.9     0.1    0.1      0     5.9    0.5   2.1
  6.0 xvdf      71.4     1.0    3.6   234.0    19.0   40.3      0   305.4  106.2   2.4
Pt-diskstats is subject for another blog post. We’ll just mention that this tool gives you the ability to aggregate and filter the most important I/O data from your system. Looking into our case here, it’s pretty clear we are suffering from some kind of I/O contention – ‘qtime’, a column which tells us how long I/O call waits in the scheduler’s queue, spikes even to more than 100ms. This is high even for a spindle. This kind of data, combined with knowledge of the limits of your hardware, gives you better insight in whether I/O is a culprit or just one of the symptoms of a problem.
Network data
*-netstat, *-netstat_s
Those files contain info about currently opened connections (*-netstat) and a summary of network-related statistics (*-netstat_s). This kind of data can be very useful when dealing with issues with network.
Memory data
*-meminfo
This file contains samples extracted from /proc/meminfo. Samples are taken every second, collecting information about memory utilization on the system.
TS 1449157522.002282558 2015-12-03 15:45:22
MemTotal:        4046860 kB
MemFree:          121688 kB
Buffers:            6768 kB
Cached:          2353040 kB
SwapCached:            0 kB
Active:          2793796 kB
Inactive:         986648 kB
Active(anon):    1420712 kB
Inactive(anon):      396 kB
Active(file):    1373084 kB
Inactive(file):   986252 kB
Unevictable:           0 kB
Mlocked:               0 kB
SwapTotal:             0 kB
SwapFree:              0 kB
Dirty:             14476 kB
Writeback:         15772 kB
AnonPages:       1420692 kB
Mapped:           145200 kB
Shmem:               472 kB
Slab:              96028 kB
SReclaimable:      80948 kB
SUnreclaim:        15080 kB
KernelStack:        2160 kB
PageTables:         9996 kB
NFS_Unstable:          0 kB
Bounce:                0 kB
WritebackTmp:          0 kB
CommitLimit:     2023428 kB
Committed_AS:    1715484 kB
VmallocTotal:   34359738367 kB
VmallocUsed:       14164 kB
VmallocChunk:   34359717888 kB
HardwareCorrupted:     0 kB
AnonHugePages:   1335296 kB
HugePages_Total:       0
HugePages_Free:        0
HugePages_Rsvd:        0
HugePages_Surp:        0
Hugepagesize:       2048 kB
DirectMap4k:       26624 kB
DirectMap2M:     4298752 kB
*-pmap
More detailed info about MySQL’s memory allocation can be find in this file.
*-slabinfo
Here you’ll see information collected from /proc/slabinfo. Again here, some samples are collected every second which show how slab cache utilization changed over time.
*-procvmstat
This file contain samples of data from /proc/vmstat collected every second.
CPU and kernel activity
*-procstat
Information about CPU activity as shown in /proc/stat.
*-interrupts
In this file, you can find information about different kind of interrupt counts and how they are split between CPU cores. It can be pretty useful when trying to identify weird cases of high system load or, sometimes, hardware issues.
Miscellaneous system data
*-lsof
This particular file contains output of “lsof -p $(pidof mysqld)”. We can go through a list of files opened by mysqld, this also include any TCP connections which may be open at that time. Data like this may be interesting when, let’s say, you want to confirm what exact MySQL version you are running (you’ll see what libraries were opened by the mysqld process).
*-ps
This file contains the output of the ps command, listing processes running at the time of the incident. Could be very useful for catching different types of jobs executed directly on the MySQL host. It also gives nice insight on what is running on the system.
*-top
This file stores collected output of the ‘top’ command – data very similar to what you can find in the ‘*-ps‘ file. An important addition is a snapshot of the CPU utilization per process.
*-vmstat and *-vmstat-overall
Stores data collected using ‘vmstat’ command. Sample may look like this:
procs -----------memory---------- ---swap-- -----io---- -system-- ------cpu-----
 r  b   swpd   free   buff  cache   si   so    bi    bo   in   cs us sy id wa st
71  1      0 122156   6768 2352744    0    0   166  1267   83  200 20 18 47  4 11
 1 11      0 124996   6768 2353260    0    0   684 19456 7023 6694 37 34  0  8 21
56  1      0 125676   6780 2352220    0    0   636  6259 7830 6733 37 36  0  4 23
 0  1      0 125304   6780 2353312    0    0   920  7118 6233 10782 36 30 12  5 17
 0  3      0 122824   6780 2355568    0    0   988  5474 6733 10108 31 27 13 12 16
39  0      0 122396   6780 2356252    0    0   844  8618 8251 10843 30 24 25  9 13
 0  4      0 123236   6780 2355080    0    0   896 22482 11639 9266 30 29  9 18 14
58  0      0 122072   6788 2356484    0    0  1036  6446 8043 11345 33 25  8 20 15
11  2      0 124680   4460 2355928    0    0  1096  9380 8784 11449 36 33  3  8 19
22  0      0 124172   4460 2356952    0    0  1068  5922 8303 12137 36 32  3 11 18
15  0      0 124008   4460 2355200    0    0   796  5764 8256 10389 36 36  3  3 22
54  0      0 125920   4460 2356124    0    0  1012  8041 8449 12298 38 31  2 11 18
61  0      0 122172   4468 2358724    0    0   920  5811 7817 11650 37 33  2  8 20
51  0      0 124420   4248 2357304    0    0   920 10804 6565 10155 32 25  8 21 14
10  0      0 123900   4248 2358144    0    0  1252  5554 8922 12652 38 30  5 10 18
30  0      0 125356   4248 2356552    0    0   760  4208 8296 9757 32 26 22  5 15
27  2      0 123956   4248 2357688    0    0  1420  7164 6986 12300 41 32  4  4 20
 3  1      0 121624   4256 2360016    0    0   912  6373 7653 10600 36 34  6  4 20
 0  0      0 123724   4248 2358048    0    0   748 10550 6878 10302 34 30  7 12 17
52  1      0 124720   4248 2356756    0    0  1068  3228 6470 10636 33 29 17  5 17
23  0      0 123984   4248 2357672    0    0  1072  5455 5990 11145 36 32  7  7 17
It’s a little bit of everything – running processes, memory and swap utilization, I/O and swap disk traffic, number of interrupts and context switches per second, CPU utilization. Simple data but it can give you a good idea on how the system performed at a time of the incident.
Data related to MySQL
*-processlist
This is self-explanatory – this file contains output of the SHOW PROCESSLISTG, one of the most important means of understanding the state of MySQL.
*-innodbstatus1 and *-innodbstatus2
Those files contain output of SHOW ENGINE INNODB STATUS taken at the start and at the end of the data collection. SHOW ENGINE INNODB STATUS is a crucial tool to understand the state of MySQL and InnoDB as engine. Having two files allows us to compare how the state changed. It would not be possible to explain, in a couple of sentences, how this data can be useful to a DBA. In short, you’ll find here information about running transactions and their state, info about last deadlocks, locking contentions on both row level and internal contention (on mutex/latch level). You can also use this data to get an insight on I/O activity for InnoDB. We covered some of these points in two past blog posts:
Monitoring – Understanding and Optimizing CPU-related InnoDB metrics
Monitoring – Understanding and Optimizing IO-related InnoDB metrics
*-lock-waits
Another important piece of data – this file contains information about transactions which were stuck in the ‘LOCK_WAIT’ state when data was collected. Sample output may look like this:
TS 1449157537.003406070 2015-12-03 15:45:37
*************************** 1. row ***************************
   who_blocks: thread 28242 from 172.30.4.23:14643
  idle_in_trx: 0
max_wait_time: 0
  num_waiters: 1
*************************** 1. row ***************************
    waiting_trx_id: 16480064
    waiting_thread: 28196
         wait_time: 0
     waiting_query: UPDATE sbtest1 SET k=k+1 WHERE id=500167
waiting_table_lock: `sbtest`.`sbtest1`
   blocking_trx_id: 16479993
   blocking_thread: 28242
     blocking_host: 172.30.4.23
     blocking_port: 14643
       idle_in_trx: 0
    blocking_query: COMMIT
As you can see, we have information about the transaction which was waiting – transaction ID and thread number, query which waits for the execution, table which is involved. We also can see who’s locking – transaction id, thread number, host, port and blocking query. At the beginning you can also see nice summary of who’s blocking and how many other transactions are waiting (num_waiters) – pretty useful in identifying the most offending blockers.
Data collected here is coming from information_schema.innodb_lock_waits table.
*-transactions
This file contains list of all running transactions at the time of the data collection. Sample output can look like:
*************************** 43. row ***************************
                    trx_id: 16479993
                 trx_state: RUNNING
               trx_started: 2015-12-03 15:45:36
     trx_requested_lock_id: NULL
          trx_wait_started: NULL
                trx_weight: 8
       trx_mysql_thread_id: 28242
                 trx_query: COMMIT
       trx_operation_state: NULL
         trx_tables_in_use: 0
         trx_tables_locked: 0
          trx_lock_structs: 4
     trx_lock_memory_bytes: 1184
           trx_rows_locked: 3
         trx_rows_modified: 4
   trx_concurrency_tickets: 0
       trx_isolation_level: REPEATABLE READ
         trx_unique_checks: 1
    trx_foreign_key_checks: 1
trx_last_foreign_key_error: NULL
 trx_adaptive_hash_latched: 0
 trx_adaptive_hash_timeout: 10000
          trx_is_read_only: 0
trx_autocommit_non_locking: 0
As you may have noticed, this particular example contains the info about transactions in which there was a blocker – we identified it in the *-lock_waits file. Knowing the thread or transaction ID, it’s very easy to grep through the lock_waits data, transaction data, processlist and SHOW ENGINE INNODB STATUS output and connect all the pieces together, building a broad view of how the lock contention started and what might have been the culprit. This particular data comes from the information_schema.innodb_trx table and contains lots of info about each of the running transactions. You can find here information on currently running queries, number of rows locked, when the transaction started, transaction isolation level and many others.
*-mutex-status1 and *-mutex-status2
These two files contain information collected using ‘SHOW ENGINE INNODB MUTEX’ at the beginning and at the end of the data collection process. Sample output may look like:
InnoDB  &space->latch   os_waits=1
InnoDB  &purge_sys->latch       os_waits=11760
InnoDB  &new_index->lock        os_waits=20451
InnoDB  &dict_operation_lock    os_waits=229
InnoDB  &space->latch   os_waits=9778
InnoDB  &log_sys->checkpoint_lock       os_waits=925
InnoDB  &btr_search_latch_arr[i]        os_waits=23502
InnoDB  table->sync_obj.rw_locks + i    os_waits=2
What you see here is a list of different mutexes, and for each information, details on how many os_waits happened. If you do not have detailed tracking of waits enabled in the performance schema, this is the best way to get the understanding which mutex causes the biggest contention for your workload.
*-mysqladmin
This file contains samples of output of ‘SHOW GLOBAL STATUS’ executed using mysqladmin tool. What we are looking here is everything MySQL presents using this command – handlers, InnoDB stats, binlog stats, Galera stats (if you use Galera cluster). Such data can be useful for investigating different type of problems. In fact, this is exactly the type of data DBA’s will like to have and review if needed. Main issue with such output is that MySQL presents some of the data as monotonous incremented counters while we’d be interested more in how they change in time. It’s not rocket science to build a script which will perform such conversion but there’s also no need to reinvent the wheel as Percona Toolkit contains pt-mext, a tool which does exactly that.
You can use it in a following way to get a nice and browsable, columnar output.
pt-mext -r -- cat /var/lib/pt-stalk/2015_12_03_15_45_20-mysqladmin | less -S*-opentables1 and *-opentables2
Those files contain a list of opened tables in MySQL, at the beginning and at the end of the data collection. Please note that the current pt-stalk version at the time of writing (version 2.2.16) has a bug where it doesn’t print this data if MySQL contains more than 1000 tables.
*-variables
This file contains output of ‘SHOW GLOBAL VARIABLES’ – a list of all runtime variables in MySQL at the time of data collection. There’s not much to add here – such data is invaluable because, as you probably know, seeing a configuration file is not enough to tell what kind of configuration MySQL is using. Many MySQL variables are dynamic and can be changed at any time, without making a change in my.cnf.
Tools which help to parse pt-stalk data
As you can see, pt-stalk brings you a considerable amount of data to work with. It may look like it’s hard to go through this data but it gets easier with experience. Additionally, the more you are familiar with your MySQL installation, the faster you’ll be able to pinpoint possible issues. Still, it’s a process of looking into tens of files to find the important data – a process which can be very time consuming. Luckily, there are tools that can help in this regard. We’ll talk about two of them.
pt-sift
This tool is part of the Percona Toolkit, and it’s intended to give you an overview of the data collected by pt-stalk. Invocation is simple:
root@ip-172-30-4-156:~# pt-sift /var/lib/pt-stalk/You are presented with a list of data sets stored in the directory you’ve chosen. You can use the latest one (default) or pass another one you want to review.
  2015_11_20_10_15_49  2015_11_20_10_34_20  2015_11_20_10_40_15
  2015_11_24_19_47_52  2015_11_24_19_48_03  2015_11_24_19_48_46
  2015_12_03_12_38_18  2015_12_03_12_42_09  2015_12_03_12_47_18
  2015_12_03_15_43_41  2015_12_03_15_45_20  2015_12_03_16_10_23
  2015_12_03_16_26_41

Select a timestamp from the list [2015_12_03_16_26_41] 2015_12_03_15_45_20
After you pick the sample, you’ll see a summary page:
======== ip-172-30-4-156 at 2015_12_03_15_45_20 DEFAULT (11 of 13) ========
--diskstats--
  #ts device    rd_s rd_avkb rd_mb_s rd_mrg rd_cnc   rd_rt    wr_s wr_avkb wr_mb_s wr_mrg wr_cnc   wr_rt busy in_prg    io_s  qtime stime
 {29} xvdf      75.9    13.1     1.0     0%    1.2    15.5   151.1    47.2     7.0    29%    5.3    24.6  63%      0   227.0   18.4   2.2
 xvdf  0% 30% 15% 20% 15% 20% 30% 25% 20% 25% . . 30% 25% 15% 25% 20% 15% . 20% 15% 20% 15% 25% 15% . . 25% 10% 15%
--vmstat--
 r b swpd   free buff   cache si so  bi   bo   in    cs us sy id wa st
72 1    0 122064 6768 2352744  0  0 166 1267   83   200 20 18 47  4 11
 0 0    0 126908 4248 2356128  0  0 979 7353 7933 10729 35 31  8  8 18
wa 0% 5% 0% 5% 10% 5% 15% 20% 5% 10% 0% 10% 5% 20% 10% 5% 0% . 10% 5% . 0% 5% . 10% 0% 5% 0% 5% 0%
--innodb--
    txns: 65xACTIVE (180s) 3xnot (0s)
    3 queries inside InnoDB, 0 queries in queue
    Main thread: sleeping, pending reads 1, writes 1, flush 0
    Log: lsn = 28182468703, chkp = 27881812915, chkp age = 300655788
    Threads are waiting at:
     50 log0log.ic line 358
      1 btr0cur.cc line 3892
    Threads are waiting on:
      1 S-lock on RW-latch at 0x7f1bf2f53740 '&block->lock'
--processlist--
    State
     40  updating
     14  wsrep in pre-commit stage
      6  statistics
      5
      3  Sending data
    Command
     65  Query
      7  Sleep
      1  Connect
--stack traces--
    No stack trace file exists
--oprofile--
    No opreport file exists
As you can see, pt-sift presents a summary of the diskstats data and vmstat data. It also presents information about InnoDB internals – how many transactions, are there any waits? Some data on InnoDB checkpointing is also presented. We also see a summary of the processlist output. By typing ‘?’, you can see the internal ‘help’ for pt-sift. There are couple of other options you can pick from – see diskstats output, check the SHOW ENGINE INNODB STATUS output, summarize netstat data and check the data from SHOW STATUS.
Rain Gauge
Pt-sift is a CLI tool but if you prefer a UI, you can use a Rain Gauge – a tool which presents pt-stalk data using the web browser.
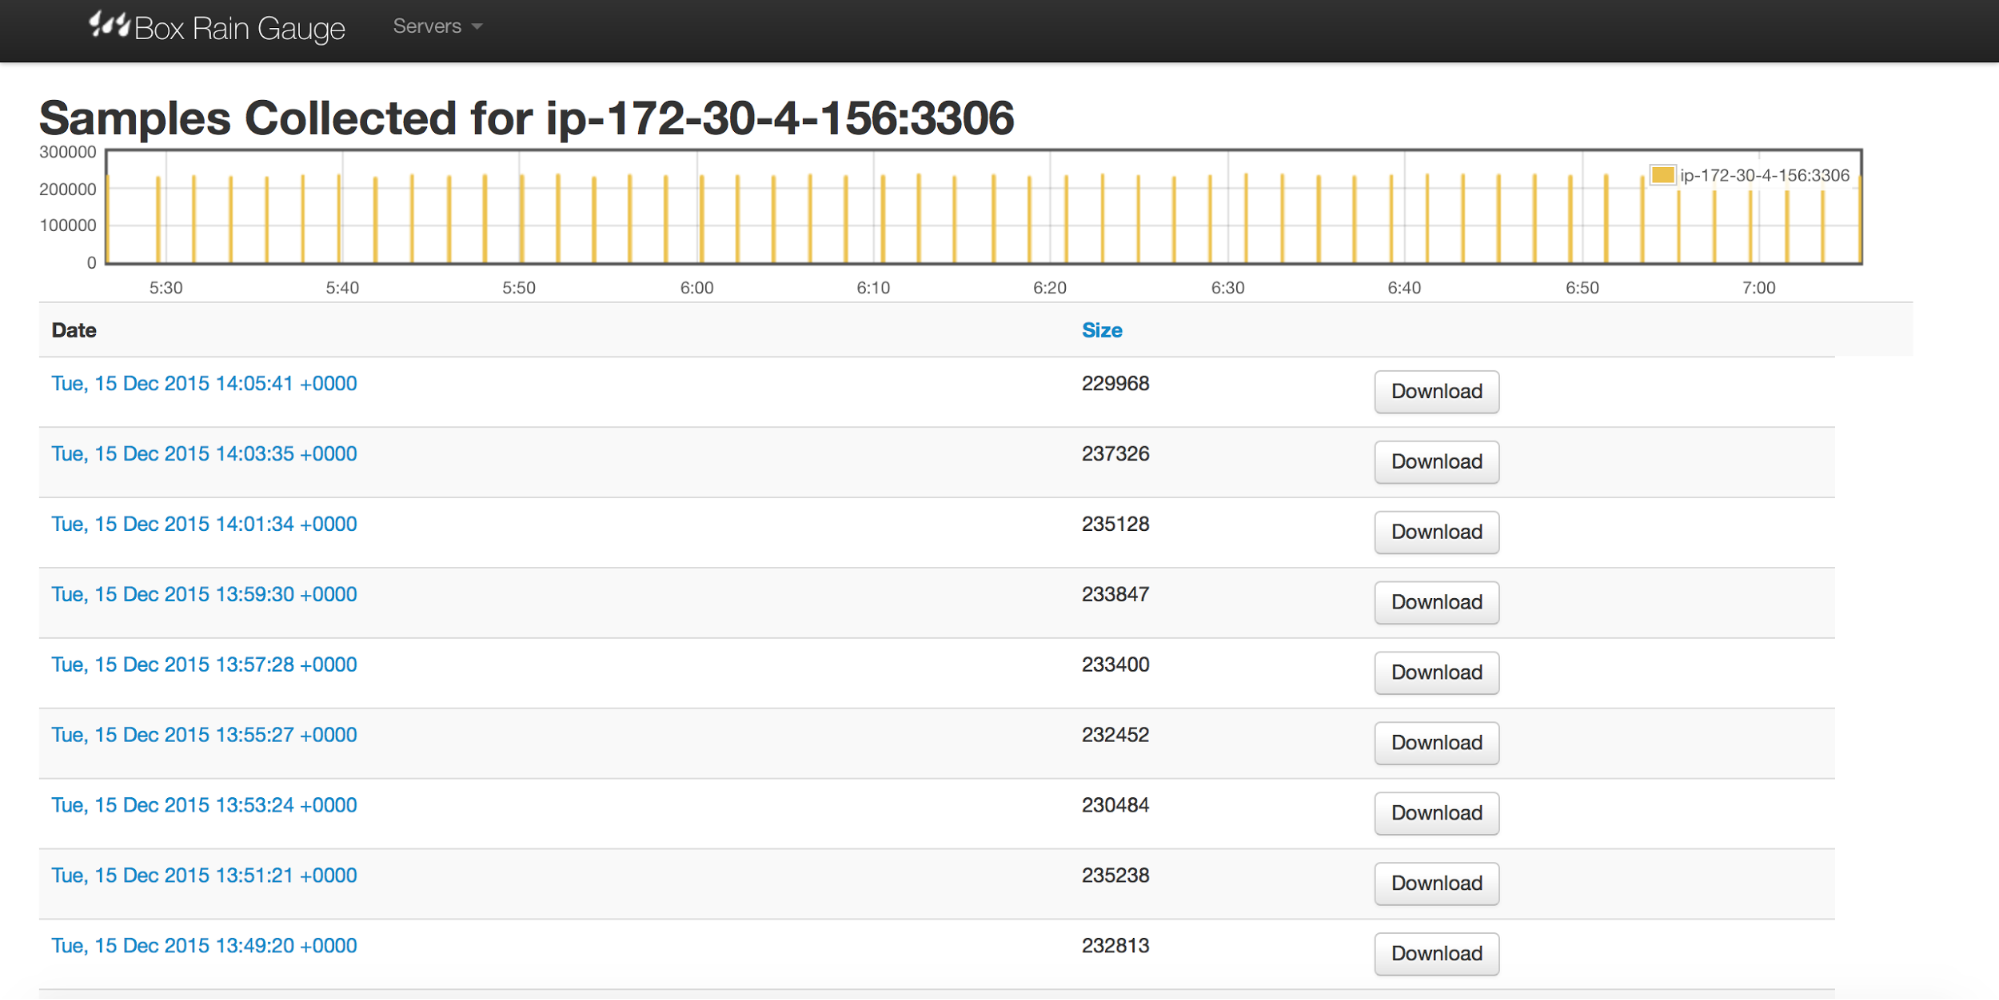
After setup you’ll be presented with a screen summarizing all the source hosts which pushed the data to the Rain Gauge and number of samples collected for each of them. You can pick a host either from the drop down menu or by clicking on the list. You’ll see a screen similar to this one:
Next step is to pick a sample you find interesting. You’ll end up in a summary page.
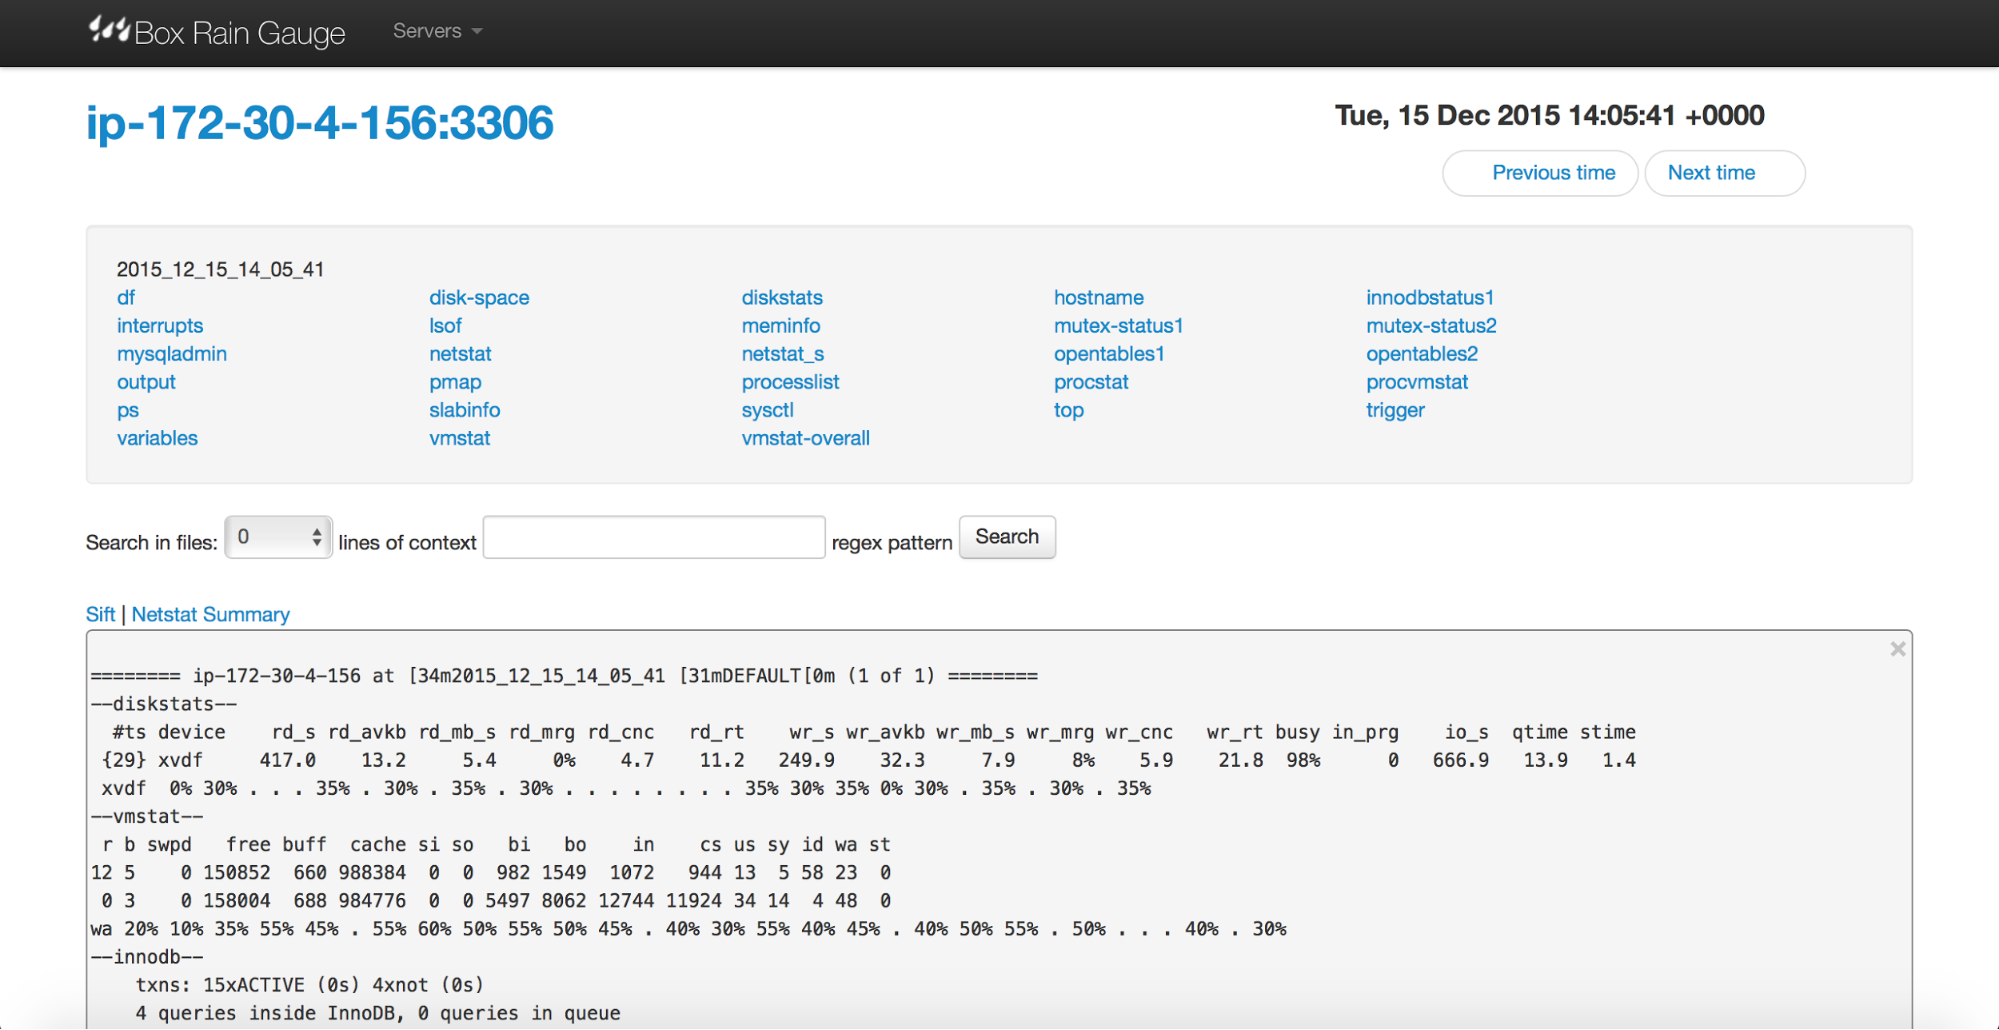
At the top, there are links to different sections of collected data. You can click those links to check the information particularly interesting to you. At the bottom, there’s a summary generated using pt-sift.
Most of the ‘sections’ just print file contents, split by samples, which doesn’t make much difference than using CLI. One of them, though, gives you some extra info. When you check the ‘mysqladmin’ section, you will see a screen like the below:
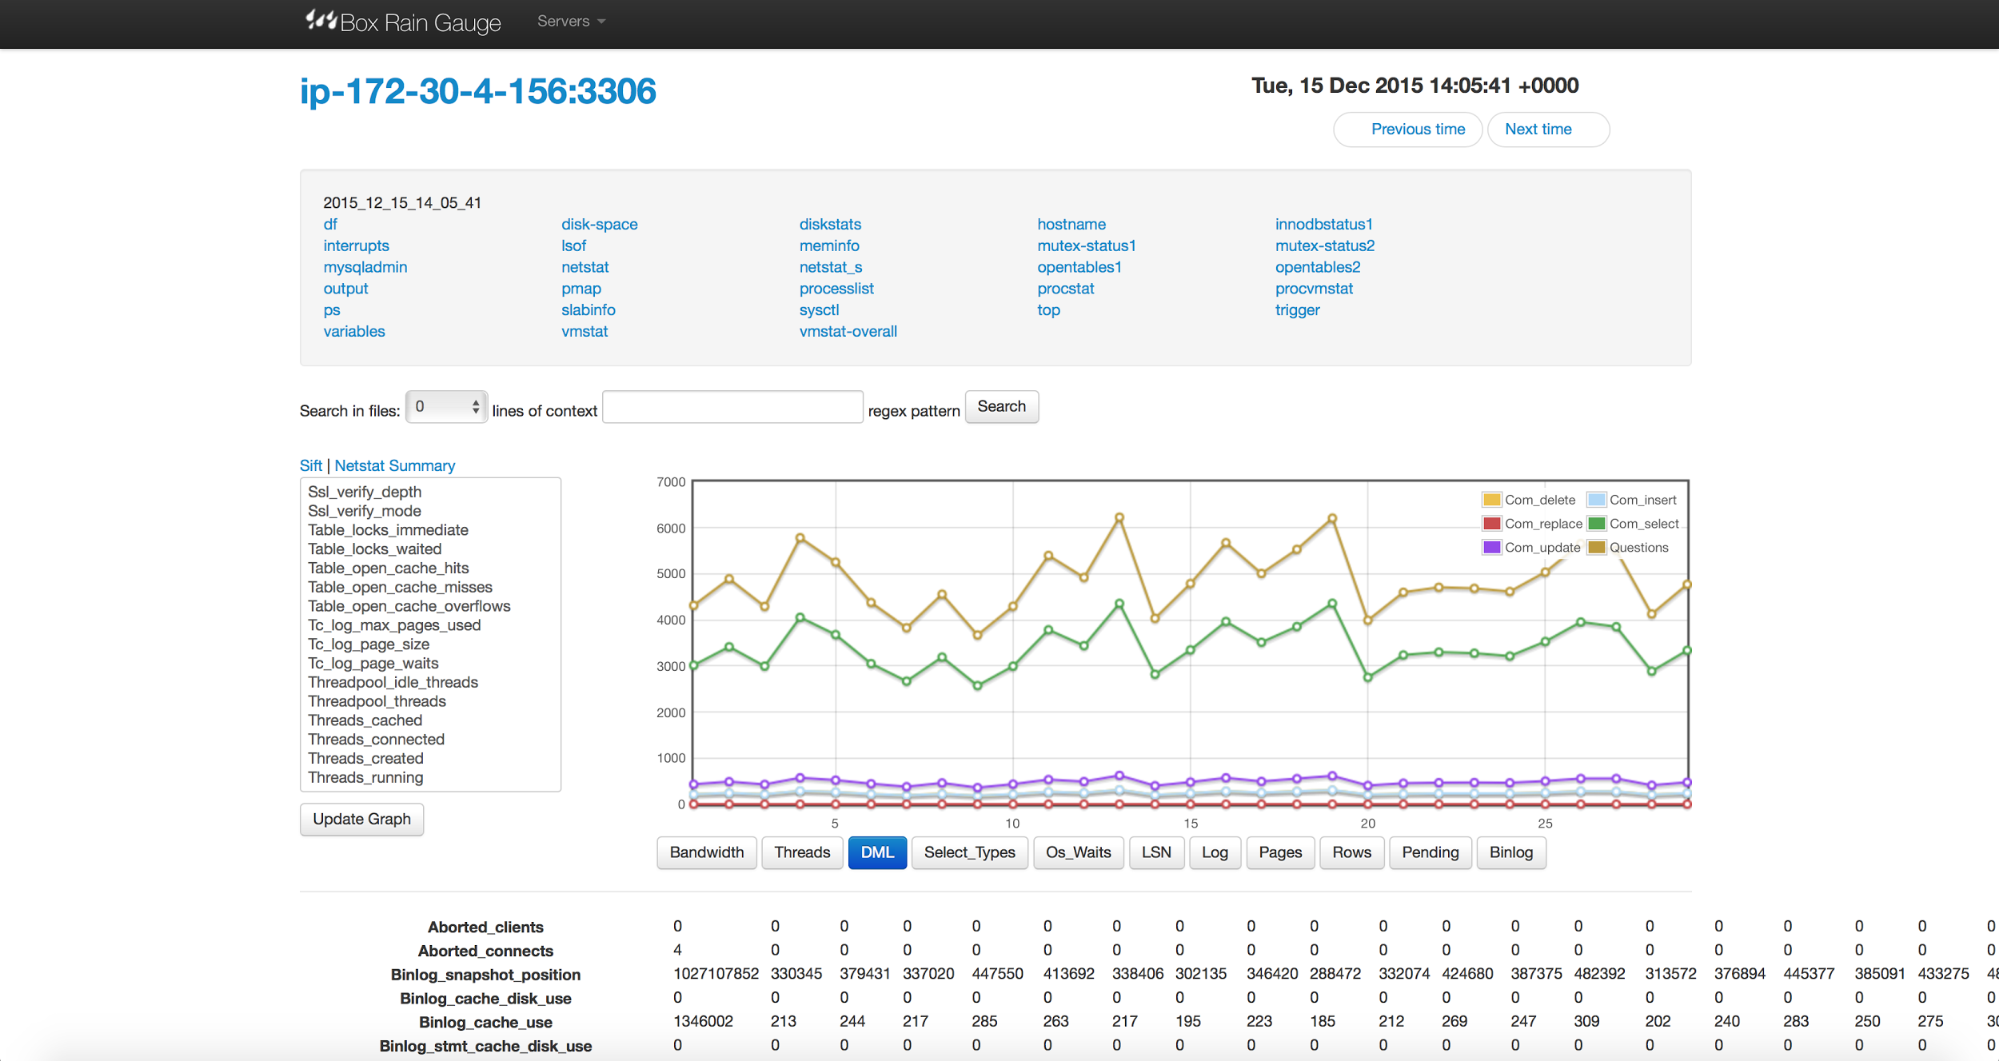
It is possible to graph any combination of the counters by picking them from the list on the left. You can also use one of the presets by clicking the buttons below the graph. Finally, at the bottom, you will see samples stored in multiple columns. Such way of presenting the data is really useful when you want to compare state of different counters. Having the ability to graph the data is also helpful. It’s definitely easier to see trends on a graph than by looking at raw numbers.
With this post, we conclude our coverage of pt-stalk. Hopefully you’ll find this useful if ever you’ll need to use pt-stalk to pinpoint issues in your database environment. In our next post, we will talk about database recovery in MySQL Replication and Galera Cluster setups.
Picture credit: Ken Fager