blog
MyDBA is Sick – Database Monitoring Tips for SysAdmins

Database monitoring is a key function for Database Administrators (DBA). With a proper monitoring platform, you can know immediately if there is something wrong with the system.
Should your DBA be unavailable and you may need to take over the platform to monitor and handle non-critical issues. In this blog are tips that you need to know if you are monitoring your database with tips for troubleshooting any issues.
Database Monitoring Documentation
It is always good to have proper documentation about Database Monitoring. This information should contain information like what tool is being used, what metrics database are being monitored, and what operating system metrics are being monitored. DBAs must prepare the documentation with restricted access to the document. The document must describe information how-to access the database and provide credentials to access the monitoring tools.
How ClusterControl Monitoring Tools Can Help
There are various monitoring tools for databases, providing metrics related to the operating system; database memory, threads, locking, session, slow query. ClusterControl provides a great monitoring tool for your database that is free to use. You can enable agent-based Monitoring in your ClusterControl as shown below
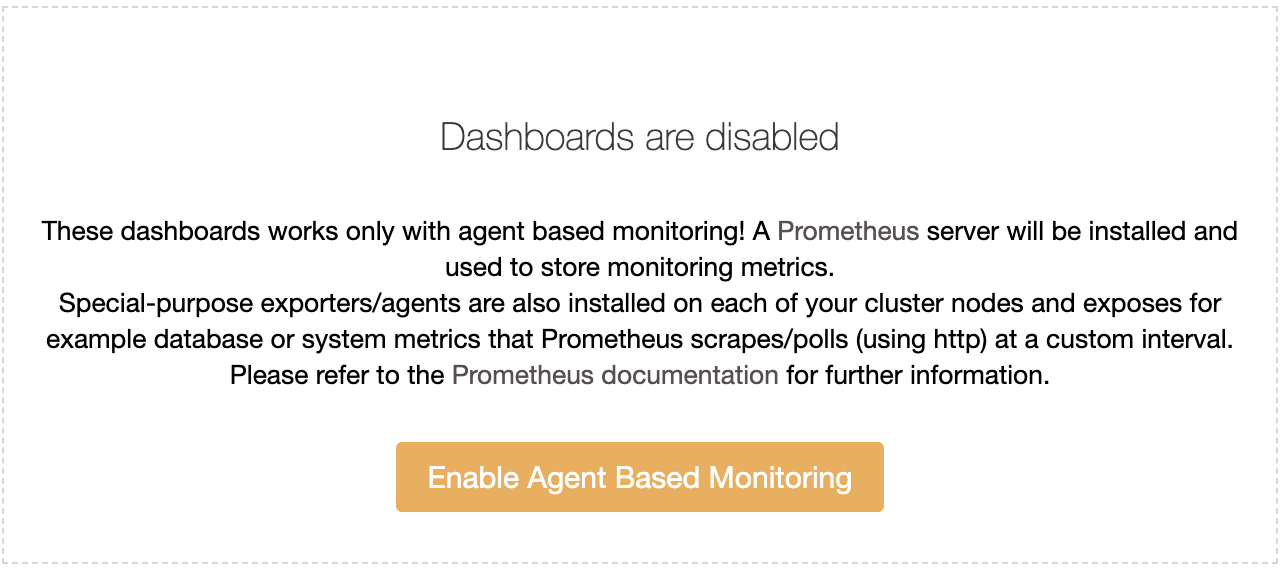
You just need to click agent-based monitoring in the dashboard tab, it will install prometheus, and the exporter for database and the operating system. After installation, it will appear the monitoring tool in your dashboard as shown below
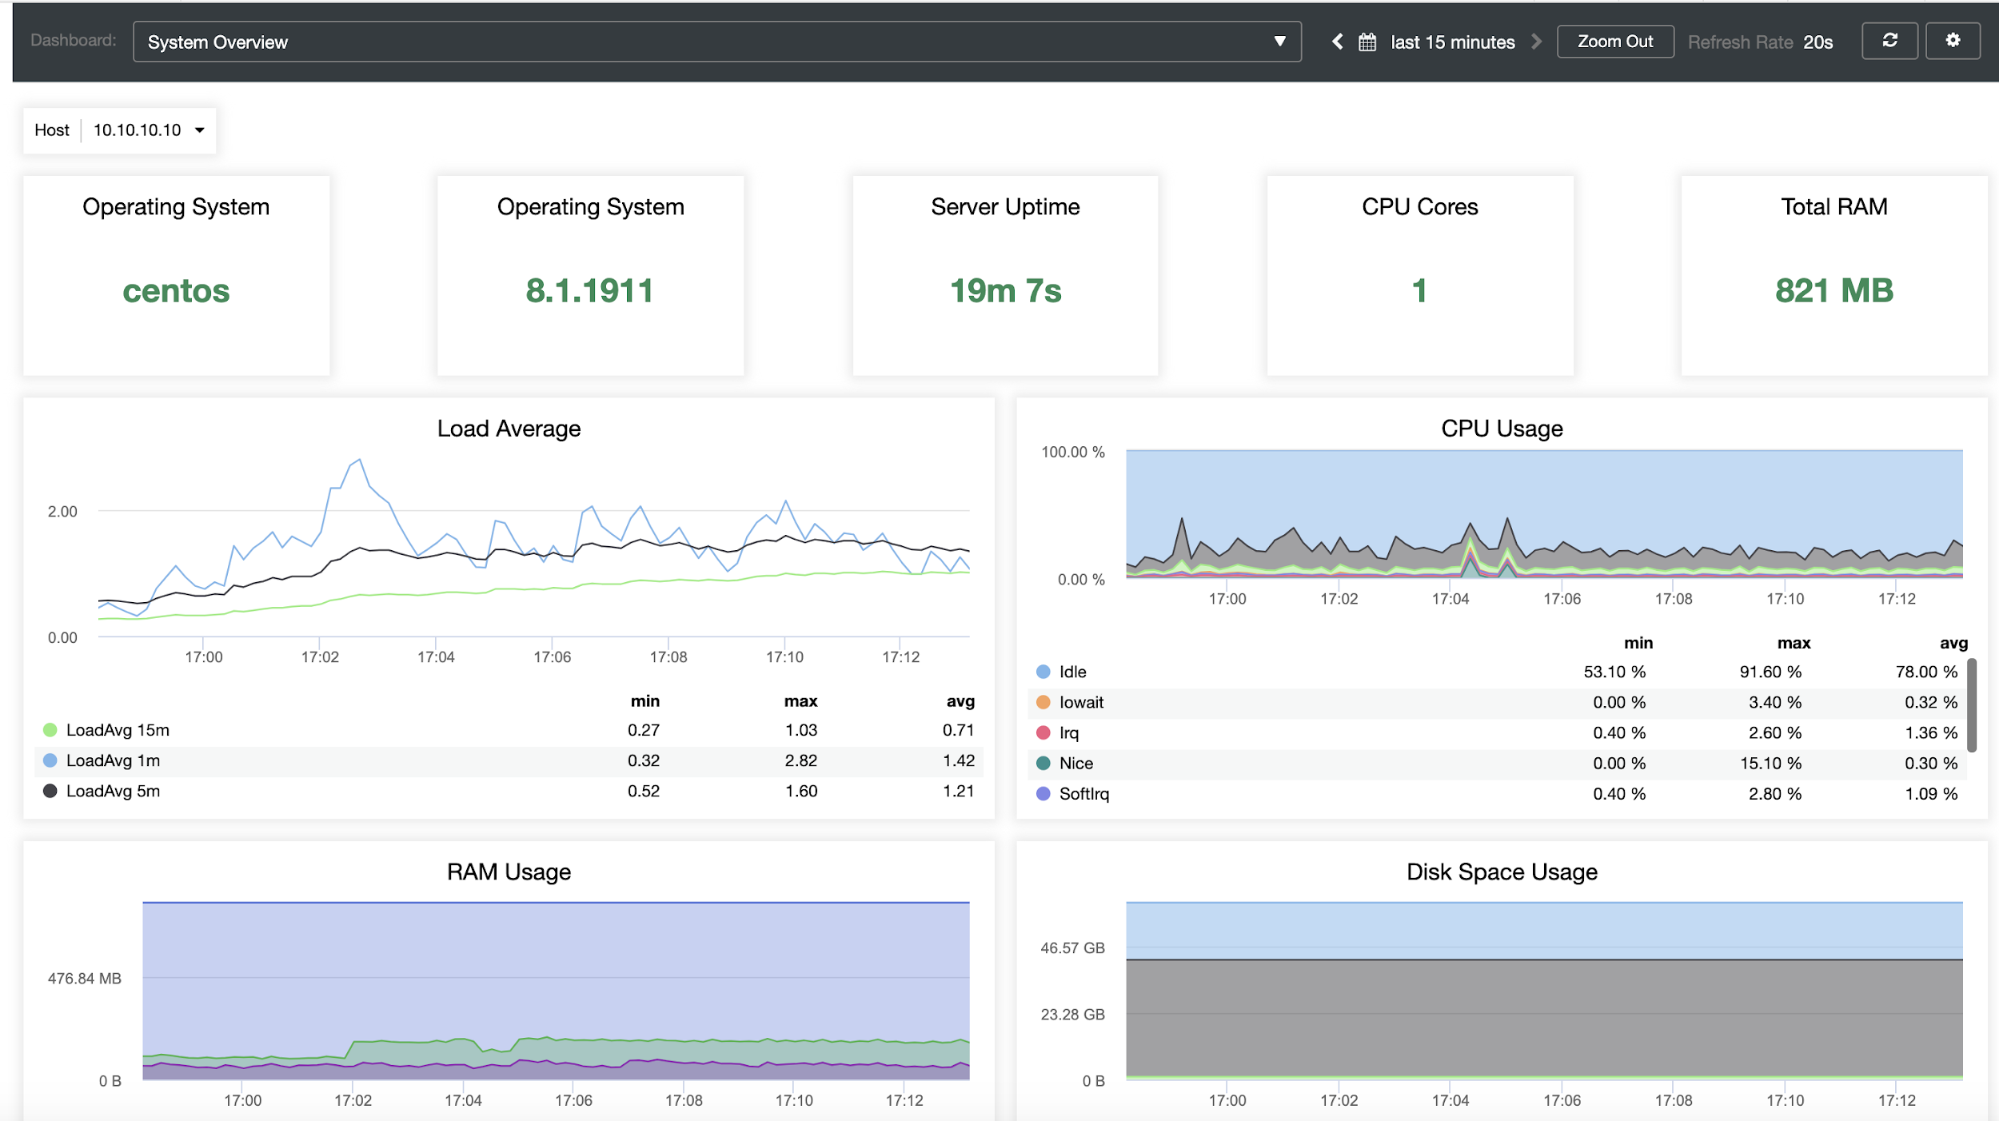
The System Overview will show you basic monitoring usage for operating systems such as CPU Usage, Disk Space Usage and Memory Usage. On the CPU Usage, you will see utilization for User, Idle, System, Iowait, while in the Memory Usage it is monitoring related to Total Memory, Available, and Used. Disk Space usage monitored the disk space utilization on each device. Beside the System Overview, there are also MySQL Server Overview which have information about database status and utilization as shown below.
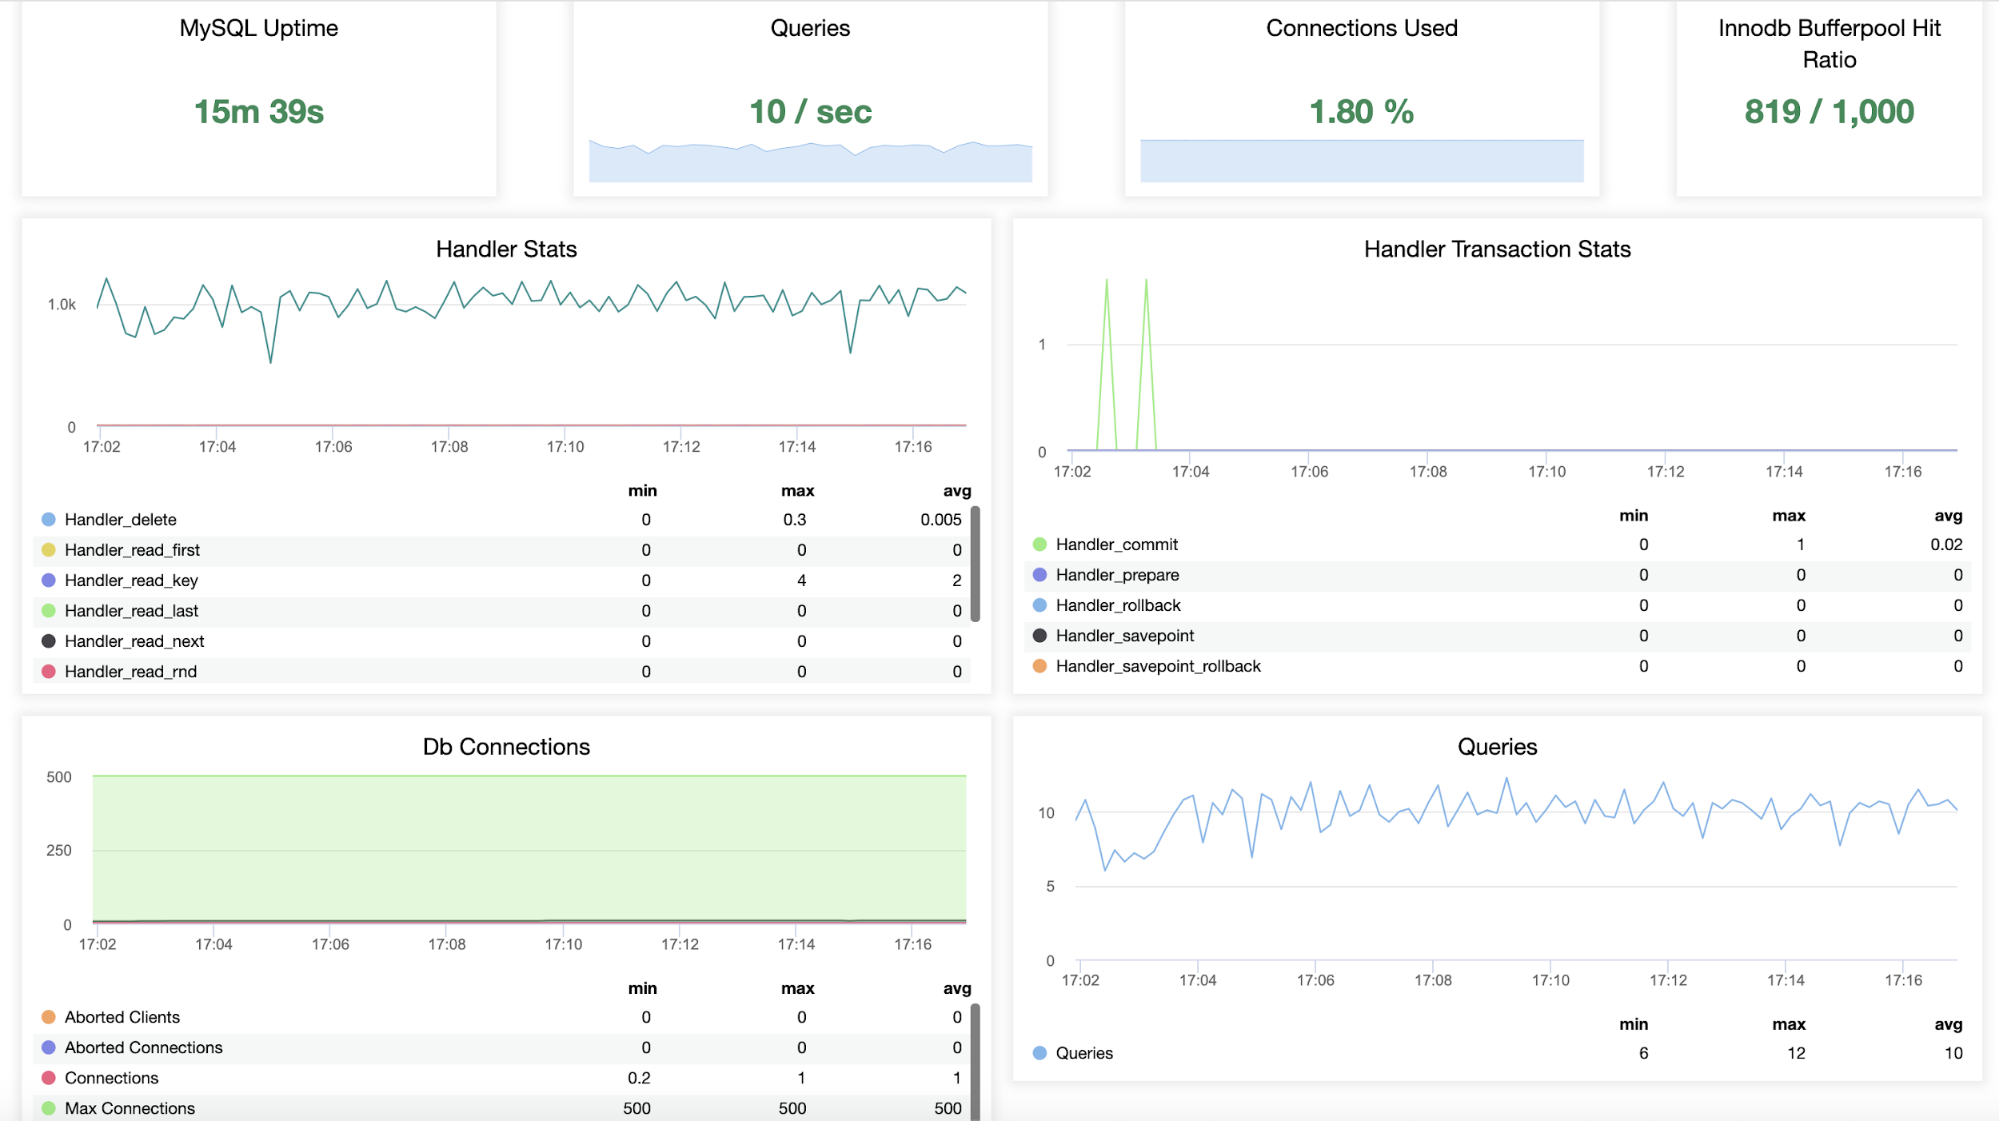
There is a lot of information shown in MySQL Server Overview such as MySQL Uptime, current running Queries, Connection Used, and Bufferpool Hit Ratio. There is a Handler Stats metric to show your current handler for read first, read last, read next, delete, update and insert. DB Connection monitors your current connection, from aborted connections, aborted clients, max connections, thread connected, to threads connected. MySQL InnoDB Metrics show you current InnoDB status information as shown below :

You can see the InnoDB BufferPool Activity from Created, Read, and Written. InnoDB Bufferpool Hit Ratio, and InnoDB Bufferpool Usage from Dirty page, Read from Disk, Bufferpool Size.
Worse Case Scenario
The worst case scenario if DBA does not implemented the Database Monitoring Tool yet, as a SysAdmin, you can go through command line with some utility tools in the Operating System, as shown below :
- CPU Utilization
- You can use top or htop command to see the running process in the operating system that eats your CPU.
- Memory Utilization
- vmstat can help you check your memory utilization. Also, you can check your current memory usage using free command, it will show you the swap utilization (if it was used), total memory, used memory, and free memory.
- Disk Utilization
- iostat command can show you the read and write rate to the disk per second. While iotop shows you the percentage of IO Utilization within the services.
If you have access to the database with superuser privileges, you can do the basic monitoring for database with below command :
- show [full] processlist, it will show you the thread with running operation in database, user connected, ip address, database, and Time.
- show engine innodb status G, is a command to monitor your current InnoDB information from row operations, buffer pool and memory usage, IO thread usage, transaction and locks.
Conclusion
Having proper documentation for databases and monitoring tools is a must for a DBA. It will be useful and helpful for others, like the SysAdmins when they need to run an investigation while the DBA is unavailable.
SysAdmins also needs to understand a basic troubleshooting process that enables them to troubleshoot some issues and elaborate the root cause of issue when escalating it to the related party, ie. DBA.