blog
Monitoring Percona Server for MySQL – Key Metrics

In this blog post, we are going to look into some key metrics and status when monitoring a Percona Server for MySQL to help us fine-tune the MySQL server configuration for a long run. Just for the heads up, Percona Server has some monitoring metrics that are only available on this build. When comparing on version 8.0.20, the following 51 statuses are only available on Percona Server for MySQL, which are not available in the upstream Oracle’s MySQL Community Server:
- Binlog_snapshot_file
- Binlog_snapshot_position
- Binlog_snapshot_gtid_executed
- Com_create_compression_dictionary
- Com_drop_compression_dictionary
- Com_lock_tables_for_backup
- Com_show_client_statistics
- Com_show_index_statistics
- Com_show_table_statistics
- Com_show_thread_statistics
- Com_show_user_statistics
- Innodb_background_log_sync
- Innodb_buffer_pool_pages_LRU_flushed
- Innodb_buffer_pool_pages_made_not_young
- Innodb_buffer_pool_pages_made_young
- Innodb_buffer_pool_pages_old
- Innodb_checkpoint_age
- Innodb_ibuf_free_list
- Innodb_ibuf_segment_size
- Innodb_lsn_current
- Innodb_lsn_flushed
- Innodb_lsn_last_checkpoint
- Innodb_master_thread_active_loops
- Innodb_master_thread_idle_loops
- Innodb_max_trx_id
- Innodb_oldest_view_low_limit_trx_id
- Innodb_pages0_read
- Innodb_purge_trx_id
- Innodb_purge_undo_no
- Innodb_secondary_index_triggered_cluster_reads
- Innodb_secondary_index_triggered_cluster_reads_avoided
- Innodb_buffered_aio_submitted
- Innodb_scan_pages_contiguous
- Innodb_scan_pages_disjointed
- Innodb_scan_pages_total_seek_distance
- Innodb_scan_data_size
- Innodb_scan_deleted_recs_size
- Innodb_scrub_log
- Innodb_scrub_background_page_reorganizations
- Innodb_scrub_background_page_splits
- Innodb_scrub_background_page_split_failures_underflow
- Innodb_scrub_background_page_split_failures_out_of_filespace
- Innodb_scrub_background_page_split_failures_missing_index
- Innodb_scrub_background_page_split_failures_unknown
- Innodb_encryption_n_merge_blocks_encrypted
- Innodb_encryption_n_merge_blocks_decrypted
- Innodb_encryption_n_rowlog_blocks_encrypted
- Innodb_encryption_n_rowlog_blocks_decrypted
- Innodb_encryption_redo_key_version
- Threadpool_idle_threads
- Threadpool_threads
Check out the Extended InnoDB Status page for more information on each of the monitoring metrics above. Note that some extra status like thread pool is only available in Oracle’s MySQL Enterprise. Check out the Percona Server for MySQL 8.0 documentation to see all of the improvements specifically for this build over Oracle’s MySQL Community Server 8.0.
To retrieve the MySQL global status, simply use one of the following statements:
mysql> SHOW GLOBAL STATUS;
mysql> SHOW GLOBAL STATUS LIKE '%connect%'; -- list all status that contain string "connect"
mysql> SELECT * FROM performance_schema.global_status;
mysql> SELECT * FROM performance_schema.global_status WHERE VARIABLE_NAME LIKE '%connect%'; -- list all status that contain string "connect"
Database State and Overview
We will start with the uptime status, the number of seconds that the server has been up.
All com_* status are the statement counter variables that indicate the number of times each statement has been executed. There is one status variable for each type of statement. For example, com_delete and com_update count DELETE and UPDATE statements, respectively. The com_delete_multi and com_update_multi are similar but apply to DELETE and UPDATE statements that use multiple-table syntax.
To list out all the running process by MySQL, just run one of the following statements:
mysql> SHOW PROCESSLIST;
mysql> SHOW FULL PROCESSLIST;
mysql> SELECT * FROM information_schema.processlist;
mysql> SELECT * FROM information_schema.processlist WHERE command <> 'sleep'; -- list all active processes except 'sleep' command.
Connections and Threads
Current Connections
The ratio of currently open connections (connection thread). If the ratio is high, it indicates there are many concurrent connections to the MySQL server and could lead to a “Too many connections” error. To get the connection percentage:
Current connections(%) = (threads_connected / max_connections) x 100A good value should be 80% and below. Try increasing the max_connections variable or inspect the connections using SHOW FULL PROCESSLIST. When “Too many connections” errors happen, the MySQL database server will become unavailable for the non-super user until some connections are freed up. Note that increasing the max_connections variable could also potentially increase MySQL’s memory footprint.
Maximum Connections Ever Seen
The ratio of maximum connections to the MySQL server that was ever seen. A simple calculation would be:
Max connections ever seen(%) = (max_used_connections / max_connections) x 100The good value should be below 80%. If the ratio is high, it indicates that MySQL has once reached a high number of connections that would lead to ‘too many connections’ error. Inspect the current connections ratio to see if it is indeed staying low consistently. Otherwise, increase the max_connections variable. Check the max_used_connections_time status to indicate when the max_used_connections status reached its current value.
Threads Cache Hit Rate
The status of threads_created is the number of threads created to handle connections. If the threads_created is big, you may want to increase the thread_cache_size value. The cache hit/miss rate can be calculated as:
Threads cache hit rate (%) = (threads_created / connections) x 100It’s a fraction that gives an indication of thread cache hit rate. The closer less than 50%, the better. If your server sees hundreds of connections per second you should normally set thread_cache_size high enough so that most new connections use cached threads.
Query Performance
Full Table Scans
The ratio of full table scans, an operation that requires reading the entire contents of a table, rather than just selected portions using an index. This value is high if you are doing a lot of queries that require sorting of results or table scans. Generally, this suggests that tables are not properly indexed or that your queries are not written to take advantage of the indexes you have. To calculate the percentage of full table scans:
Full table scans (%) = (handler_read_rnd_next + handler_read_rnd) /
(handler_read_rnd_next + handler_read_rnd + handler_read_first + handler_read_next + handler_read_key + handler_read_prev)
x 100
The good value should be below 25%. Examine the MySQL slow query log output to find out the suboptimal queries.
Select Full Join
The status of select_full_join is the number of joins that perform table scans because they do not use indexes. If this value is not 0, you should carefully check the indexes of your tables.
Select Range Check
The status of select_range_check is the number of joins without keys that check key usage after each row. If this is not 0, you should carefully check the indexes of your tables.
Sort Passes
The ratio of merge passes that the sort algorithm has had to do. If this value is high, you should consider increasing the value of sort_buffer_size and read_rnd_buffer_size. A simple ratio calculation is:
Sort passes = sort_merge_passes / (sort_scan + sort_range)A ratio value lower than 3 should be a good value. If you want to increase the sort_buffer_size or read_rnd_buffer_size, try to increase in small increments until you reach the acceptable ratio.
InnoDB Performance
InnoDB Buffer Pool Hit Rate
The ratio of how often your pages are retrieved from memory instead of disk. If the value is low during early MySQL startup, please allow some time for the buffer pool to warm up. To get the buffer pool hit rate, use the SHOW ENGINE INNODB STATUS statement:
mysql> SHOW ENGINE INNODB STATUSG
...
----------------------
BUFFER POOL AND MEMORY
----------------------
...
Buffer pool hit rate 1000 / 1000, young-making rate 0 / 1000 not 0 / 1000
...The best value is 1000 / 10000 hit rate. For a lower value, for example, the hit rate of 986 / 1000 indicates that out of 1000 page reads, it was able to read pages in RAM 986 times. The remaining 14 times, MySQL had to read the pages from disk. Simply said, 1000 / 1000 is the best value that we are trying to achieve here, which means the frequently-accessed data fits fully in RAM.
Increasing the innodb_buffer_pool_size variable will help a lot to accommodate more room for MySQL to work on. However, ensure you have sufficient RAM resources beforehand. Removing redundant indexes could also help. If you have multiple buffer pool instances, make sure the hit rate for every instance reaches 1000 / 1000.
InnoDB Dirty Pages
The ratio of how often InnoDB needs to be flushed. During the write-heavy load, it is normal that this percentage increases.
A simple calculation would be:
InnoDB dirty pages(%) = (innodb_buffer_pool_pages_dirty / innodb_buffer_pool_pages_total) x 100A good value should be 75% and below. If the percentage of dirty pages stays high for a long time, you may want to increase the buffer pool or get faster disks to avoid performance bottlenecks.
InnoDB Waits for Checkpoint
The ratio of how often InnoDB needs to read or create a page where no clean pages are available. Normally, writes to the InnoDB Buffer Pool happen in the background. However, if it is necessary to read or create a page and no clean pages are available, it is also necessary to wait for pages to be flushed first. The innodb_buffer_pool_wait_free counter counts how many times this has happened. To calculate the ratio of InnoDB waits for checkpointing, we can use the following calculation:
InnoDB waits for checkpoint = innodb_buffer_pool_wait_free / innodb_buffer_pool_write_requestsIf innodb_buffer_pool_wait_free is greater than 0, it is a strong indicator that the InnoDB buffer pool is too small, and operations had to wait on a checkpoint. Increasing the innodb_buffer_pool_size will usually decrease the innodb_buffer_pool_wait_free, as well as this ratio. A good ratio value should stay below 1.
InnoDB Waits for Redolog
The ratio of redo log contention. Check innodb_log_waits and if it continues to increase then increase the innodb_log_buffer_size. It can also mean that the disks are too slow and cannot sustain the disk IO, perhaps due to peak write load. Use the following calculation to calculate the redo log waiting ratio:
InnoDB waits for redolog = innodb_log_waits / innodb_log_writesA good ratio value should be below 1. Otherwise, increase the innodb_log_buffer_size.
Tables
Table Cache Usage
The ratio of table cache usage for all threads. A simple calculation would be:
Table cache usage(%) = (opened_tables / table_open_cache) x 100The good value should be less than 80%. Increase the table_open_cache variable until the percentage reaches a good value.
Table Cache Hit Ratio
The ratio of table cache hit usage. A simple calculation would be:
Table cache hit ratio(%) = (open_tables / opened_tables) x 100A good hit ratio value should be 90% and above. Otherwise, increase the table_open_cache variable until the hit ratio reaches a good value.
Metrics Monitoring with ClusterControl
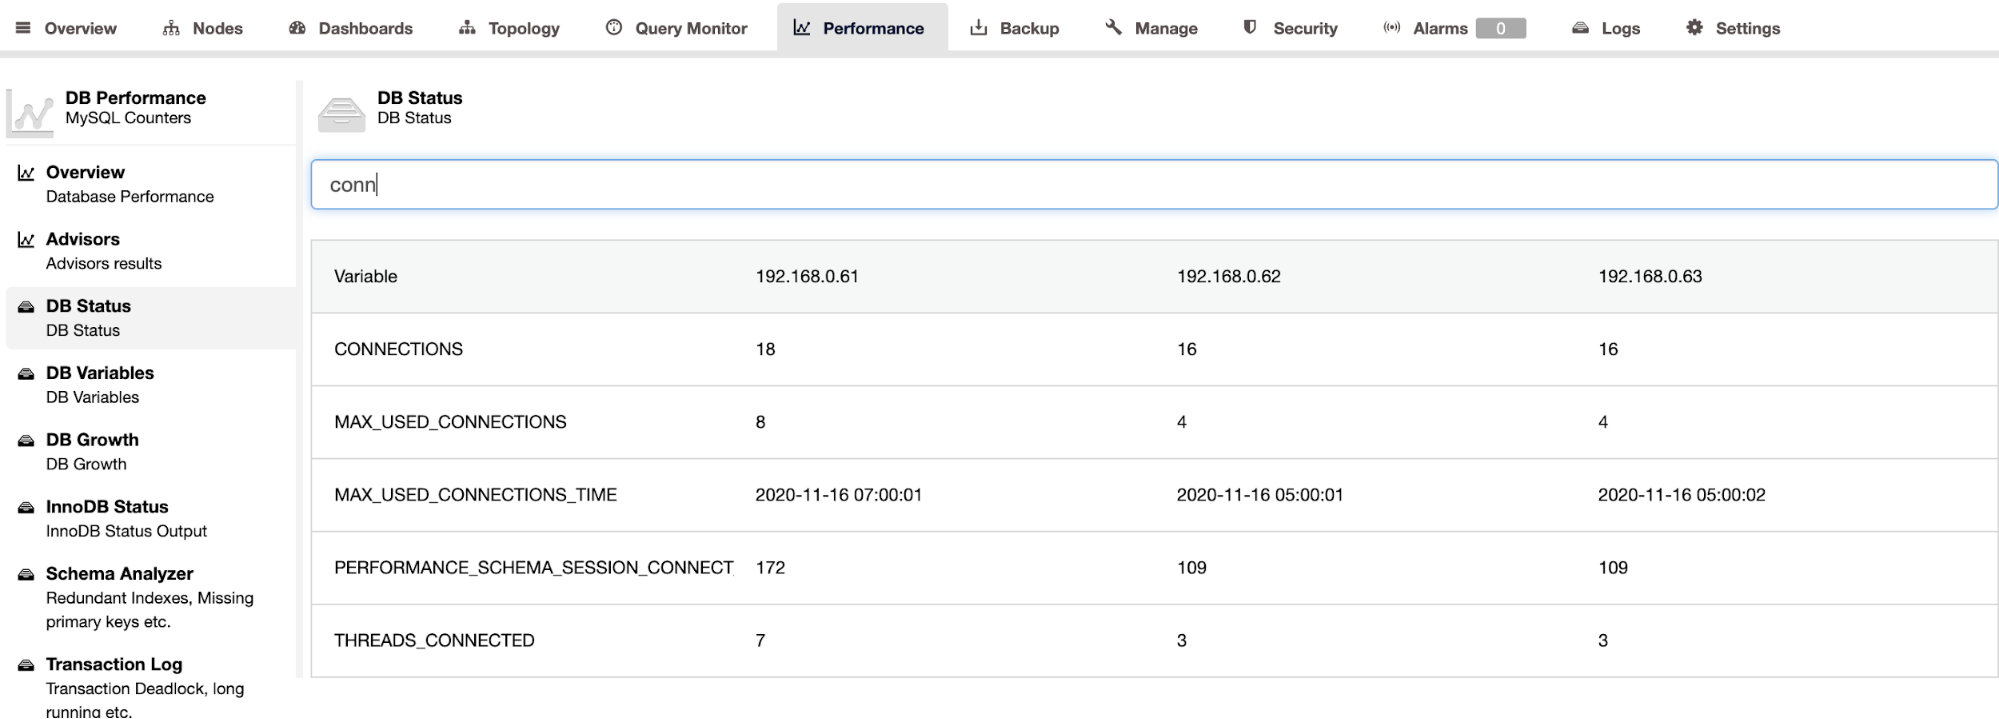
ClusterControl supports Percona Server for MySQL and it provides an aggregated view of all nodes in a cluster under the ClusterControl -> Performance -> DB Status page. This provides a centralized approach to look up for all the status on all hosts with the ability to filter the status, as shown in the following screenshot:
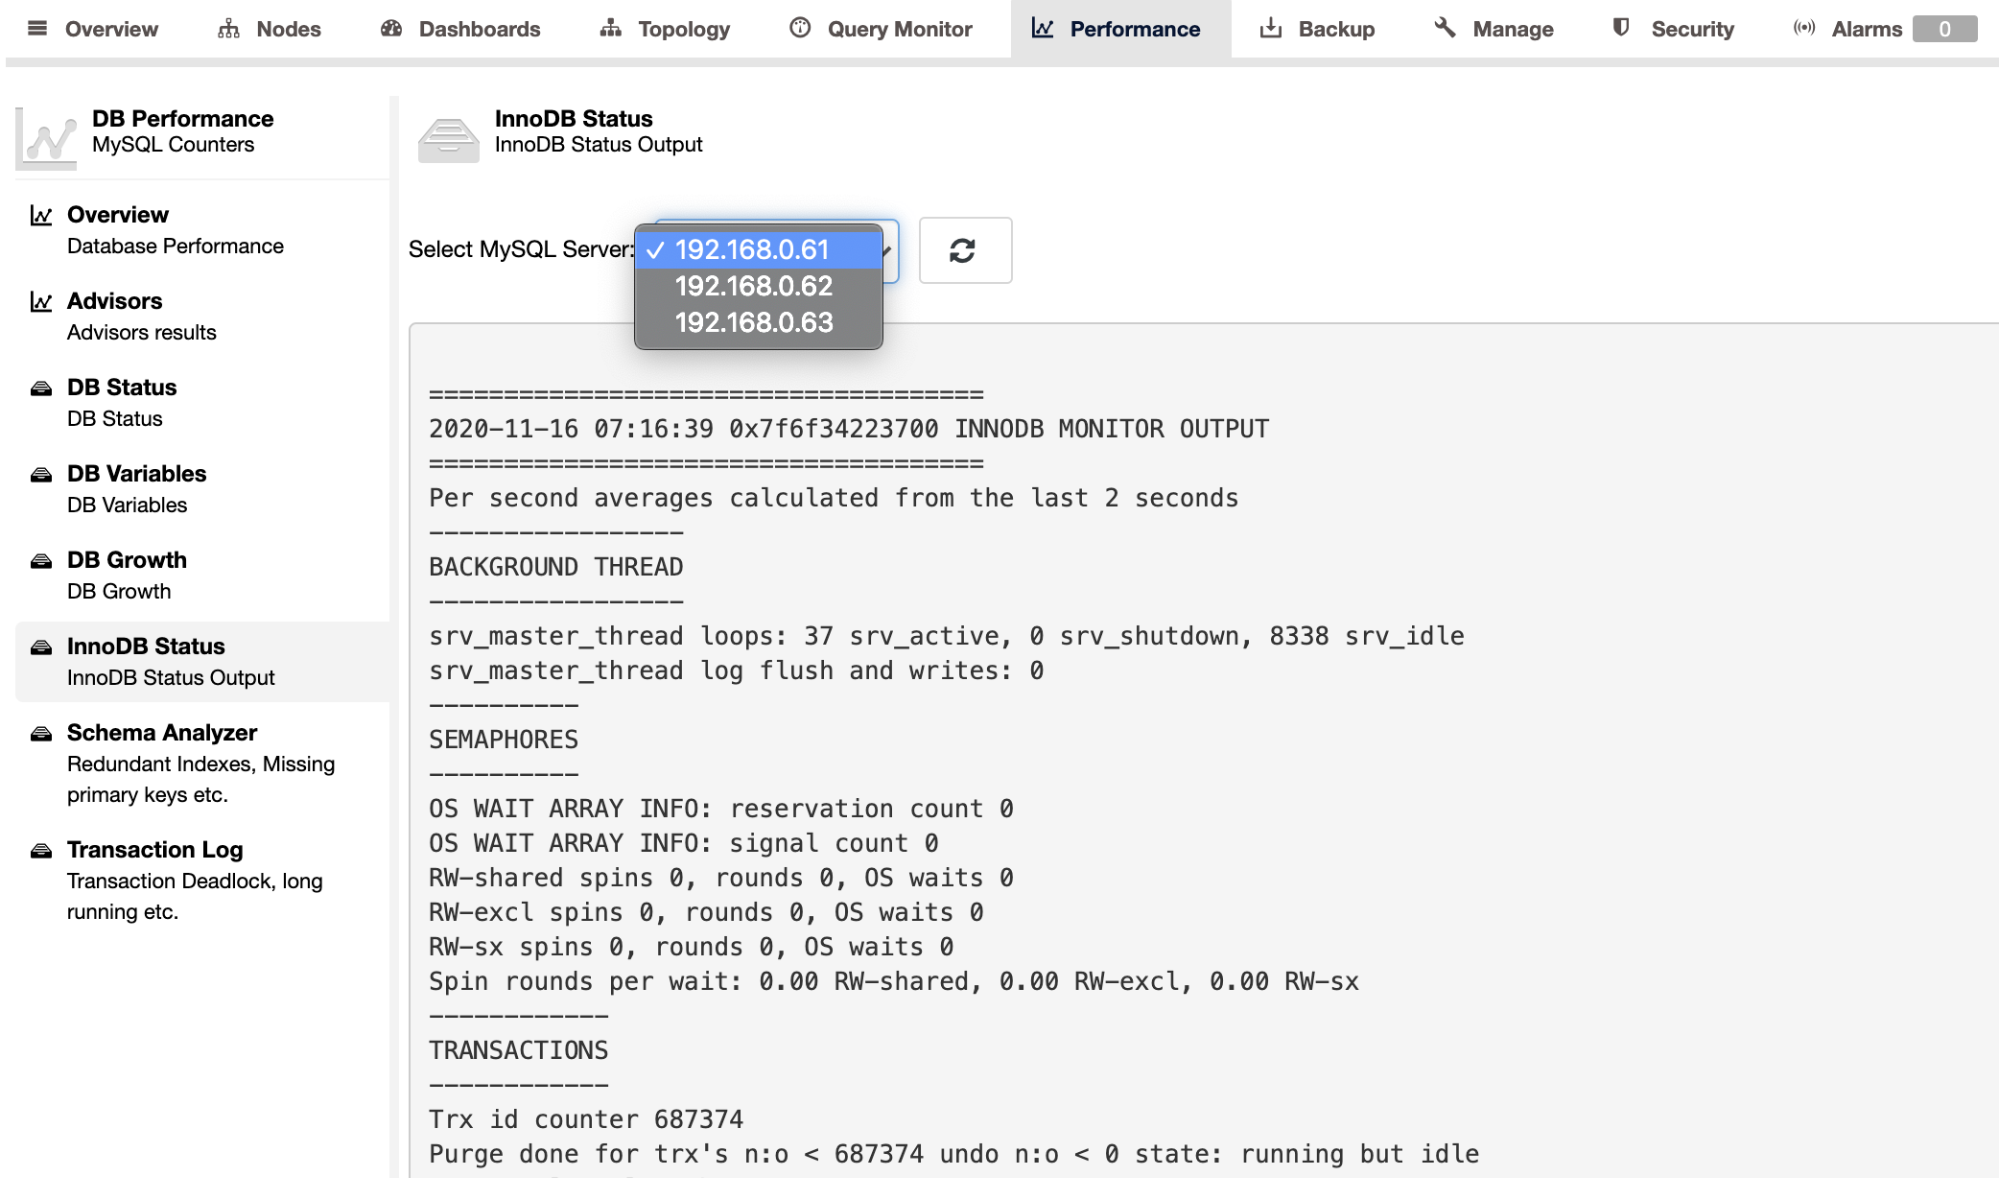
To retrieve the SHOW ENGINE INNODB STATUS output for an individual server, you may use the Performance -> InnoDB Status page, as shown below:
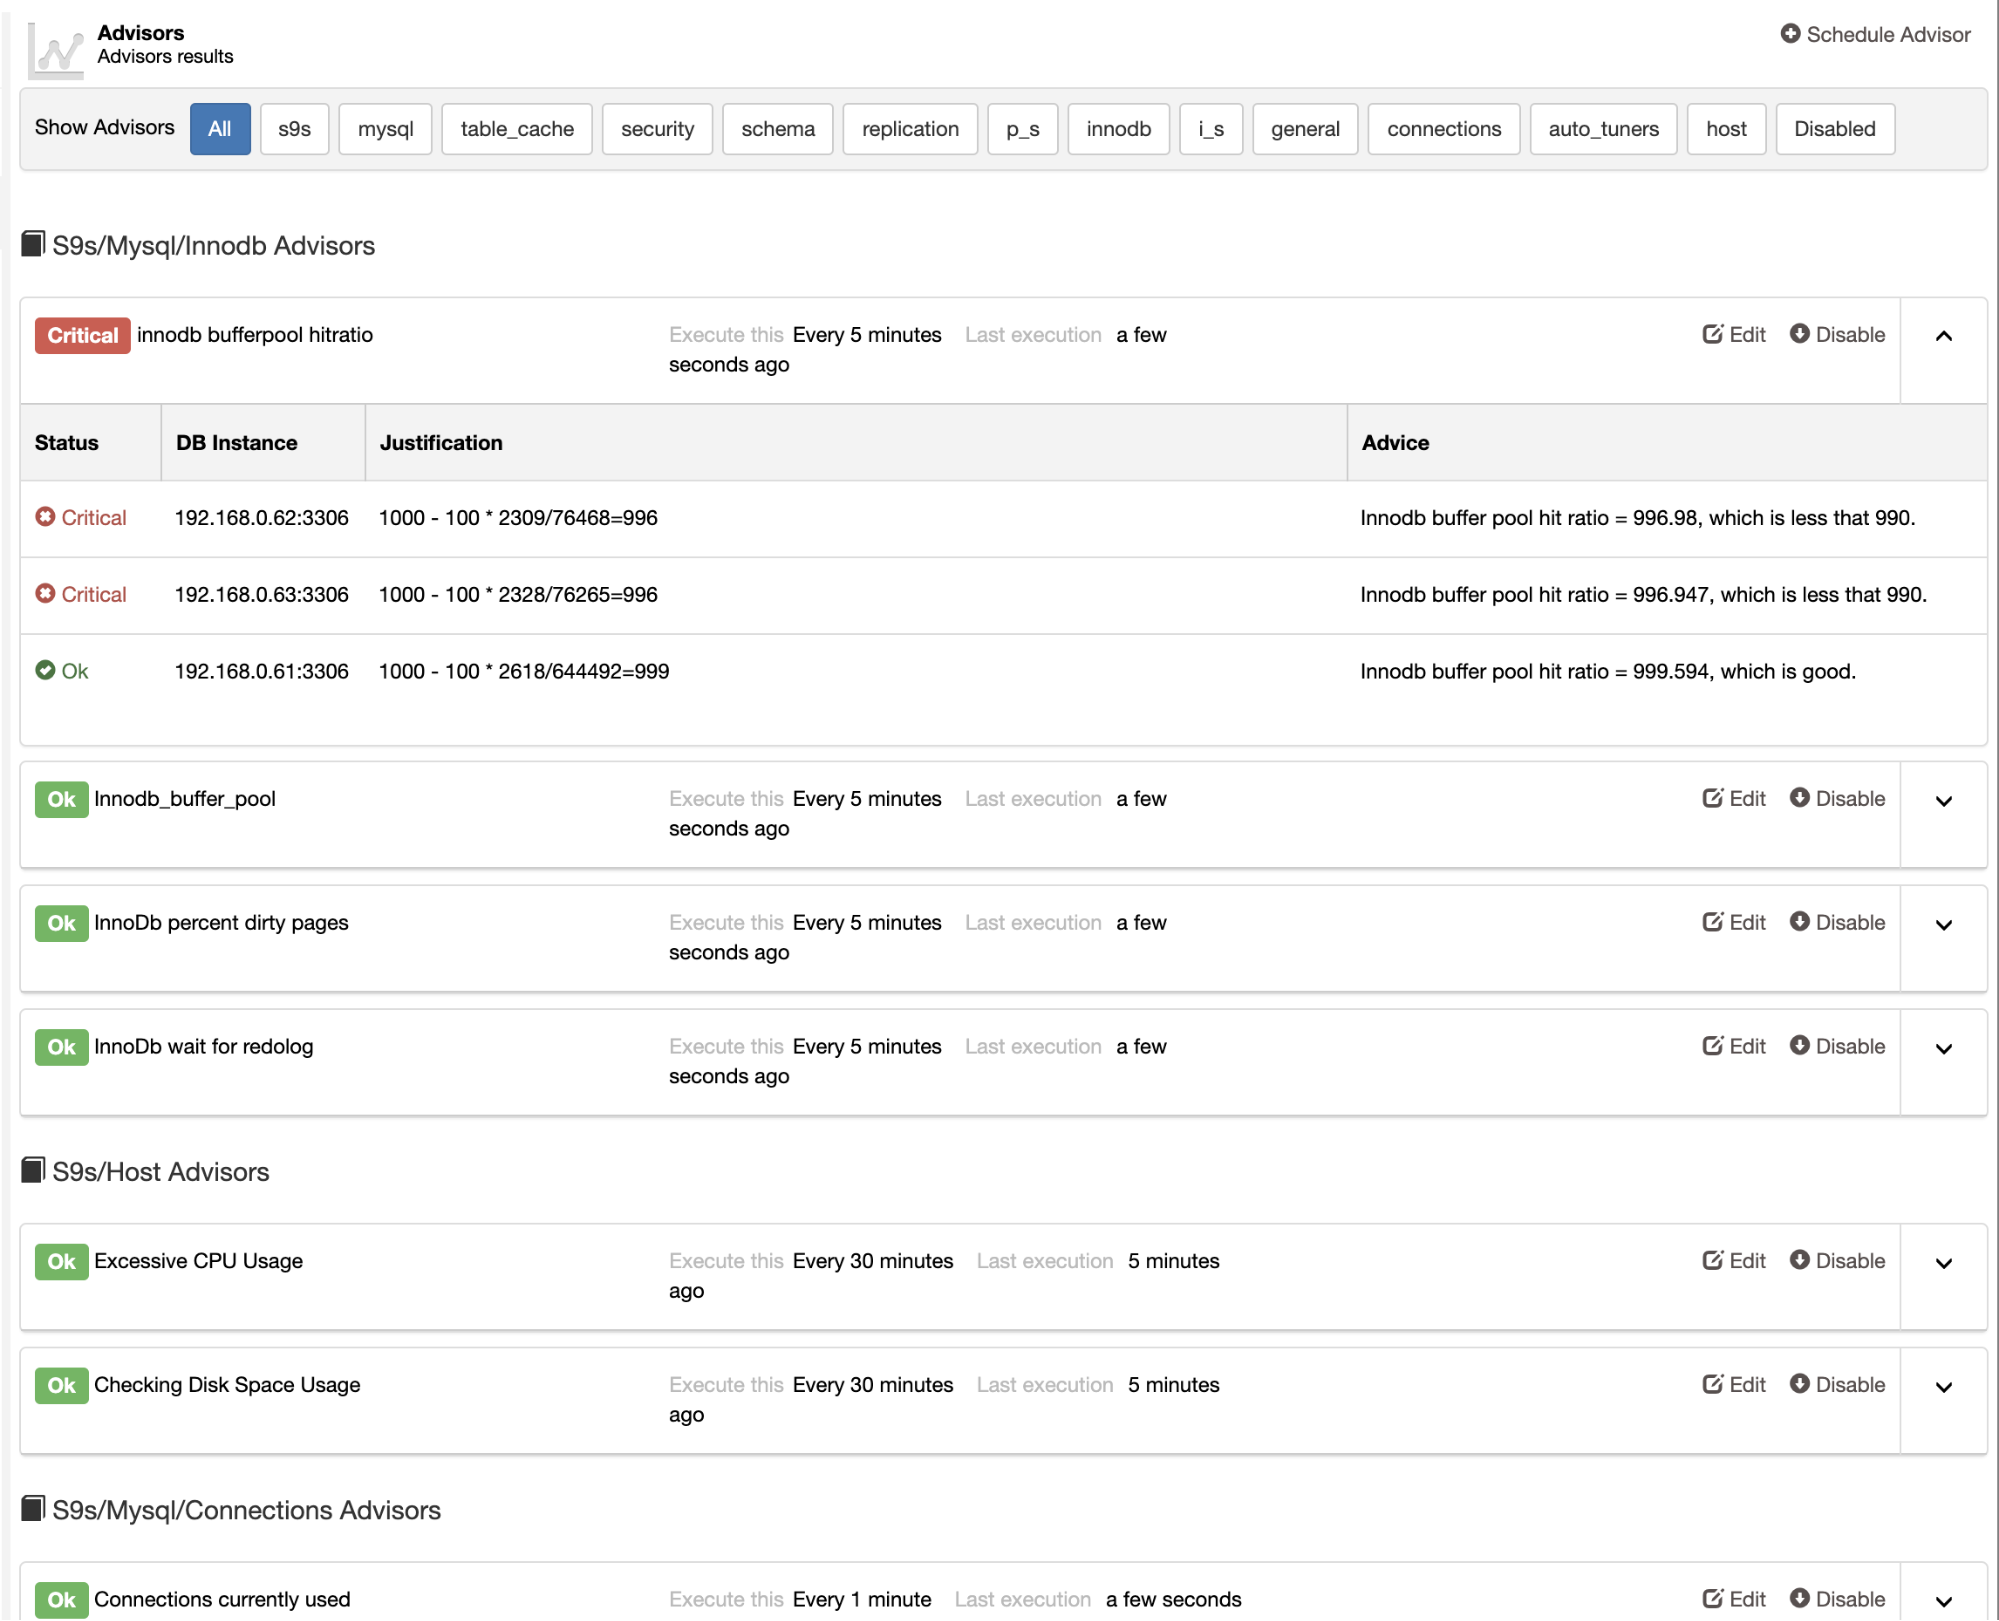
ClusterControl also provides built-in advisors that you can use to track your database performance. This feature is accessible under ClusterControl -> Performance -> Advisors:
Advisors are basically mini-programs executed by ClusterControl in a scheduled timing like cron jobs. You can schedule an advisor by clicking on the “Schedule Advisor” button, and choose any existing advisor from the Developer Studio object tree:
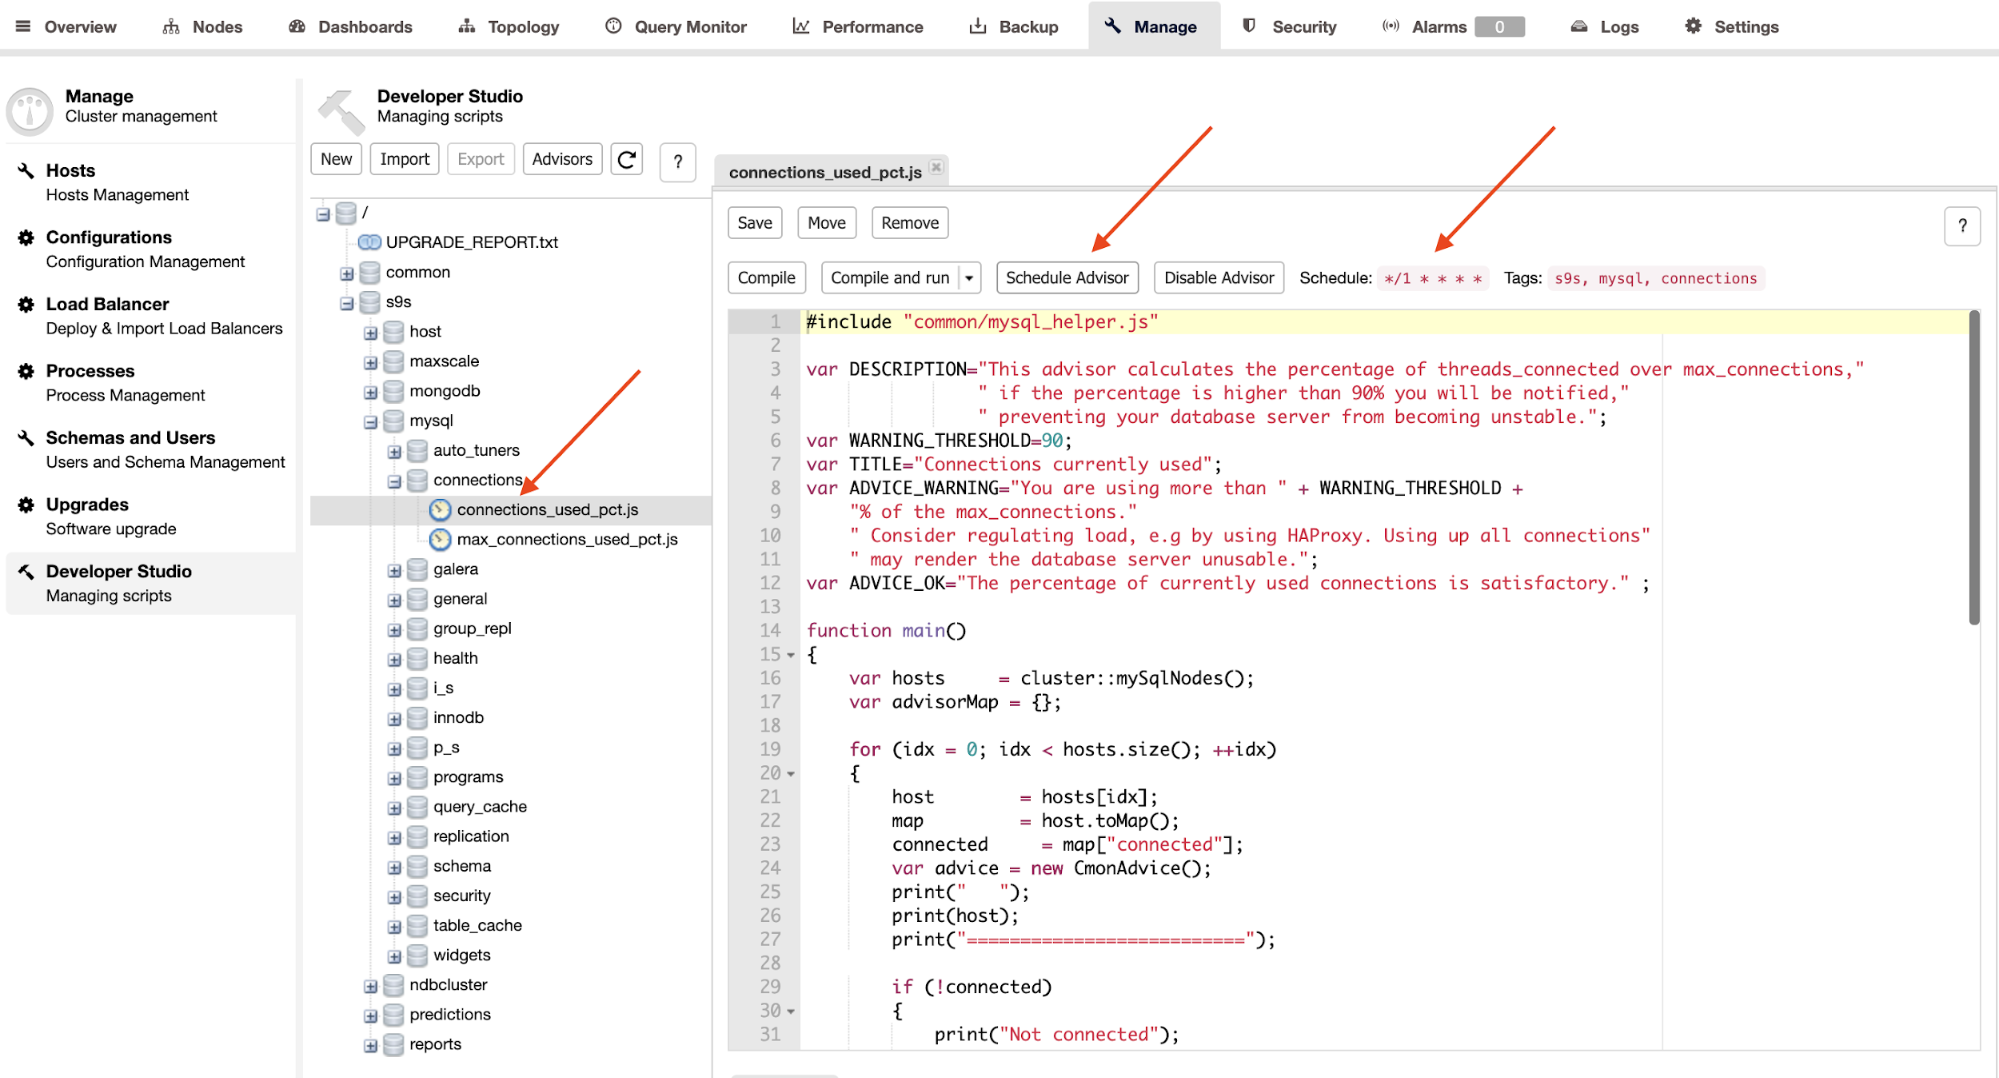
Click on the “Schedule Advisor” button to set the scheduling, argument to pass and also the advisor’s tags. You can also compile the advisor to see the output immediately by clicking on the “Compile and run” button, where you should see the following output under the “Messages” underneath it:
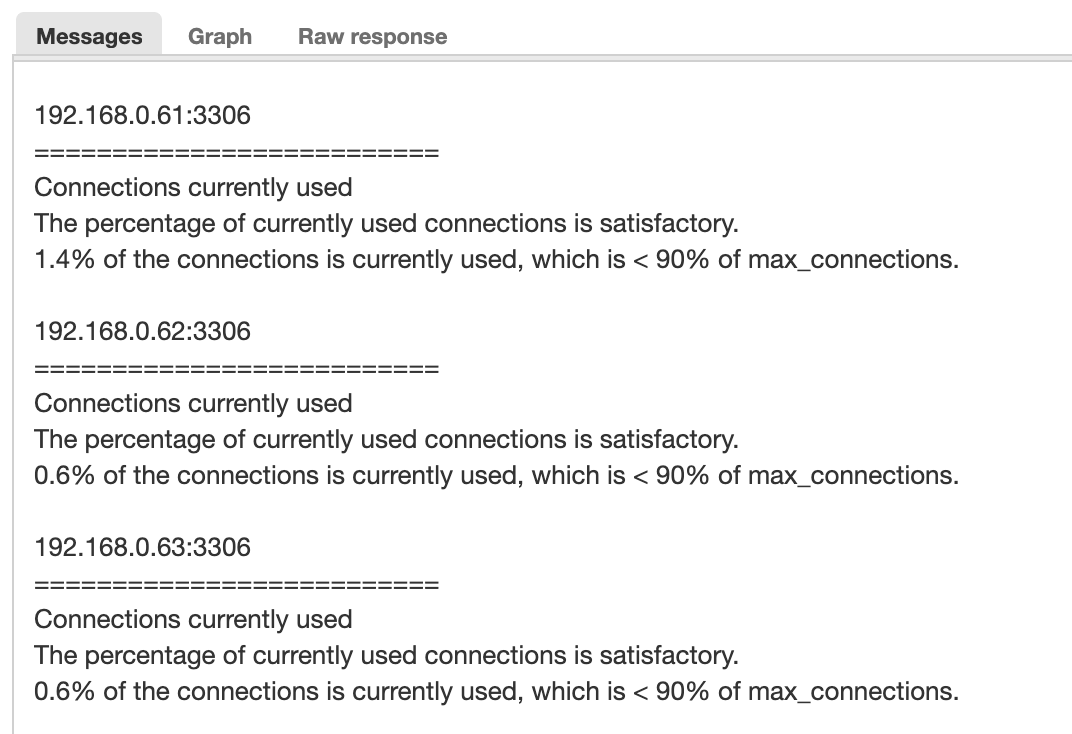
You may create your own advisor by referring to this Developer Guide, written in ClusterControl Domain Specific Language (very similar to Javascript), or customize an existing advisor to suit your monitoring policies. In short, ClusterControl monitoring duty can be extended with unlimited possibilities through ClusterControl Advisors.


