blog
Monitoring Percona Server for MongoDB – Key Metrics

When running critical database services in production, we need to know and monitor the database. You need to understand the key metrics in the database that you are using. For example, when you run MongoDB with a WiredTiger storage engine, you need to know connections, authentication, operations, replication lag, page faults, locking, etc.
In this blog, we will explain some key metrics that are used to monitor Percona Server for MongoDB.
Database Connections
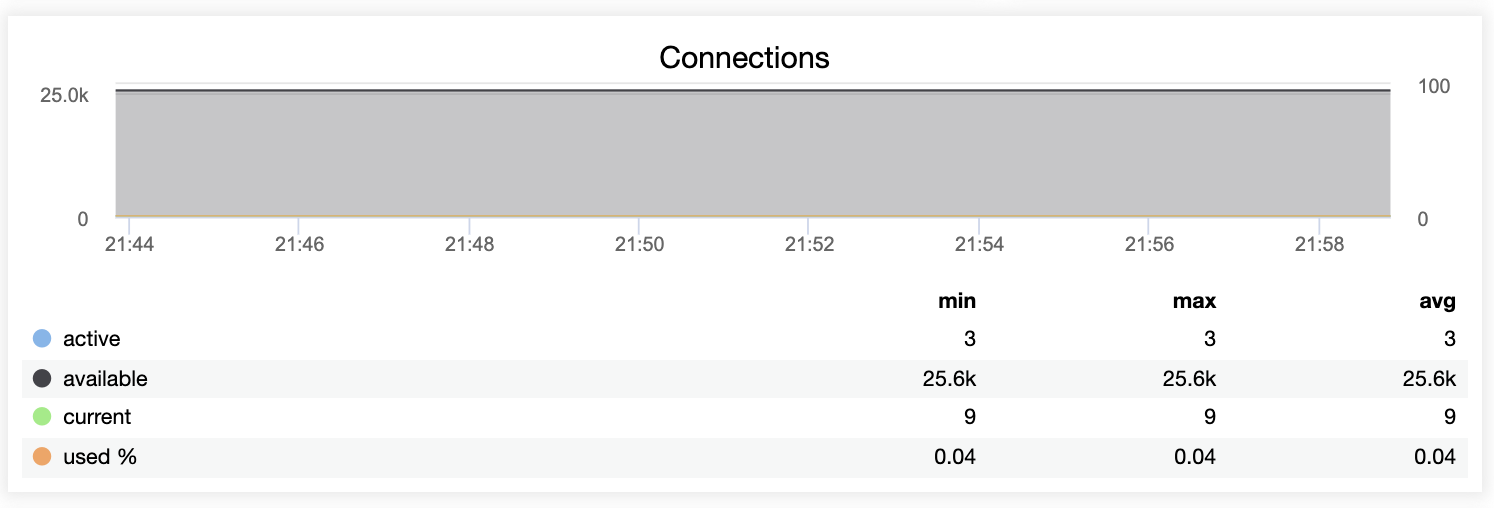
Database connections is one of important key metrics in any database. It monitors your current connections/threads from applications to the database. You can check current connections through the below command:
> db.serverStatus().connectionsIt provides an idea of how much your applications are accessing the database. A sudden spike in the number of connections can cause problems to your database servers problem. Is it expected or not?.
ClusterControl provides information related to the connections as shown below:
Command Operations
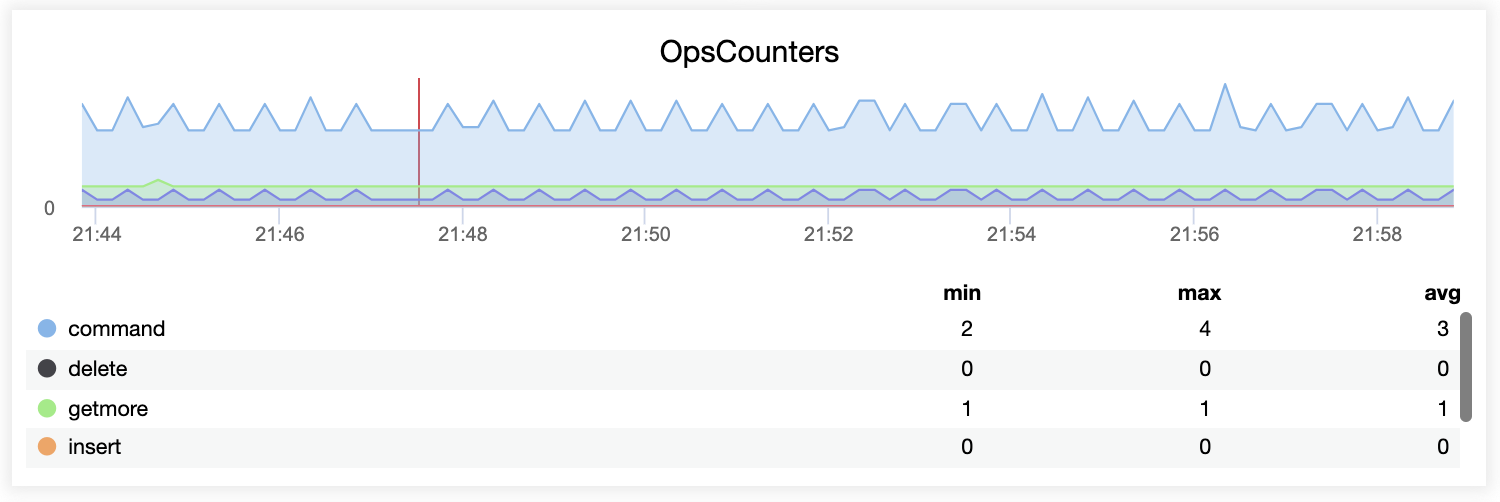
The command operations metrics monitor your current operations, either insert, update, delete, or select. You can monitor current command operations by executing the below command:
>db.serverStatus().opcountersFrom the command operations, you really can see your application workload, is it heavy write or read. From this standpoint, you can make some decisions, e.g., if you have heavy read traffic, you may want to scale the secondary nodes to distribute the read queries.
Monitoring command operations in ClusterControl is straightforward, you just need to enable Agent Based Monitoring to see the OpsCounter metrics in the MongoDB Server dashboard as shown below:
ReplicaSet Lags
When you run ReplicaSet or ShardCluster architecture, one important key metric is the replication lag. Replication lag occurs when secondary nodes can not catch up with the data being written to the primary node. The reasons for this may vary from network latency, disk throughput, slow queries, etc.
You can check current replication lag information by running the below command on the primary node:
> rs.printSlaveReplicationInfo() The lag information metrics is in seconds, so on heavy concurrent connections, it may lag by a few seconds on secondary nodes since the replication in mongodb is asynchronous.
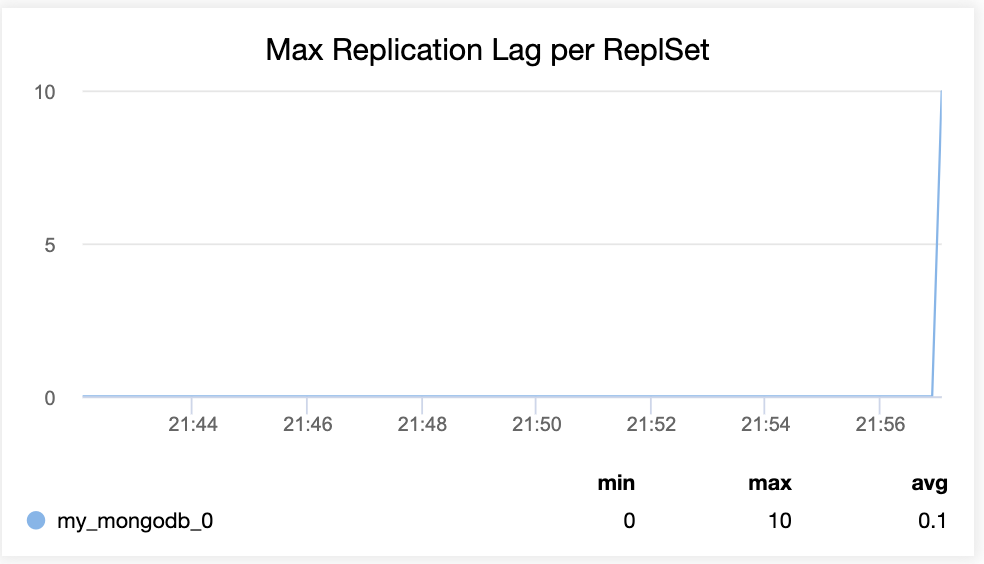
In ClusterControl, the metrics Max Replication Lag can be found in the MongoDB Replicaset monitoring dashboard.
Page Faults
Page Faults mostly occur in high concurrent and high load applications. Page Faults happen when the mongodb process wants to get the data but it is not available in the memory, then the mongodb server reads the data from disk.
To monitor the current state of page faults, you can use the below command:
>db.serverStatus().extra_info.page_faultsIt gives you the number of page faults. The value might increase during heavy load and the server might experience poor performance. You might want to check on the slow query log too.
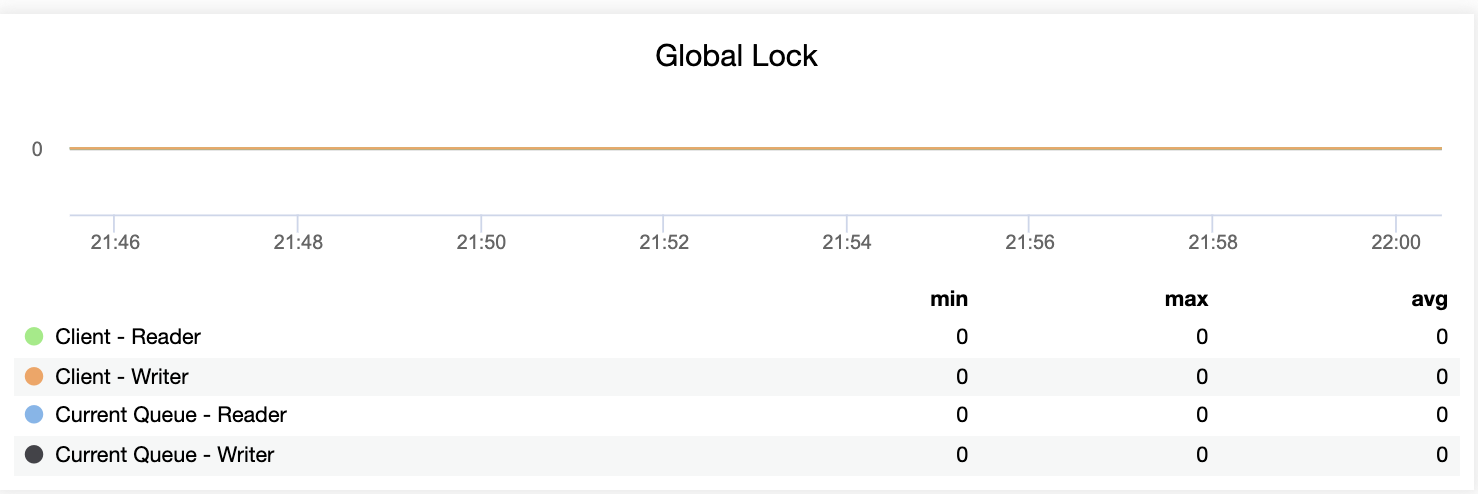
Locking
Locking is also an important metric in MongoDB, it usually happens in high load applications with multiple transactions on the same dataset. Locking can cause serious performance issues.
You can check current locking operations in the database using below command:
>db.currentOp()When we run db.currentOp() command, there is some information related to locking. ClusterControl monitors for Global Lock in its MongoDB dashboard as shown below:
Conclusion
These are some of the important key metrics to monitor in Percona Server for MongoDB. They provide a real time view of what is going on in the server and can uncover any anomalies that you can take action upon. ClusterControl provides some dashboards which give you visibility of your MongoDB databases.


