blog
How to Monitor Your Database Servers Using ClusterControl CLI

How would you like to merge “top” process for all your 5 database nodes and sort by CPU usage with just a one-liner command? Yeah, you read it right! How about interactive graphs display in the terminal interface? We introduced the CLI client for ClusterControl called s9s about a year ago, and it’s been a great complement to the web interface. It’s also open source..
In this blog post, we’ll show you how you can monitor your databases using your terminal and s9s CLI.
Introduction to s9s, The ClusterControl CLI
ClusterControl CLI (or s9s or s9s CLI), is an open source project and optional package introduced with ClusterControl version 1.4.1. It is a command line tool to interact, control and manage your database infrastructure using ClusterControl. The s9s command line project is open source and can be found on GitHub.
Starting from version 1.4.1, the installer script will automatically install the package (s9s-tools) on the ClusterControl node.
Some prerequisites. In order for you to run s9s-tools CLI, the following must be true:
- A running ClusterControl Controller (cmon).
- s9s client, install as a separate package.
- Port 9501 must be reachable by the s9s client.
Installing the s9s CLI is straightforward if you install it on the ClusterControl Controller host itself:$ rm
$ rm -Rf ~/.s9s
$ wget http://repo.severalnines.com/s9s-tools/install-s9s-tools.sh
$ ./install-s9s-tools.sh
You can install s9s-tools outside of the ClusterControl server (your workstation laptop or bastion host), as long as the ClusterControl Controller RPC (TLS) interface is exposed to the public network (default to 127.0.0.1:9501). You can find more details on how to configure this in the documentation page.
To verify if you can connect to ClusterControl RPC interface correctly, you should get the OK response when running the following command:
$ s9s cluster --ping
PING OK 2.000 ms
As a side note, also look at the limitations when using this tool.
Example Deployment
Our example deployment consists of 8 nodes across 3 clusters:
- PostgreSQL Streaming Replication – 1 master, 2 slaves
- MySQL Replication – 1 master, 1 slave
- MongoDB Replica Set – 1 primary, 2 secondary nodes
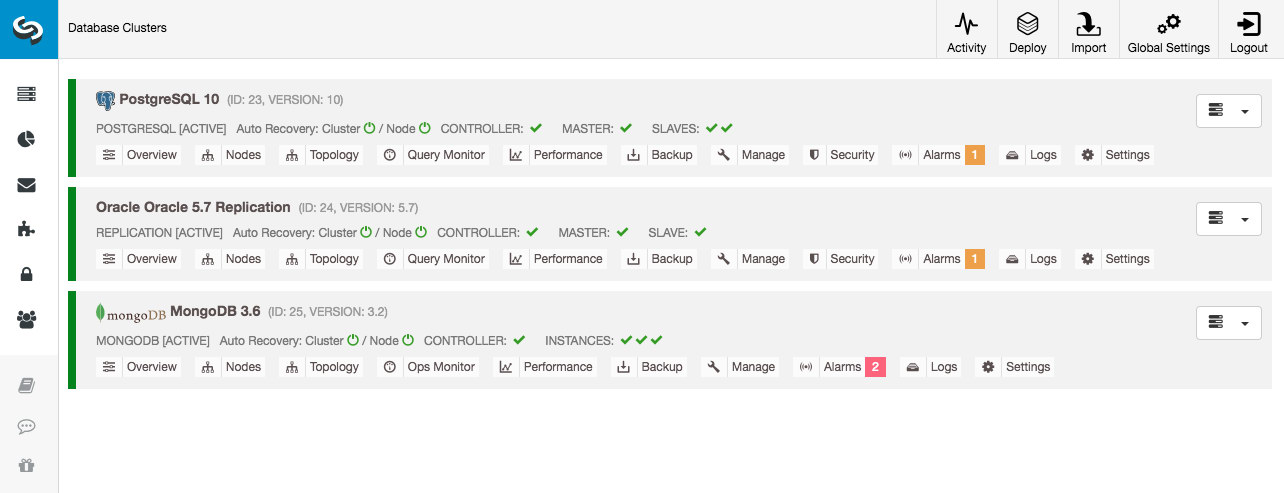
All database clusters were deployed by ClusterControl by using “Deploy Database Cluster” deployment wizard and from the UI point-of-view, this is what we would see in the cluster dashboard:
Cluster Monitoring
We will start by listing out the clusters:
$ s9s cluster --list --long
ID STATE   TYPE              OWNER  GROUP  NAME                   COMMENT
23 STARTED postgresql_single system admins PostgreSQL 10          All nodes are operational.
24 STARTED replication       system admins Oracle 5.7 Replication All nodes are operational.
25 STARTED mongodb           system admins MongoDB 3.6            All nodes are operational.
We see the same clusters as the UI. We can get more details on the particular cluster by using the –stat flag. Multiple clusters and nodes can also be monitored this way, the command line options can even use wildcards in the node and cluster names:
$ s9s cluster --stat *Replication
Oracle 5.7 Replication                                                                                                                                                                                               Name: Oracle 5.7 Replication              Owner: system/admins
      ID: 24                                  State: STARTED
    Type: REPLICATION                        Vendor: oracle 5.7
  Status: All nodes are operational.
  Alarms:  0 crit   1 warn
    Jobs:  0 abort  0 defnd  0 dequd  0 faild  7 finsd  0 runng
  Config: '/etc/cmon.d/cmon_24.cnf'
 LogFile: '/var/log/cmon_24.log'

                                                                                HOSTNAME    CPU   MEMORY   SWAP    DISK       NICs
                                                                                10.0.0.104 1  6% 992M 120M 0B 0B 19G 13G   10K/s 54K/s
                                                                                10.0.0.168 1  6% 992M 116M 0B 0B 19G 13G   11K/s 66K/s
                                                                                10.0.0.156 2 39% 3.6G 2.4G 0B 0B 19G 3.3G 338K/s 79K/s
The output above gives a summary of our MySQL replication together with the cluster status, state, vendor, configuration file and so on. Down the line, you can see the list of nodes that fall under this cluster ID with a summarized view of system resources for each host like number of CPUs, total memory, memory usage, swap disk and network interfaces. All information shown are retrieved from the CMON database, not directly from the actual nodes.
You can also get a summarized view of all databases on all clusters:
$ s9s  cluster --list-databases --long
SIZE        #TBL #ROWS     OWNER  GROUP  CLUSTER                DATABASE
  7,340,032    0         0 system admins PostgreSQL 10          postgres
  7,340,032    0         0 system admins PostgreSQL 10          template1
  7,340,032    0         0 system admins PostgreSQL 10          template0
765,460,480   24 2,399,611 system admins PostgreSQL 10          sbtest
          0  101         - system admins Oracle 5.7 Replication sys
Total: 5 databases, 789,577,728, 125 tables.
The last line summarizes that we have total of 5 databases with 125 tables, 4 of them are on our PostgreSQL cluster.
For a complete example of usage on s9s cluster command line options, check out s9s cluster documentation.
Node Monitoring
For nodes monitoring, s9s CLI has similar features with the cluster option. To get a summarized view of all nodes, you can simply do:
$ s9s node --list --long
STAT VERSION    CID CLUSTER                HOST       PORT  COMMENT
coC- 1.6.2.2662  23 PostgreSQL 10          10.0.0.156  9500 Up and running
poM- 10.4        23 PostgreSQL 10          10.0.0.44   5432 Up and running
poS- 10.4        23 PostgreSQL 10          10.0.0.58   5432 Up and running
poS- 10.4        23 PostgreSQL 10          10.0.0.60   5432 Up and running
soS- 5.7.23-log  24 Oracle 5.7 Replication 10.0.0.104  3306 Up and running.
coC- 1.6.2.2662  24 Oracle 5.7 Replication 10.0.0.156  9500 Up and running
soM- 5.7.23-log  24 Oracle 5.7 Replication 10.0.0.168  3306 Up and running.
mo-- 3.2.20      25 MongoDB 3.6            10.0.0.125 27017 Up and Running
mo-- 3.2.20      25 MongoDB 3.6            10.0.0.131 27017 Up and Running
coC- 1.6.2.2662  25 MongoDB 3.6            10.0.0.156  9500 Up and running
mo-- 3.2.20      25 MongoDB 3.6            10.0.0.35  27017 Up and Running
Total: 11
The most left-hand column specifies the type of the node. For this deployment, “c” represents ClusterControl Controller, ‘p” for PostgreSQL, “m” for MongoDB, “e” for Memcached and s for generic MySQL nodes. The next one is the host status – “o” for online, “l” for off-line, “f” for failed nodes and so on. The next one is the role of the node in the cluster. It can be M for master, S for slave, C for controller and – for everything else. The remaining columns are pretty self-explanatory.
You can get all the list by looking at the man page of this component:
$ man s9s-nodeFrom there, we can jump into a more detailed stats for all nodes with –stats flag:
$ s9s node --stat --cluster-id=24
10.0.0.104:3306
Name: 10.0.0.104 Cluster: Oracle 5.7 Replication (24)
IP: 10.0.0.104 Port: 3306
Alias: - Owner: system/admins
Class: CmonMySqlHost Type: mysql
Status: CmonHostOnline Role: slave
OS: centos 7.0.1406 core Access: read-only
VM ID: -
Version: 5.7.23-log
Message: Up and running.
LastSeen: Just now SSH: 0 fail(s)
Connect: y Maintenance: n Managed: n Recovery: n Skip DNS: y SuperReadOnly: n
Pid: 16592 Uptime: 01:44:38
Config: '/etc/my.cnf'
LogFile: '/var/log/mysql/mysqld.log'
PidFile: '/var/lib/mysql/mysql.pid'
DataDir: '/var/lib/mysql/'
10.0.0.168:3306
Name: 10.0.0.168 Cluster: Oracle 5.7 Replication (24)
IP: 10.0.0.168 Port: 3306
Alias: - Owner: system/admins
Class: CmonMySqlHost Type: mysql
Status: CmonHostOnline Role: master
OS: centos 7.0.1406 core Access: read-write
VM ID: -
Version: 5.7.23-log
Message: Up and running.
Slaves: 10.0.0.104:3306
LastSeen: Just now SSH: 0 fail(s)
Connect: n Maintenance: n Managed: n Recovery: n Skip DNS: y SuperReadOnly: n
Pid: 975 Uptime: 01:52:53
Config: '/etc/my.cnf'
LogFile: '/var/log/mysql/mysqld.log'
PidFile: '/var/lib/mysql/mysql.pid'
DataDir: '/var/lib/mysql/'
10.0.0.156:9500
Name: 10.0.0.156 Cluster: Oracle 5.7 Replication (24)
IP: 10.0.0.156 Port: 9500
Alias: - Owner: system/admins
Class: CmonHost Type: controller
Status: CmonHostOnline Role: controller
OS: centos 7.0.1406 core Access: read-write
VM ID: -
Version: 1.6.2.2662
Message: Up and running
LastSeen: 28 seconds ago SSH: 0 fail(s)
Connect: n Maintenance: n Managed: n Recovery: n Skip DNS: n SuperReadOnly: n
Pid: 12746 Uptime: 01:10:05
Config: ''
LogFile: '/var/log/cmon_24.log'
PidFile: ''
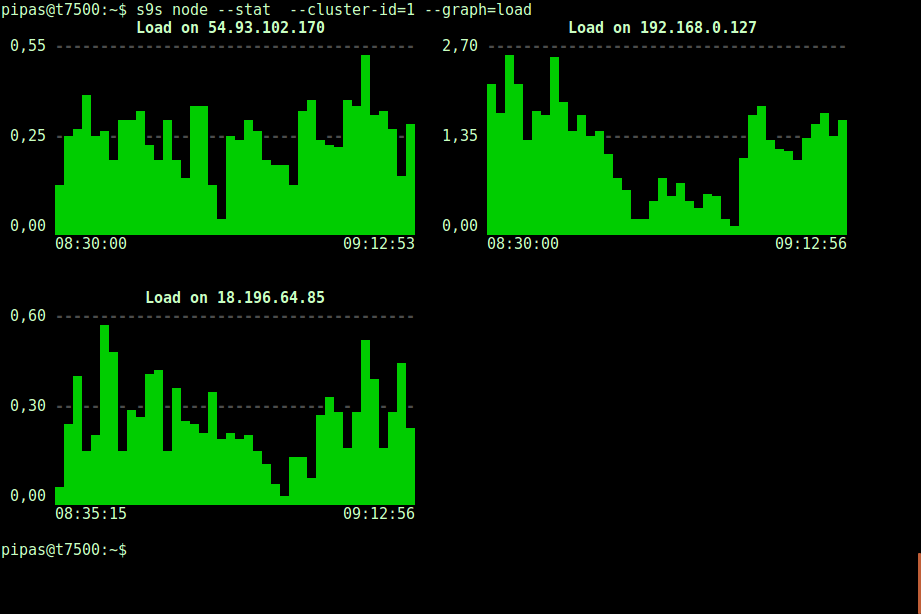
DataDir: ''Printing graphs with the s9s client can also be very informative. This presents the data the controller collected in various graphs. There are almost 30 graphs supported by this tool as listed here and s9s-node enumerates them all. The following shows server load histogram of all nodes for cluster ID 1 as collected by CMON, right from your terminal:
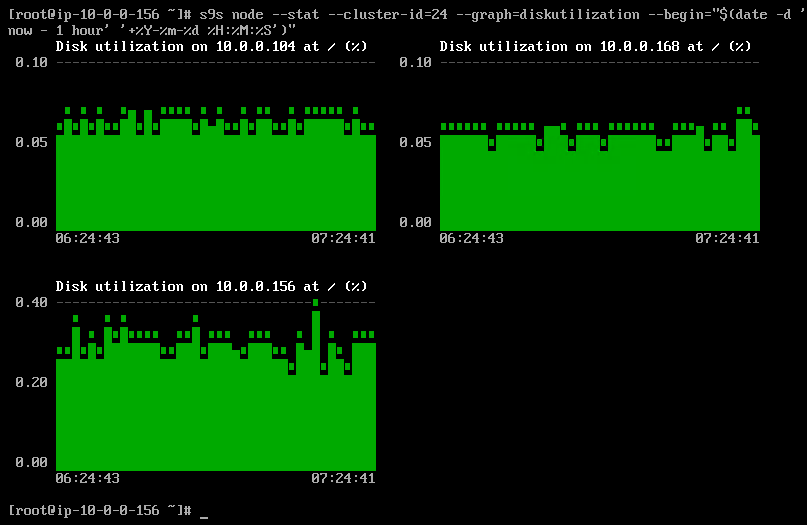
It is possible to set the start and end date and time. One can view short periods (like the last hour) or longer periods (like a week or a month). The following is an example of viewing the disk utilization for the last hour:
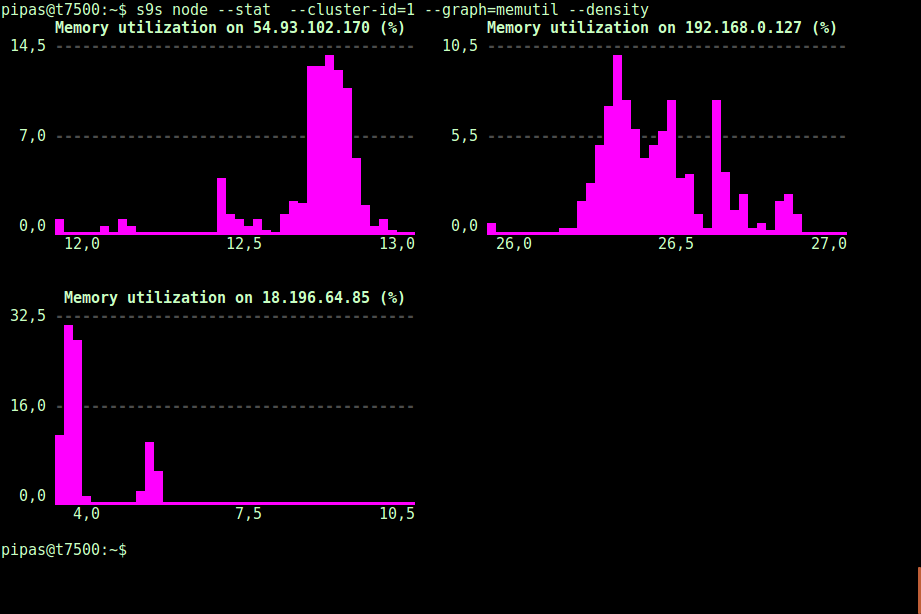
Using the –density option, a different view can be printed for every graph. This density graph shows not the time series, but how frequently the given values were seen (X-axis represents the density value):
If the terminal does not support Unicode characters, the –only-ascii option can switch them off:
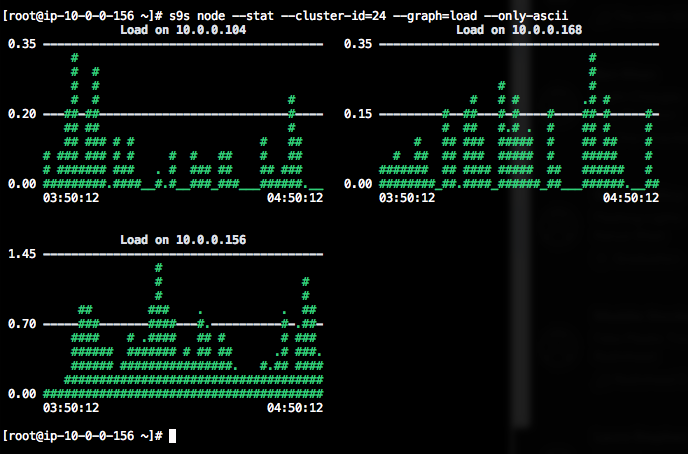
The graphs have colors, where dangerously high values for example are shown in red. The list of nodes can be filtered with –nodes option, where you can specify the node names or use wildcards if convenient.
Process Monitoring
Another cool thing about s9s CLI is it provides a processlist of the entire cluster – a “top” for all nodes, all processes merged into one. The following command runs the “top” command on all database nodes for cluster ID 24, sorted by the most CPU consumption, and updated continuously:
$ s9s process --top --cluster-id=24
Oracle 5.7 Replication - 04:39:17                                                                                                                                                      All nodes are operational.
3 hosts, 4 cores, 10.6 us,  4.2 sy, 84.6 id,  0.1 wa,  0.3 st,
GiB Mem : 5.5 total, 1.7 free, 2.6 used, 0.1 buffers, 1.1 cached
GiB Swap: 0 total, 0 used, 0 free,

PID   USER     HOST       PR  VIRT      RES    S   %CPU   %MEM COMMAND
12746 root     10.0.0.156 20  1359348    58976 S  25.25   1.56 cmon
 1587 apache   10.0.0.156 20   462572    21632 S   1.38   0.57 httpd
  390 root     10.0.0.156 20     4356      584 S   1.32   0.02 rngd
  975 mysql    10.0.0.168 20  1144260    71936 S   1.11   7.08 mysqld
16592 mysql    10.0.0.104 20  1144808    75976 S   1.11   7.48 mysqld
22983 root     10.0.0.104 20   127368     5308 S   0.92   0.52 sshd
22548 root     10.0.0.168 20   127368     5304 S   0.83   0.52 sshd
 1632 mysql    10.0.0.156 20  3578232  1803336 S   0.50  47.65 mysqld
  470 proxysql 10.0.0.156 20   167956    35300 S   0.44   0.93 proxysql
  338 root     10.0.0.104 20     4304      600 S   0.37   0.06 rngd
  351 root     10.0.0.168 20     4304      600 R   0.28   0.06 rngd
   24 root     10.0.0.156 20        0        0 S   0.19   0.00 rcu_sched
  785 root     10.0.0.156 20   454112    11092 S   0.13   0.29 httpd
   26 root     10.0.0.156 20        0        0 S   0.13   0.00 rcuos/1
   25 root     10.0.0.156 20        0        0 S   0.13   0.00 rcuos/0
22498 root     10.0.0.168 20   127368     5200 S   0.09   0.51 sshd
14538 root     10.0.0.104 20        0        0 S   0.09   0.00 kworker/0:1
22933 root     10.0.0.104 20   127368     5200 S   0.09   0.51 sshd
28295 root     10.0.0.156 20   127452     5016 S   0.06   0.13 sshd
 2238 root     10.0.0.156 20   197520    10444 S   0.06   0.28 vc-agent-007
  419 root     10.0.0.156 20    34764     1660 S   0.06   0.04 systemd-logind
    1 root     10.0.0.156 20    47628     3560 S   0.06   0.09 systemd
27992 proxysql 10.0.0.156 20    11688      872 S   0.00   0.02 proxysql_galera
28036 proxysql 10.0.0.156 20    11688      876 S   0.00   0.02 proxysql_galera
There is also a –list flag which returns a similar result without continuous update (similar to “ps” command):
$ s9s process --list --cluster-id=25Job Monitoring
Jobs are tasks performed by the controller in the background, so that the client application does not need to wait until the entire job is finished. ClusterControl executes management tasks by assigning an ID for every task and lets the internal scheduler decide whether two or more jobs can be run in parallel. For example, more than one cluster deployment can be executed simultaneously, as well as other long running operations like backup and automatic upload of backups to cloud storage.
In any management operation, it’s would be helpful if we could monitor the progress and status of a specific job, like e.g., scale out a new slave for our MySQL replication. The following command add a new slave, 10.0.0.77 to scale out our MySQL replication:
$ s9s cluster --add-node --nodes="10.0.0.77" --cluster-id=24
Job with ID 66992 registered.
We can then monitor the jobID 66992 using the job option:
$ s9s job --log --job-id=66992
addNode: Verifying job parameters.
10.0.0.77:3306: Adding host to cluster.
10.0.0.77:3306: Testing SSH to host.
10.0.0.77:3306: Installing node.
10.0.0.77:3306: Setup new node (installSoftware = true).
10.0.0.77:3306: Setting SELinux in permissive mode.
10.0.0.77:3306: Disabling firewall.
10.0.0.77:3306: Setting vm.swappiness = 1
10.0.0.77:3306: Installing software.
10.0.0.77:3306: Setting up repositories.
10.0.0.77:3306: Installing helper packages.
10.0.0.77: Upgrading nss.
10.0.0.77: Upgrading ca-certificates.
10.0.0.77: Installing socat.
...
10.0.0.77: Installing pigz.
10.0.0.77: Installing bzip2.
10.0.0.77: Installing iproute2.
10.0.0.77: Installing tar.
10.0.0.77: Installing openssl.
10.0.0.77: Upgrading openssl openssl-libs.
10.0.0.77: Finished with helper packages.
10.0.0.77:3306: Verifying helper packages (checking if socat is installed successfully).
10.0.0.77:3306: Uninstalling existing MySQL packages.
10.0.0.77:3306: Installing replication software, vendor oracle, version 5.7.
10.0.0.77:3306: Installing software.
...
Or we can use the –wait flag and get a spinner with progress bar:
$ s9s job --wait --job-id=66992
Add Node to Cluster
- Job 66992 RUNNING    [         █] ---% Add New Node to Cluster
That’s it for today’s monitoring supplement. We hope that you’ll give the CLI a try and get value out of it. Happy clustering