blog
How to Get Started with ClusterControl
Managing database production systems takes a ton of work. Even with all the passion you can muster, it is never an easy undertaking. For one, the times when you had single database vendor are gone. The competition in the market is very strong. Developers, architects, everyone takes what’s best for their application. You regularly need to improve your staff’s technical skills because these days companies need to develop fast and enter the market as soon as possible. On the other side, the number of database software features is growing, and it is not easy to stay on top of everything. Your stakeholders expect you to keep your environment up and running, secure and flexible enough so you can participate in automated testing and deployments.
With this blog post we are going to show you how to become a modern DBA and achieve your goals with ClusterControl, the ready-made solution that will automate your database system lifecycle in no time.
Installation
Let’s start with the ClusterControl installation process. There are several methods to choose from. In all cases, the process is simple and straightforward. If you have an open internet connection, you can easily install ClusterControl automatically using an installer script.
We encourage users to go to the ClusterControl download page and select the installation method they prefer (user registration required). Once registered, for the installer script you will see the installation instructions similar to the one below.
# Download the script
$ wget http://www.severalnines.com/downloads/cmon/install-cc

# Make it executable
$ chmod +x install-cc

# Install
$ sudo ./install-cc # omit sudo if you run as rootIf you would like to install ClusterControl through your existing tools like Helm in Kubernetes, Terraform, Puppet, Ansible etc, refer to this documentation. Also refer to the following documentations of other methods:
After the installation, which usually takes several minutes, you will be able to login to the web interface. Make sure to use Firefox or Chrome. What you can see now is the ClusterControl web interface configured and ready to start. So let’s try it.
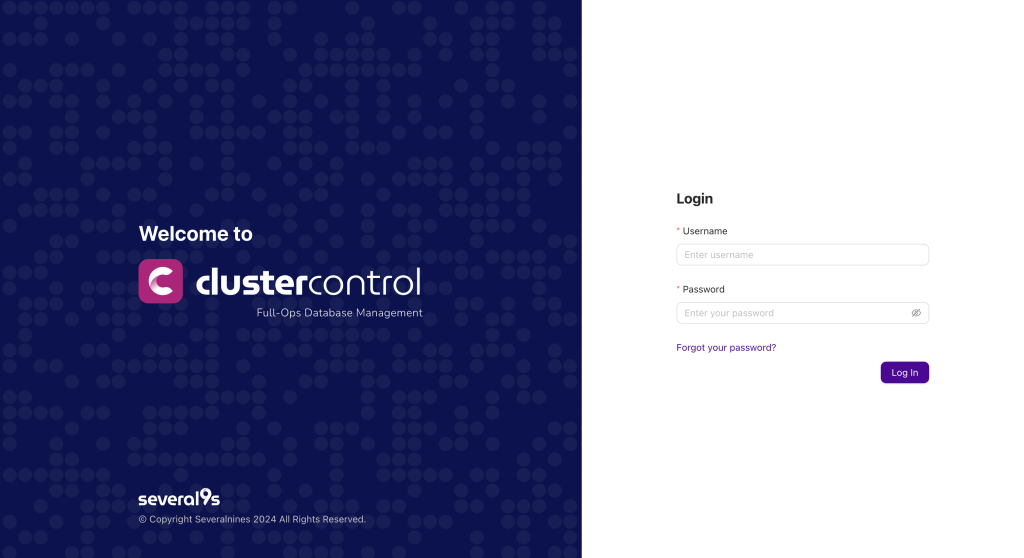
During the first login, you will be asked to create an account; you will need that later so make sure to store the password in a safe place. ClusterControl allows creating multiple user accounts based on their roles and you can synchronize logins with your LDAP server.
Because at this point you do not have any cluster deployed, you will see a prompt to either deploy a new cluster or import / add existing nodes. But don’t worry, you do not need to install any agent on the database hosts you wish to import; ClusterControl will ask you instead to provide ssh authentication keys. If you do not know how to create ssh keys, please check our documentation.
So, now that you have your first nodes added to ClusterControl, what next? Usually, at this point, we look around, check current performance, graphs, active connections, explore monitoring metrics. However, we would like to encourage you to check several unique functions that will be of significant assistance to your database management work.
Cluster Topology
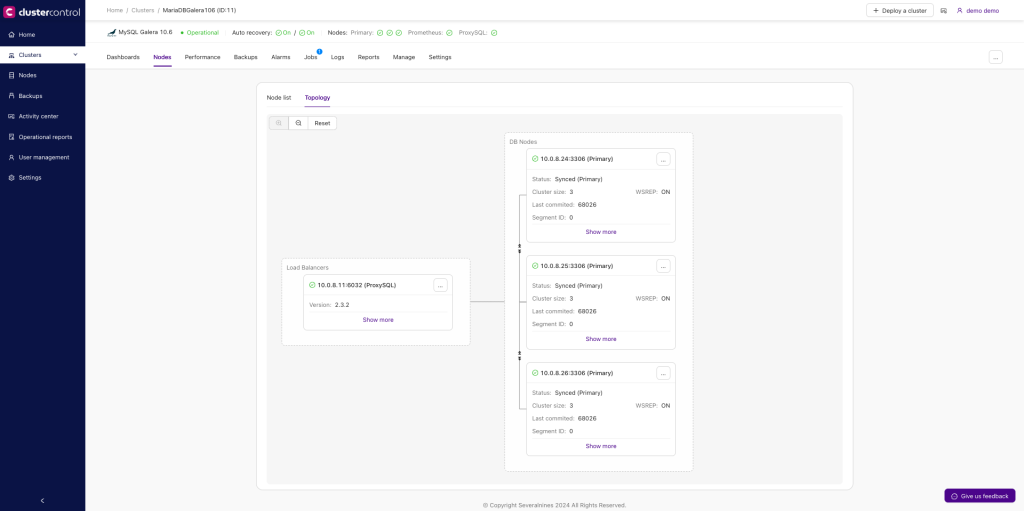
The Cluster Topology view allows you to check the graphical interpretation of your environment. ClusterControl scans your configuration and based on these, it creates visual blocks and connections between them. From here you can manage your database nodes, do switchovers or even reboot the nodes and sync data. You can also see here if there are ongoing issues. Besides that ClusterControl adds additional pre-checks for the actions that you want to perform. Predefined checks do not allow to execute tasks that may cause data loss or fail to complete. You will find the topology view very useful in sophisticated matrix environments as well as clusters with multiple nodes.
Various Advisors
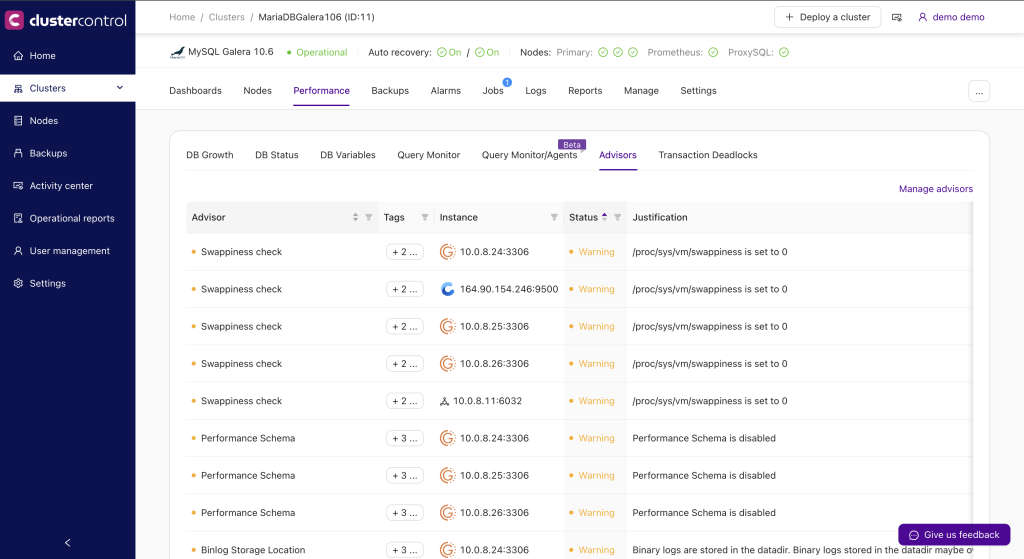
We build numerous advisors in ClusterControl for each type of database system, so you can see if your system is set correctly. These custom advisors allow you to set the threshold to be alerted on if a metric falls below or rises above the threshold and stays there for a specified timeframe. Built in advisors are divided into multiple sections: All, s9s, mysql, security, schema, replication, Percona schema, InnoDB, Galera, connections, and hosts. Among the different types of advisors, you can see security checks, resource usage thresholds through to more sophisticated ones such as an advisor that determines the write load on a Galera cluster and estimates if the Galera cache file is sufficient in size to sustain a replication window threshold.
Operational reports
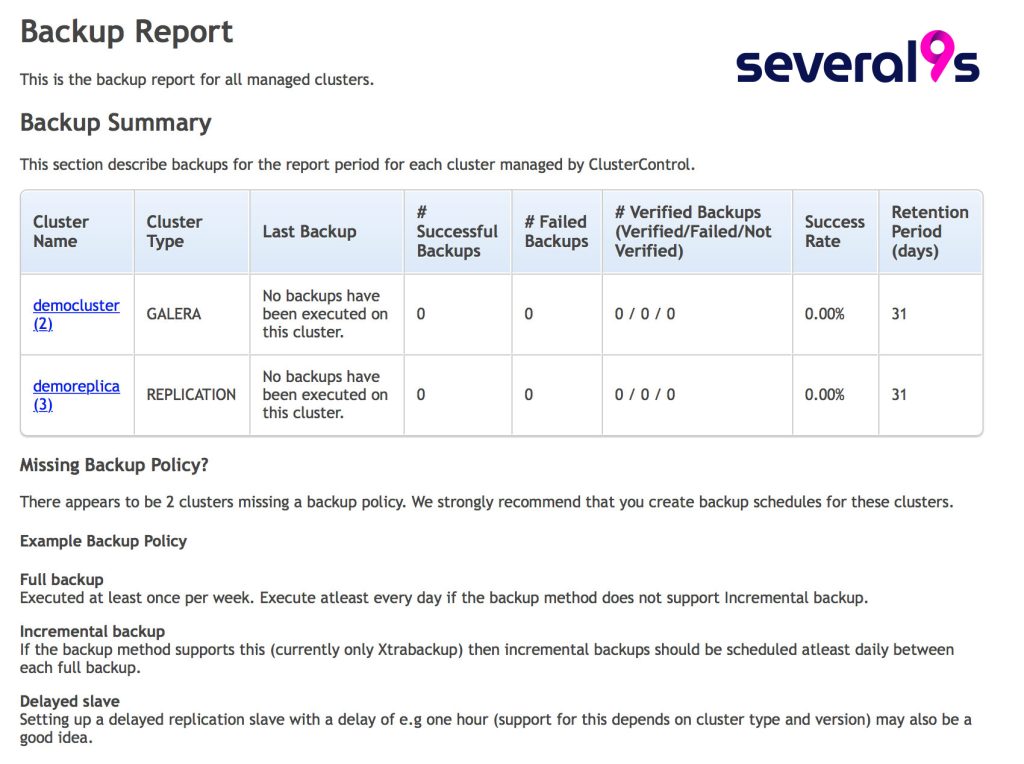
Operational reports can help you with daily checks that you need to perform in your environment. You can schedule cross environment reports like “Daily System Report,” “Package Upgrade Report,” “Schema Change Report” as well as “Backups” and “Availability” reports. It will help you to keep your environment secure and operational, and you will see recommendations on how to fix gaps. Below you can see an example of a backup report for a three node cluster. Such reports can be addressed to Sysops, DevOps or even managers who would like to get regular status updates about a given system’s health.
Manage Upgrades
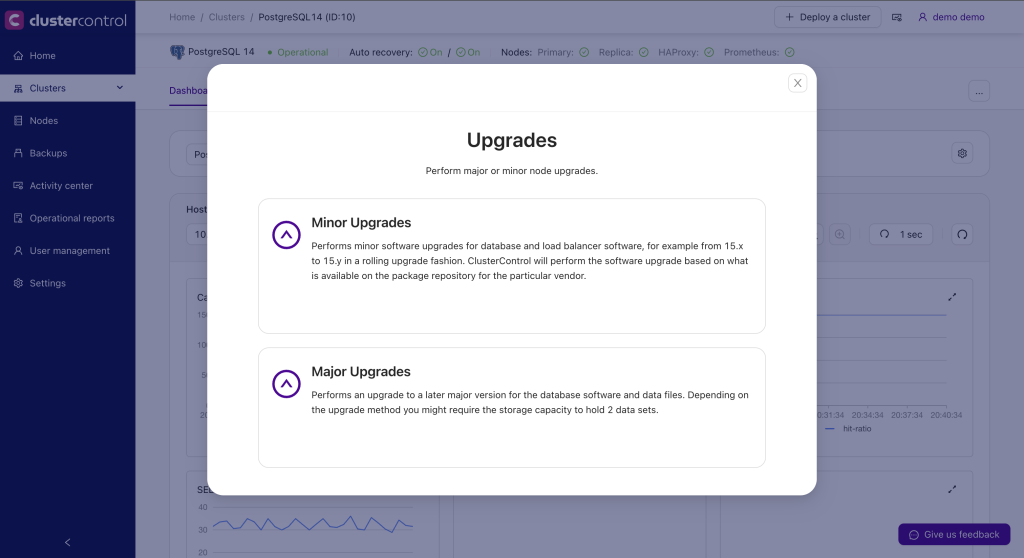
In ClusterControl’s database management section you can find multiple options, such as host configuration, database configuration, load balancers, processes management, schema and users management, the mentioned advisors, developer studio, and upgrades. Let’s take a look at upgrades. If the database versions support it, you can execute your nodes upgrade in rolling restart mode. If a rolling restart is not supported, then you can either stop start nodes from the ClusterControl GUI. Upgrades are performed online and are performed on one node at a time. The node will be stopped, then the software will be updated, and then the node will be started again. ClusterControl monitors the entire process and if a node fails to upgrade then the whole process is aborted, and the admin is notified.
Third party integration
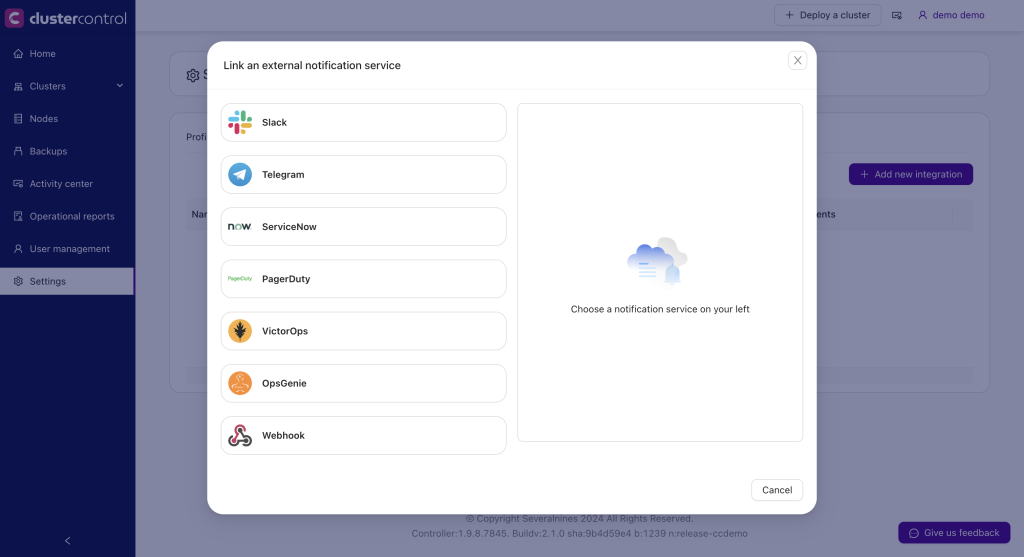
Third party tools integration enables you to automate alerts with other popular systems. Currently, we support PagerDuty, VictorOps, OpsGenie, Slack, Telegram, and Webhooks. For example, you can create a slack channel that will get notifications from your database systems, so interested teams can see it from there or page your DBA when the system is down via PagerDuty; and if your other ticketing systems use Webhooks, you can integrate with them as well.
We hope this blog post will help you take your first steps with ClusterControl. If you have any questions or need any assistance during the initial configuration, installation or if you need a demon session, please do not hesitate to contact our team.


