blog
How to Automate Galera Cluster Using the ClusterControl CLI

As sysadmins and developers, we spend a lot our time in a terminal. So we brought ClusterControl to the terminal with our command line interface tool called s9s. s9s provides an easy interface to the ClusterControl RPC v2 API. You will find it very useful when working with large scale deployments, as the CLI allows will allow you to design more complex features and workflows.
This blog post showcases how to use s9s to automate the management of Galera Cluster for MySQL or MariaDB, as well as a simple master-slave replication setup.
Setup
You can find installation instructions for your particular OS in the documentation. What’s important to note is that if you happen to use the latest s9s-tools, from GitHub, there’s a slight change in the way you create a user. The following command will work fine:
s9s user --create --generate-key --controller="https://localhost:9501" dbaIn general, there are two steps required if you want to configure CLI locally on the ClusterControl host. First, you need to create a user and then make some changes in the configuration file – all the steps are included in the documentation.
Deployment
Once the CLI has been configured correctly and has SSH access to your target database hosts, you can start the deployment process. At the time of writing, you can use the CLI to deploy MySQL, MariaDB and PostgreSQL clusters. Let’s start with an example of how to deploy Percona XtraDB Cluster 5.7. A single command is required to do that.
s9s cluster --create --cluster-type=galera --nodes="10.0.0.226;10.0.0.227;10.0.0.228" --vendor=percona --provider-version=5.7 --db-admin-passwd="pass" --os-user=root --cluster-name="PXC_Cluster_57" --waitLast option “–wait” means that the command will wait until the job completes, showing its progress. You can skip it if you want – in that case, the s9s command will return immediately to shell after it registers a new job in cmon. This is perfectly fine as cmon is the process which handles the job itself. You can always check the progress of a job separately, using:
root@vagrant:~# s9s job --list -l
--------------------------------------------------------------------------------------
Create Galera Cluster
Installing MySQL on 10.0.0.226                                           [██▊       ]
                                                                                                                                                                                                         26.09%
Created   : 2017-10-05 11:23:00    ID   : 1          Status : RUNNING
Started   : 2017-10-05 11:23:02    User : dba        Host   :
Ended     :                        Group: users
--------------------------------------------------------------------------------------
Total: 1
Let’s take a look at another example. This time we’ll create a new cluster, MySQL replication: simple master – slave pair. Again, a single command is enough:
root@vagrant:~# s9s cluster --create --nodes="10.0.0.229?master;10.0.0.230?slave" --vendor=percona --cluster-type=mysqlreplication --provider-version=5.7 --os-user=root --wait
Create MySQL Replication Cluster
/ Job  6 FINISHED   [██████████] 100% Cluster created
We can now verify that both clusters are up and running:
root@vagrant:~# s9s cluster --list --long
ID STATE   TYPE        OWNER GROUP NAME           COMMENT
 1 STARTED galera      dba   users PXC_Cluster_57 All nodes are operational.
 2 STARTED replication dba   users cluster_2      All nodes are operational.
Total: 2
Of course, all of this is also visible via the GUI:
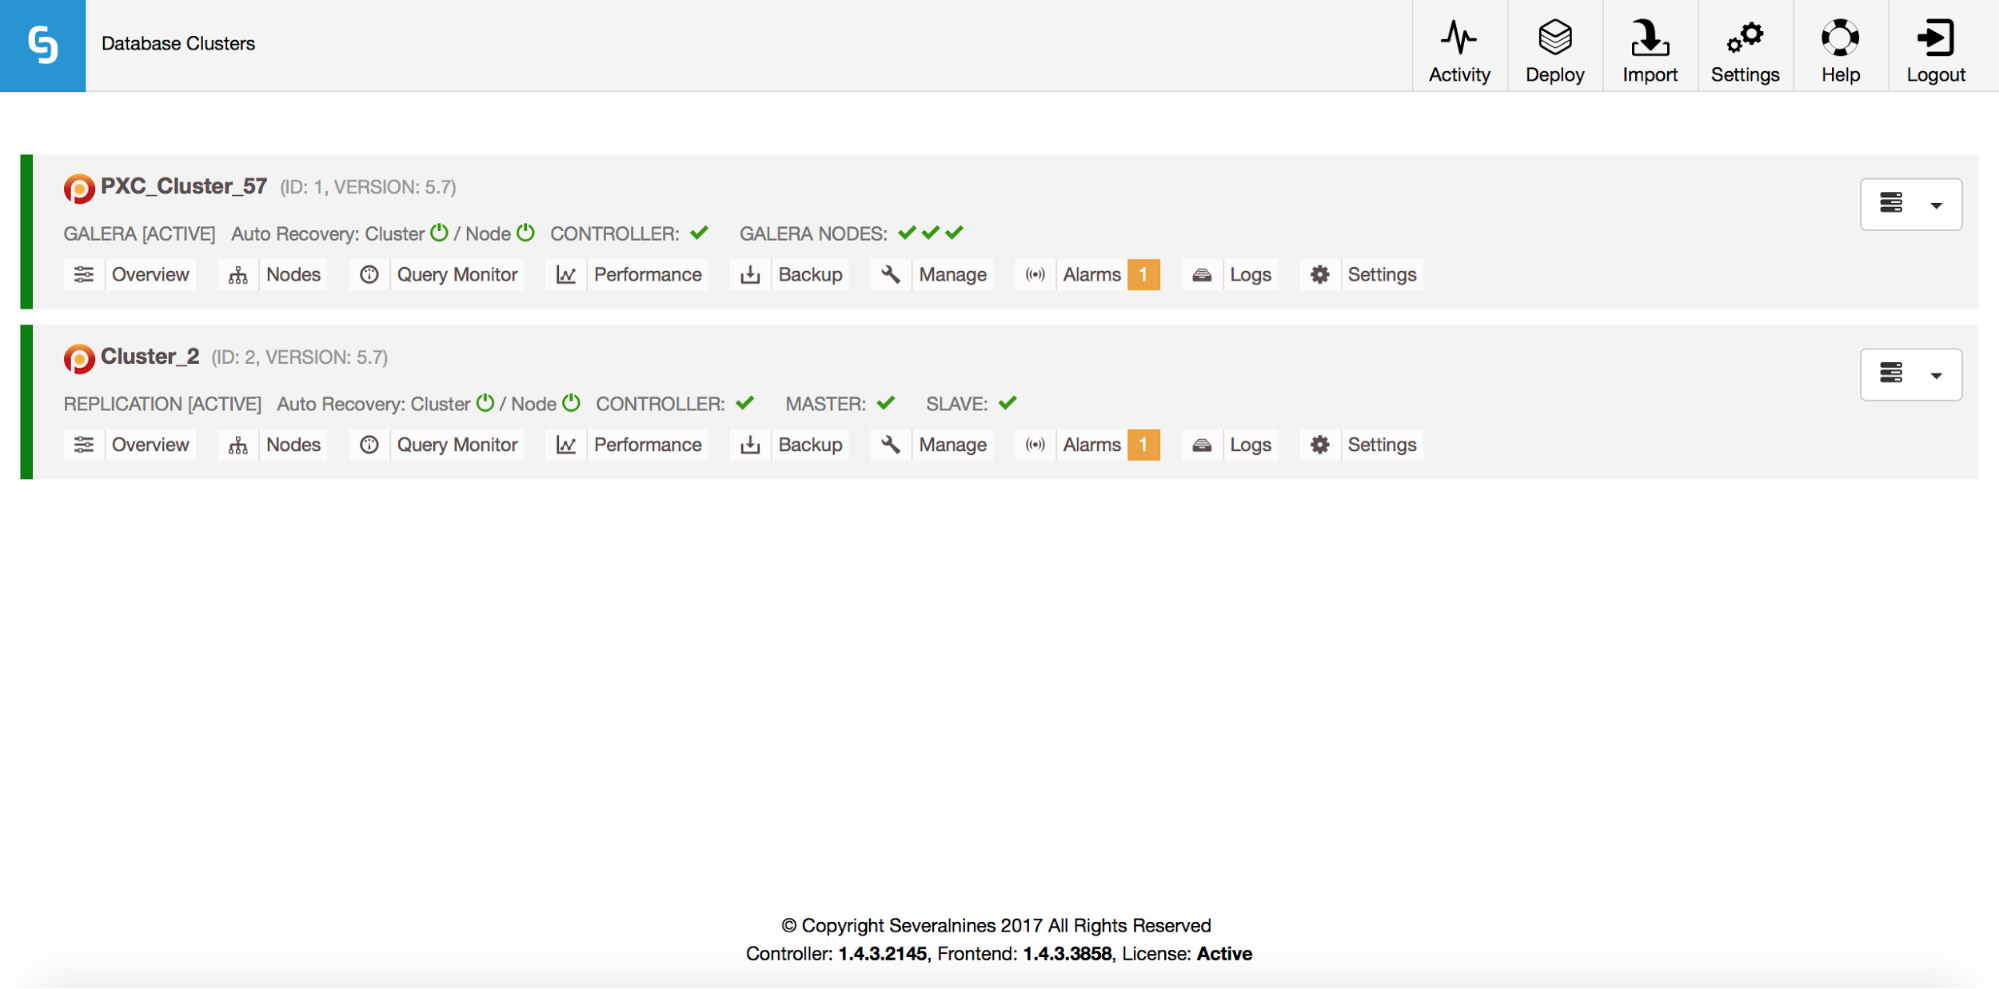
Now, let’s add a ProxySQL loadbalancer:
root@vagrant:~# s9s cluster --add-node --nodes="proxysql://10.0.0.226" --cluster-id=1
WARNING: admin/admin
WARNING: proxy-monitor/proxy-monitor
Job with ID 7 registered.
This time we didn’t use ‘–wait’ option so, if we want to check the progress, we have to do it on our own. Please note that we are using a job ID which was returned by the previous command, so we’ll obtain information on this particular job only:
root@vagrant:~# s9s job --list --long --job-id=7
--------------------------------------------------------------------------------------
Add ProxySQL to Cluster
Waiting for ProxySQL                                                     [██████▋   ]
                                                                            65.00%
Created   : 2017-10-06 14:09:11    ID   : 7          Status : RUNNING
Started   : 2017-10-06 14:09:12    User : dba        Host   :
Ended     :                        Group: users
--------------------------------------------------------------------------------------
Total: 7
Scaling out
Nodes can be added to our Galera cluster via a single command:
s9s cluster --add-node --nodes 10.0.0.229 --cluster-id 1
Job with ID 8 registered.
root@vagrant:~# s9s job --list --job-id=8
ID CID STATE  OWNER GROUP CREATED  RDY  TITLE
 8   1 FAILED dba   users 14:15:52   0% Add Node to Cluster
Total: 8
Something went wrong. We can check what exactly happened:
root@vagrant:~# s9s job --log --job-id=8
addNode: Verifying job parameters.
10.0.0.229:3306: Adding host to cluster.
10.0.0.229:3306: Testing SSH to host.
10.0.0.229:3306: Installing node.
10.0.0.229:3306: Setup new node (installSoftware = true).
10.0.0.229:3306: Detected a running mysqld server. It must be uninstalled first, or you can also add it to ClusterControl.
Right, that IP is already used for our replication server. We should have used another, free IP. Let’s try that:
root@vagrant:~# s9s cluster --add-node --nodes 10.0.0.231 --cluster-id 1
Job with ID 9 registered.
root@vagrant:~# s9s job --list --job-id=9
ID CID STATE    OWNER GROUP CREATED  RDY  TITLE
 9   1 FINISHED dba   users 14:20:08 100% Add Node to Cluster
Total: 9
Managing
Let’s say we want to take a backup of our replication master. We can do that from the GUI but sometimes we may need to integrate it with external scripts. ClusterControl CLI would make a perfect fit for such case. Let’s check what clusters we have:
root@vagrant:~# s9s cluster --list --long
ID STATE   TYPE        OWNER GROUP NAME           COMMENT
 1 STARTED galera      dba   users PXC_Cluster_57 All nodes are operational.
 2 STARTED replication dba   users cluster_2      All nodes are operational.
Total: 2
Then, let’s check the hosts in our replication cluster, with cluster ID 2:
root@vagrant:~# s9s nodes --list --long --cluster-id=2
STAT VERSION       CID CLUSTER   HOST       PORT COMMENT
soM- 5.7.19-17-log   2 cluster_2 10.0.0.229 3306 Up and running
soS- 5.7.19-17-log   2 cluster_2 10.0.0.230 3306 Up and running
coC- 1.4.3.2145      2 cluster_2 10.0.2.15  9500 Up and running
As we can see, there are three hosts that ClusterControl knows about – two of them are MySQL hosts (10.0.0.229 and 10.0.0.230), the third one is the ClusterControl instance itself. Let’s print only the relevant MySQL hosts:
root@vagrant:~# s9s nodes --list --long --cluster-id=2 10.0.0.2*
STAT VERSION       CID CLUSTER   HOST       PORT COMMENT
soM- 5.7.19-17-log   2 cluster_2 10.0.0.229 3306 Up and running
soS- 5.7.19-17-log   2 cluster_2 10.0.0.230 3306 Up and running
Total: 3
In the “STAT” column you can see some characters there. For more information, we’d suggest to look into the manual page for s9s-nodes (man s9s-nodes). Here we’ll just summarize the most important bits. First character tells us about the type of the node: “s” means it’s regular MySQL node, “c” – ClusterControl controller. Second character describes the state of the node: “o” tells us it’s online. Third character – role of the node. Here “M” describes a master and “S” – a slave while “C” stands for controller. Final, fourth character tells us if the node is in maintenance mode. “-” means there’s no maintenance scheduled. Otherwise we’d see “M” here. So, from this data we can see that our master is a host with IP: 10.0.0.229. Let’s take a backup of it and store it on the controller.
root@vagrant:~# s9s backup --create --nodes=10.0.0.229 --cluster-id=2 --backup-method=xtrabackupfull --wait
Create Backup
| Job 12 FINISHED   [██████████] 100% Command ok
We can then verify if it indeed completed ok. Please note the “–backup-format” option which allows you to define which information should be printed:
root@vagrant:~# s9s backup --list --full --backup-format="Started: %B Completed: %E Method: %M Stored on: %S Size: %s %Fn" --cluster-id=2
Started: 15:29:11 Completed: 15:29:19 Method: xtrabackupfull Stored on: 10.0.0.229 Size: 543382 backup-full-2017-10-06_152911.xbstream.gz
Total 1Monitoring
All databases have to be monitored. ClusterControl uses advisors to watch some of the metrics on both MySQL and the operating system. When a condition is met, a notification is sent. ClusterControl provides also an extensive set of graphs, both real-time as well as historical ones for post-mortem or capacity planning. Sometimes it would be great to have access to some of those metrics without having to go through the GUI. ClusterControl CLI makes it possible through the s9s-node command. Information on how to do that can be found in the manual page of s9s-node. We’ll show some examples of what you can do with CLI.
First of all, let’s take a look at the “–node-format” option to “s9s node” command. As you can see, there are plenty of options to print interesting content.
root@vagrant:~# s9s node --list --node-format "%N %T %R %c cores %u%% CPU utilization %fmG of free memory, %tMB/s of net TX+RX, %Mn" "10.0.0.2*"
10.0.0.226 galera none 1 cores 13.823200% CPU utilization 0.503227G of free memory, 0.061036MB/s of net TX+RX, Up and running
10.0.0.227 galera none 1 cores 13.033900% CPU utilization 0.543209G of free memory, 0.053596MB/s of net TX+RX, Up and running
10.0.0.228 galera none 1 cores 12.929100% CPU utilization 0.541988G of free memory, 0.052066MB/s of net TX+RX, Up and running
10.0.0.226 proxysql  1 cores 13.823200% CPU utilization 0.503227G of free memory, 0.061036MB/s of net TX+RX, Process 'proxysql' is running.
10.0.0.231 galera none 1 cores 13.104700% CPU utilization 0.544048G of free memory, 0.045713MB/s of net TX+RX, Up and running
10.0.0.229 mysql master 1 cores 11.107300% CPU utilization 0.575871G of free memory, 0.035830MB/s of net TX+RX, Up and running
10.0.0.230 mysql slave 1 cores 9.861590% CPU utilization 0.580315G of free memory, 0.035451MB/s of net TX+RX, Up and running
With what we shown here, you probably can imagine some cases for automation. For example, you can watch the CPU utilization of the nodes and if it reaches some threshold, you can execute another s9s job to spin up a new node in the Galera cluster. You can also, for example, monitor memory utilization and send alerts if it passess some threshold.
The CLI can do more than that. First of all, it is possible to check the graphs from within the command line. Of course, those are not as feature-rich as graphs in the GUI, but sometimes it’s enough just to see a graph to find an unexpected pattern and decide if it is worth further investigation.
root@vagrant:~# s9s node --stat --cluster-id=1 --begin="00:00" --end="14:00" --graph=load 10.0.0.231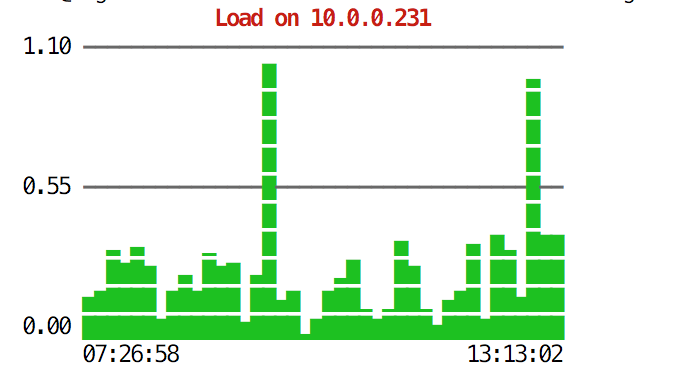
root@vagrant:~# s9s node --stat --cluster-id=1 --begin="00:00" --end="14:00" --graph=sqlqueries 10.0.0.231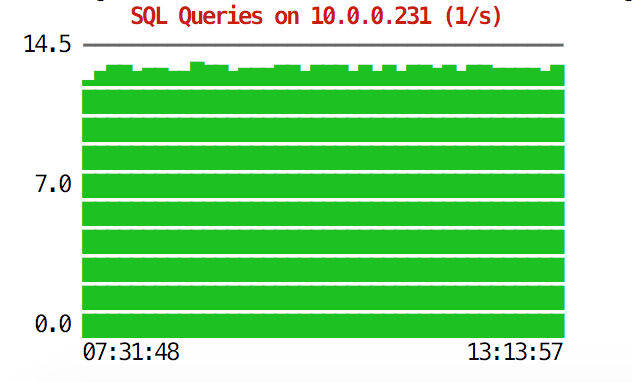
During emergency situations, you may want to check resource utilization across the cluster. You can create a top-like output that combines data from all of the cluster nodes:
root@vagrant:~# s9s process --top --cluster-id=1
PXC_Cluster_57 - 14:38:01                                                                                                                                                               All nodes are operational.
4 hosts, 7 cores,  2.2 us,  3.1 sy, 94.7 id,  0.0 wa,  0.0 st,
GiB Mem : 2.9 total, 0.2 free, 0.9 used, 0.2 buffers, 1.6 cached
GiB Swap: 3 total, 0 used, 3 free,

PID   USER       HOST       PR  VIRT      RES    S   %CPU   %MEM COMMAND
 8331 root       10.0.2.15  20   743748    40948 S  10.28   5.40 cmon
26479 root       10.0.0.226 20   278532     6448 S   2.49   0.85 accounts-daemon
 5466 root       10.0.0.226 20    95372     7132 R   1.72   0.94 sshd
  651 root       10.0.0.227 20   278416     6184 S   1.37   0.82 accounts-daemon
  716 root       10.0.0.228 20   278304     6052 S   1.35   0.80 accounts-daemon
22447 n/a        10.0.0.226 20  2744444   148820 S   1.20  19.63 mysqld
  975 mysql      10.0.0.228 20  2733624   115212 S   1.18  15.20 mysqld
13691 n/a        10.0.0.227 20  2734104   130568 S   1.11  17.22 mysqld
22994 root       10.0.2.15  20    30400     9312 S   0.93   1.23 s9s
 9115 root       10.0.0.227 20    95368     7192 S   0.68   0.95 sshd
23768 root       10.0.0.228 20    95372     7160 S   0.67   0.94 sshd
15690 mysql      10.0.2.15  20  1102012   209056 S   0.67  27.58 mysqld
11471 root       10.0.0.226 20    95372     7392 S   0.17   0.98 sshd
22086 vagrant    10.0.2.15  20    95372     4960 S   0.17   0.65 sshd
 7282 root       10.0.0.226 20        0        0 S   0.09   0.00 kworker/u4:2
 9003 root       10.0.0.226 20        0        0 S   0.09   0.00 kworker/u4:1
 1195 root       10.0.0.227 20        0        0 S   0.09   0.00 kworker/u4:0
27240 root       10.0.0.227 20        0        0 S   0.09   0.00 kworker/1:1
 9933 root       10.0.0.227 20        0        0 S   0.09   0.00 kworker/u4:2
16181 root       10.0.0.228 20        0        0 S   0.08   0.00 kworker/u4:1
 1744 root       10.0.0.228 20        0        0 S   0.08   0.00 kworker/1:1
28506 root       10.0.0.228 20    95372     7348 S   0.08   0.97 sshd
  691 messagebus 10.0.0.228 20    42896     3872 S   0.08   0.51 dbus-daemon
11892 root       10.0.2.15  20        0        0 S   0.08   0.00 kworker/0:2
15609 root       10.0.2.15  20   403548    12908 S   0.08   1.70 apache2
  256 root       10.0.2.15  20        0        0 S   0.08   0.00 jbd2/dm-0-8
  840 root       10.0.2.15  20   316200     1308 S   0.08   0.17 VBoxService
14694 root       10.0.0.227 20    95368     7200 S   0.00   0.95 sshd
12724 n/a        10.0.0.227 20     4508     1780 S   0.00   0.23 mysqld_safe
10974 root       10.0.0.227 20    95368     7400 S   0.00   0.98 sshd
14712 root       10.0.0.227 20    95368     7384 S   0.00   0.97 sshd
16952 root       10.0.0.227 20    95368     7344 S   0.00   0.97 sshd
17025 root       10.0.0.227 20    95368     7100 S   0.00   0.94 sshd
27075 root       10.0.0.227 20        0        0 S   0.00   0.00 kworker/u4:1
27169 root       10.0.0.227 20        0        0 S   0.00   0.00 kworker/0:0
  881 root       10.0.0.227 20    37976      760 S   0.00   0.10 rpc.mountd
  100 root       10.0.0.227  0        0        0 S   0.00   0.00 deferwq
  102 root       10.0.0.227  0        0        0 S   0.00   0.00 bioset
11876 root       10.0.0.227 20     9588     2572 S   0.00   0.34 bash
11852 root       10.0.0.227 20    95368     7352 S   0.00   0.97 sshd
  104 root       10.0.0.227  0        0        0 S   0.00   0.00 kworker/1:1H
When you take a look at the top, you’ll see CPU and memory statistics aggregated across the whole cluster.
root@vagrant:~# s9s process --top --cluster-id=1
PXC_Cluster_57 - 14:38:01                                                                                                                                                               All nodes are operational.
4 hosts, 7 cores,  2.2 us,  3.1 sy, 94.7 id,  0.0 wa,  0.0 st,
GiB Mem : 2.9 total, 0.2 free, 0.9 used, 0.2 buffers, 1.6 cached
GiB Swap: 3 total, 0 used, 3 free,
Below you can find the list of processes from all of the nodes in the cluster.
PID   USER       HOST       PR  VIRT      RES    S   %CPU   %MEM COMMAND
 8331 root       10.0.2.15  20   743748    40948 S  10.28   5.40 cmon
26479 root       10.0.0.226 20   278532     6448 S   2.49   0.85 accounts-daemon
 5466 root       10.0.0.226 20    95372     7132 R   1.72   0.94 sshd
  651 root       10.0.0.227 20   278416     6184 S   1.37   0.82 accounts-daemon
  716 root       10.0.0.228 20   278304     6052 S   1.35   0.80 accounts-daemon
22447 n/a        10.0.0.226 20  2744444   148820 S   1.20  19.63 mysqld
  975 mysql      10.0.0.228 20  2733624   115212 S   1.18  15.20 mysqld
13691 n/a        10.0.0.227 20  2734104   130568 S   1.11  17.22 mysqld
This can be extremely useful if you need to figure out what’s causing the load and which node is the most affected one.
Hopefully, the CLI tool makes it easier for you to integrate ClusterControl with external scripts and infrastructure orchestration tools. We hope you’ll enjoy using this tool and if you have any feedback on how to improve it, feel free to let us know.