blog
Effective Monitoring of MySQL Replication With SCUMM Dashboards: Part 2

In our previous blog on SCUMM dashboards, we looked at the MySQL overview dashboard. The new version of ClusterControl (ver. 1.7) offers a number of high resolution graphs of useful metrics, and we went through the meaning of each of the metrics, and how they help you troubleshoot your database. In this blog, we will look at the MySQL Replication dashboard. Let’s proceed on the details of this dashboard on what has to offer.
MySQL Replication Dashboard
The MySQL Replication Dashboard offers a very straightforward sets of graph that makes it easier to monitor your MySQL master and replica(s). Starting from the top, it shows the most important variables and information to determine the health of the replica(s) or even the master. This dashboard offers a very useful part when inspecting the health of the slaves or a master in master-master setup. One can as well check on this dashboard the master’s binary log creation and determine the overall dimension, in terms of the generated size, at a particular given period of time.
First thing in this dashboard, it presents you with the most important information you might need with the health of your replica. See the graph below:
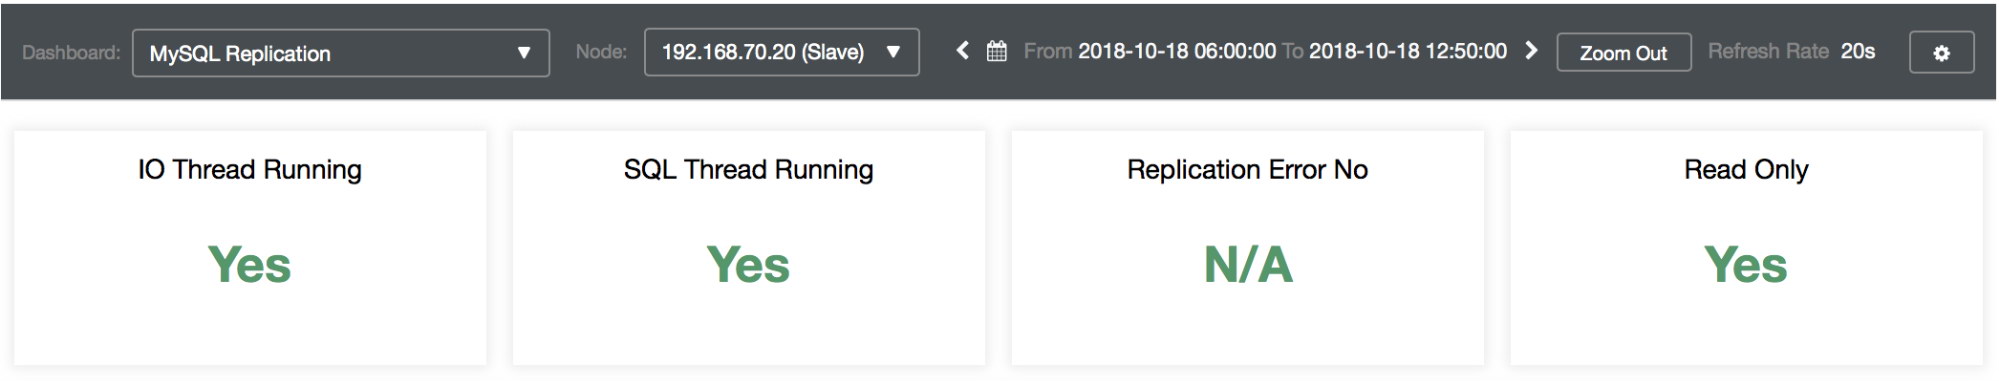
Basically, it will show you the Slave thread’s IO_Thread, SQL_Thread, replication error and if has read_only variable enabled. From the sample screenshot above, all the information shows that my slave 192.168.70.20 is healthy and running normally.
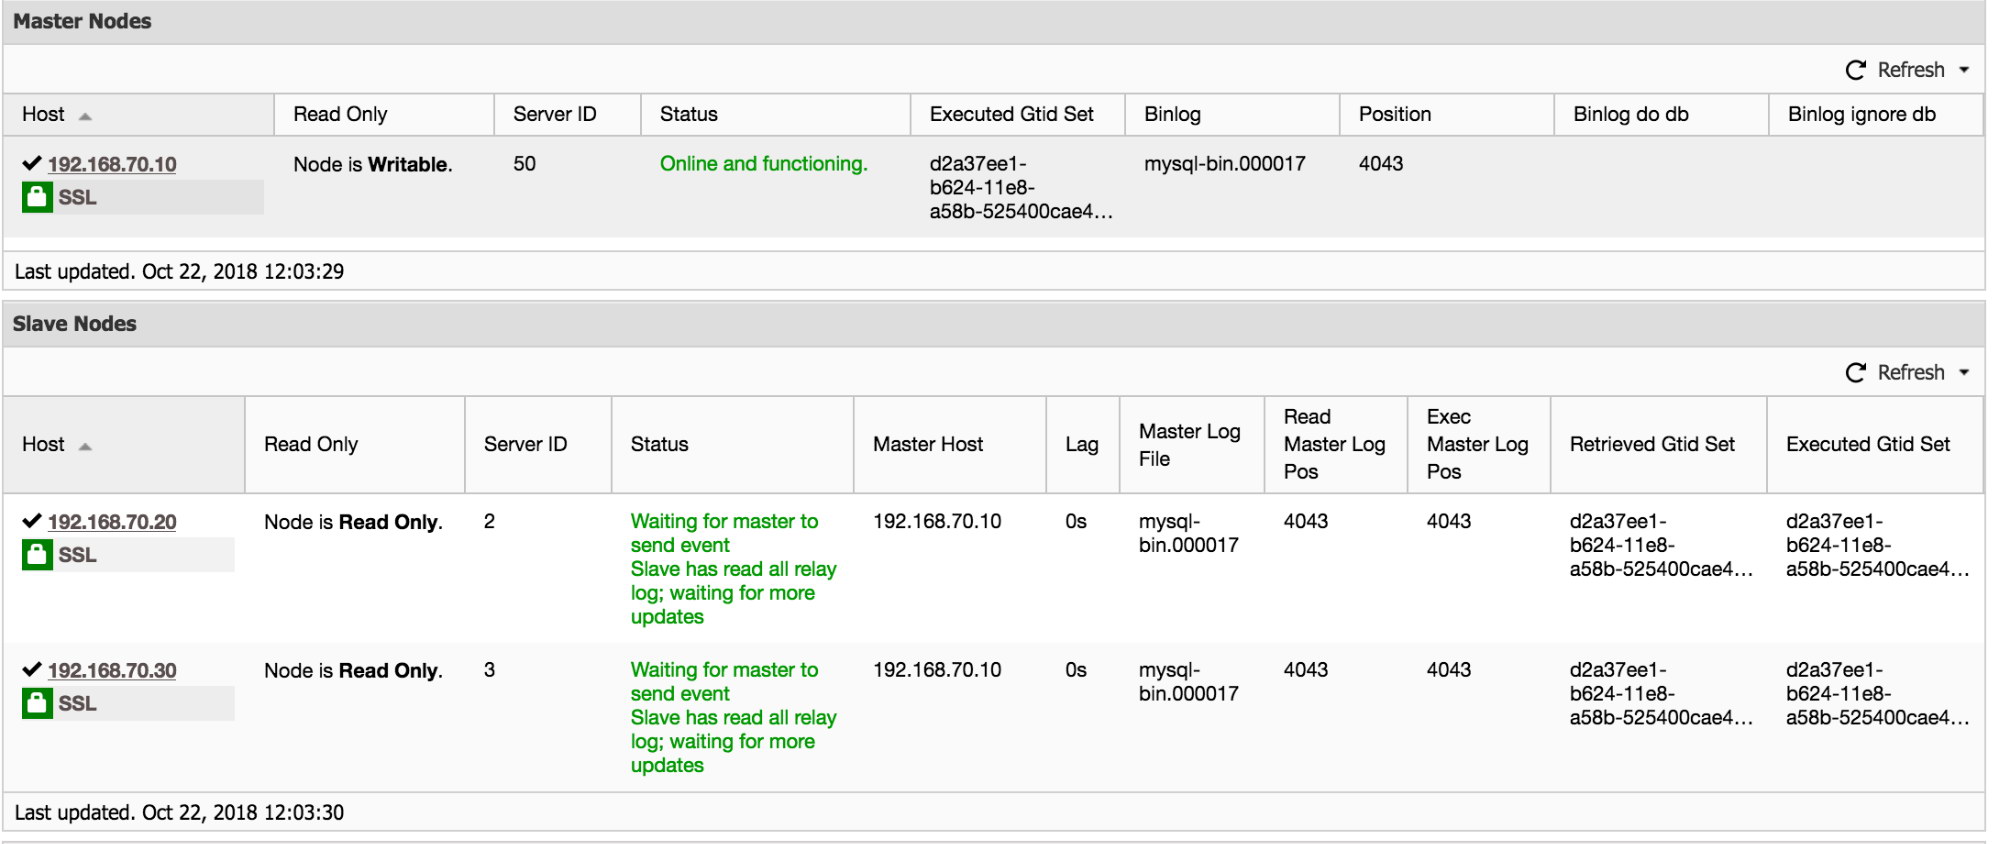
Additionally, ClusterControl has information to gather as well if you go over to Cluster -> Overview. Scroll down and you can see the graph below:
Another place to view the replication setup is the topology view of the replication setup, accessible at Cluster -> Topology. It gives, at a quick glance, a view of the different nodes in the setup, their roles, replication lag, retrieved GTID and more. See the graph below:
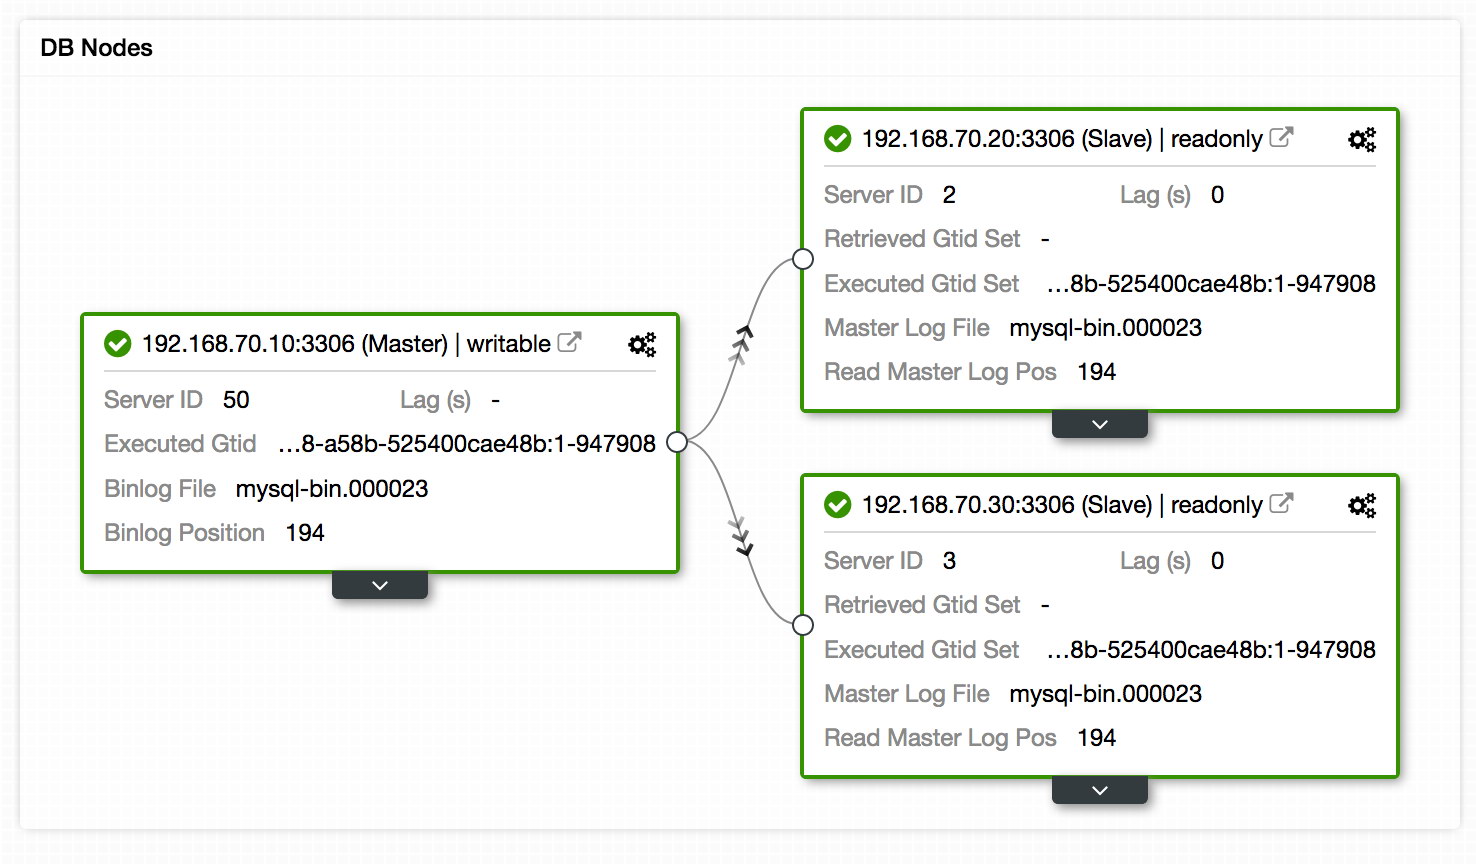
In addition to this, the Topology View also shows all the different nodes that form part of your database cluster whether its the database nodes, load balancers (ProxySQL/MaxScale/HaProxy) or arbitrators (garbd), as well as the connections between them. The nodes, connections, and their statuses are discovered by ClusterControl. Since ClusterControl is continuously monitoring the nodes and keeps state information, any changes in the topology are reflected in the web interface. In case of failure of nodes are reported, you can use the this view along with the SCUMM Dashboards and see what impact that might have cause it.
The Topology View has some similarity with Orchestrator in which you can manage the nodes, change masters by dragging and dropping the object on the desired master, restart nodes and synchronize data. To know more about our Topology View, we suggest you to read our previous blog – “Visualizing your Cluster Topology in ClusterControl”.
Let’s now proceed with the graphs.
-
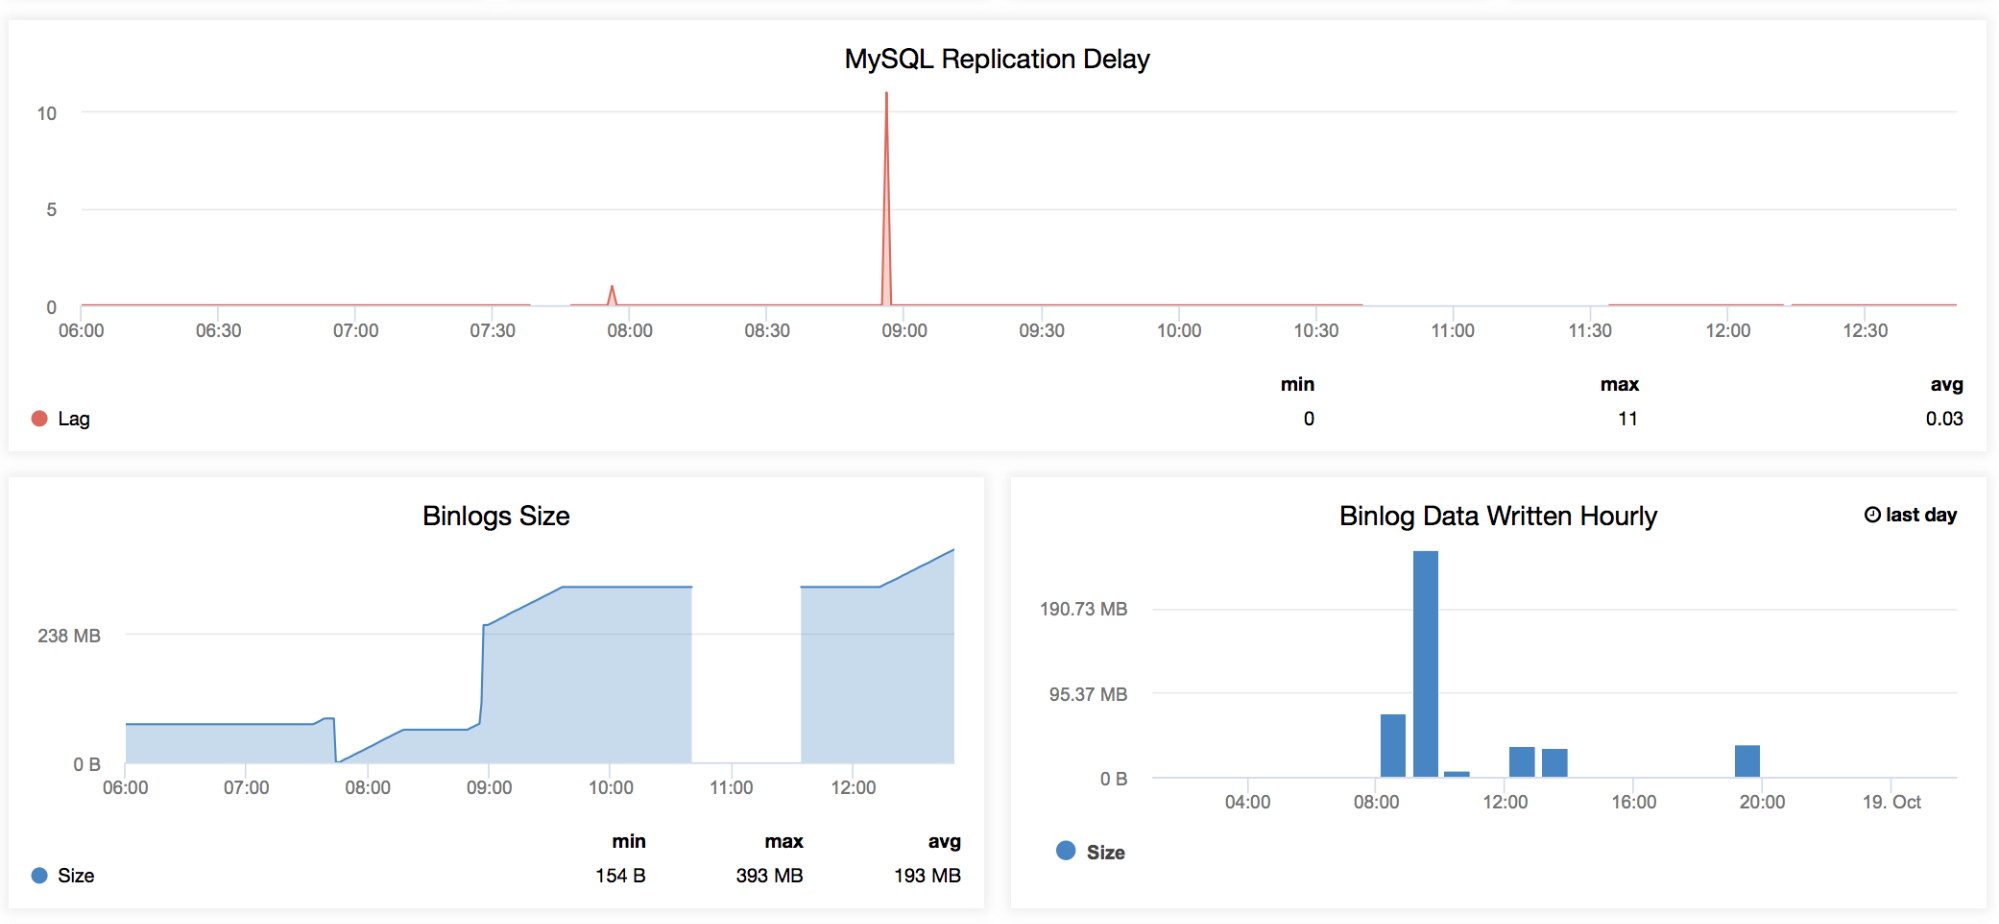
MySQL Replication Delay
This graph is very familiar to anybody managing MySQL, especially those who are working on a daily basis on their master-slave setup. This graph has the trends for all the lags recorded for a specific time range specified in this dashboard. Whenever we want to check the periodic fall time that our replica has, then this graph is good to look at. There are certain occasions that a replica could lag for odd reasons like your RAID has a degraded BBU and needs a replacement, a table has no unique key but not on the master, an unwanted full table scan or full index scan, or a bad query was left running by a developer. This is also a good indicator to determine if slave lag is a key issue, then you may want to take advantage of parallel replication. -
Binlog Size
These graphs are related to each other. The Binlog Size graph shows you how your node generates the binary log and helps determine its dimension based on the period of time you are scanning. -
Binlog Data Written Hourly
The Binlog Data Written Hourly is a graph based on the current day and the previous day recorded. This might be useful whenever you want to identify how large your node is that is accepting writes, which you can later use for capacity planning.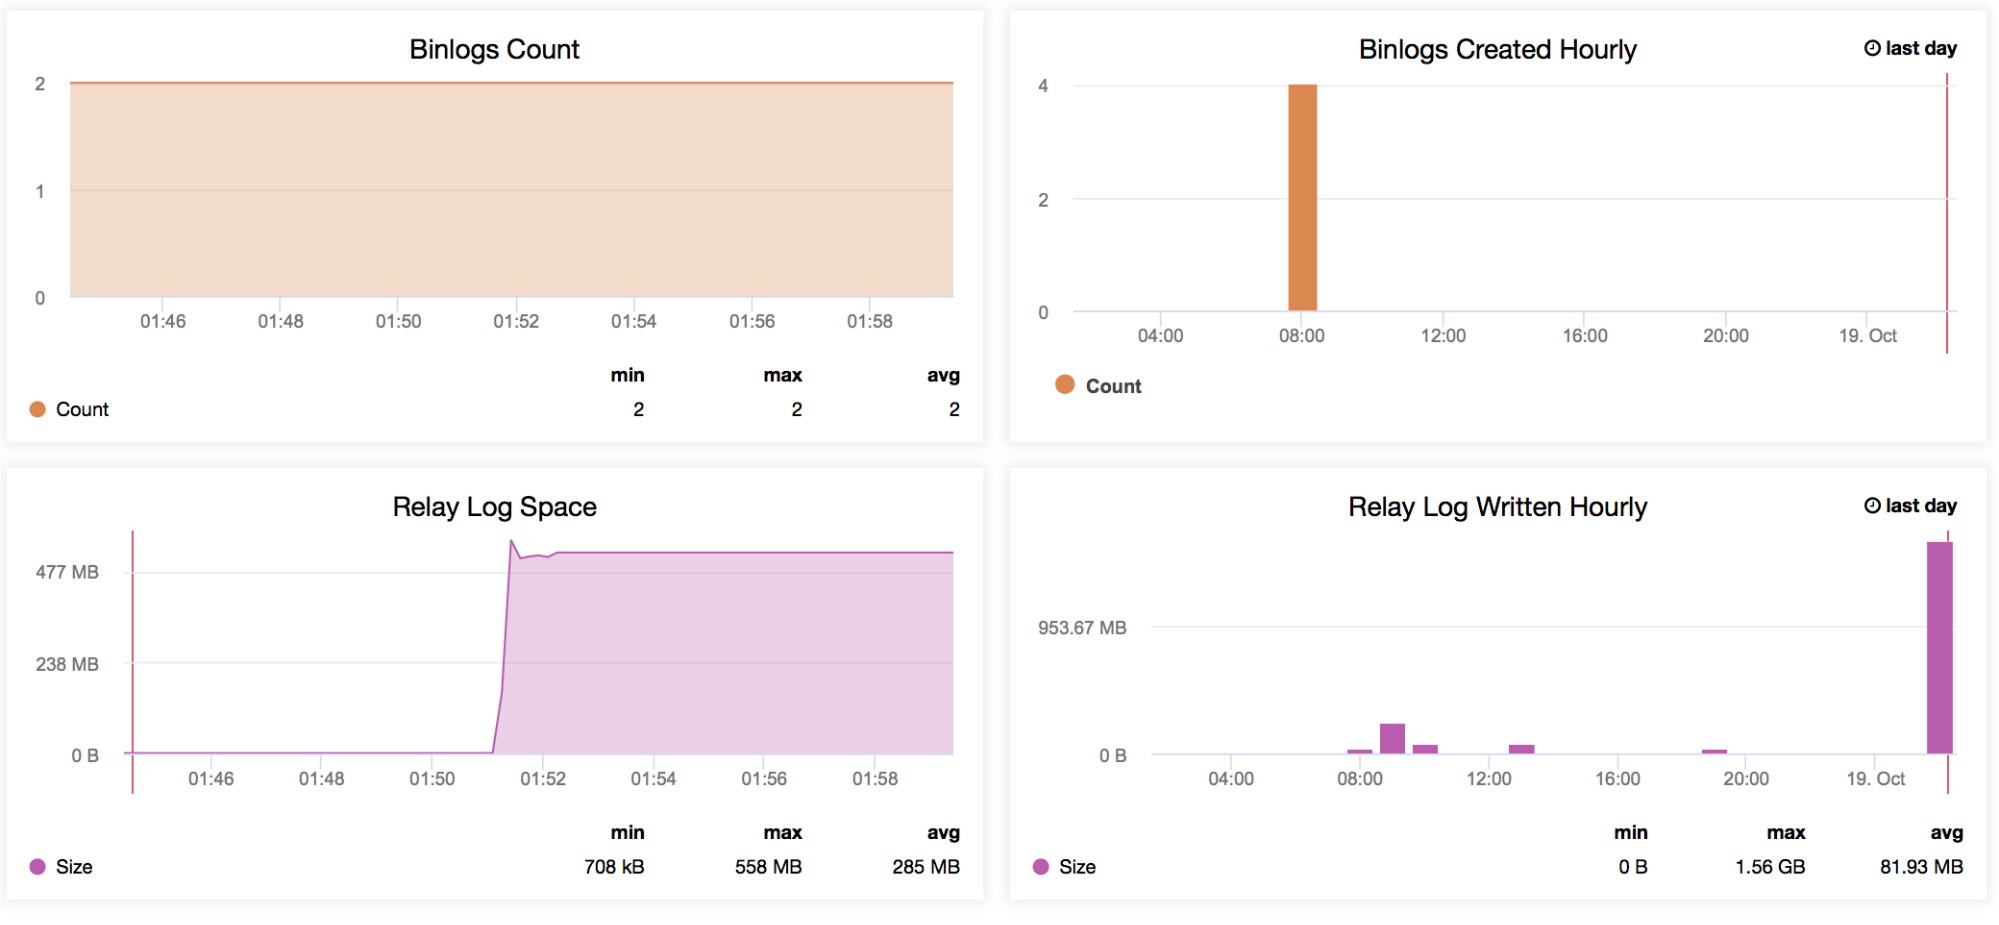
-
Binlogs Count
Let’s say you expect high traffic for a given week. You want to compare how large writes are going through your master and slaves with the previous week. This graph is very useful for this kind of situation – To determine how high the generated binary logs were on the master itself or even on the slaves if log_slave_updates variable is enabled. You may also use this indicator to determine your master vs slaves binary log data generated, especially if you are filtering some tables or schemas (replicate_ignore_db, replicate_ignore_table, replicate_wild_do_table) on your slaves that were generated while log_slave_updates is enabled. -
Binlogs Created Hourly
This graph is a quick overview to compare your binlogs creation hourly from yesterday and today’s date. -
Relay Log Space
This graph serves as the basis of the generated relay logs from your replica. When used along with the MySQL Replication Delay graph, it helps determine how large the number of relay logs generated is, which the administrator has to consider in terms of disk availability of the current replica. It can cause trouble when your slave is rigorously lagging, and is generating large numbers of relay logs. This can consume your disk space quickly. There are certain situations that, due to a high number of writes from the master, the slave/replica will lag tremendously, thus generating a large amount of logs can cause some serious problems on that replica. This can help the ops team when talking to their management about capacity planning. -
Relay Log Written Hourly
Same as the Relay Log Space but adds a quick overview to compare your relay logs written from yesterday and today’s date.
Conclusion
You learned that using SCUMM to monitor your MySQL Replication adds more productivity and efficiency to the operations team. Using the features we have from previous versions combined with the graphs provided with SCUMM is like going to the gym and seeing massive improvements in your productivity. This is what SCUMM can offer: monitoring on steroids! (now, we are not advocating that you should take steroids when going to the gym!)
In Part 3 of this blog, I will discuss the InnoDB Metrics and MySQL Performance Schema Dashboards.


