blog
Digging Deeper into ClusterControl’s Performance Advisors

If you are a frequent reader of the Severalnines’ database blog, you have probably noticed that Severalnines’ crew talks about performance of databases pretty frequently. Part of that is because of ClusterControl – the flagship Severalnines’ product – but another part of it is just because monitoring the performance of your open source databases is so important. In this blog post we will dig deeper into ClusterControl’s performance advisors and tell you what can ClusterControl do for you in this space in a little more detail.
Why Monitor Performance?
If you are a developer, you probably already know how important it is to keep an eye out on your database instances at all times – one step in the wrong direction and your databases will be in turmoil: improper monitoring of your database clusters can be the primary cause of downtime other issues for both you and your business. If you are a database administrator, monitoring the performance of your database instances is probably one of the key things you do every day – for you, it’s even more important.
How to Monitor Performance?
If you are a database administrator, you are probably already familiar with some of the ways that you can use to monitor your database performance. You can either accomplish everything manually if you so desire, or you can also use tools provided by your software vendors (you can use tools provided by MariaDB, MySQL, Percona, MongoDB, TimescaleDB and the like) – one of those tools is also developed by Severalnines – that’s ClusterControl.
ClusterControl can be useful in a wide variety of scenarios: we can use the tool to get an overview of the things happening in our database clusters, we can observe the amount and layout of our database nodes, we can observe our database cluster topology, we can see the amount of long-running queries, database connections and query outliers, ClusterControl can help us back up our database instances – we can either create or schedule a backup. We can even manage our hosts, database configurations, deploy or import load balancers, manage our database users and schemas, manage scripts in our database instances, or you can use tags to allow for tagging and searching of clusters. Also, you can enable or disable SSL encryption, observe all of the alarms in your database cluster and be informed when some jobs run successfully or fail.
Why Keep an Eye on Performance Advisors?
We have explained what can ClusterControl do for your business above – however, if you have used ClusterControl extensively, chances are that you already know all of the things ClusterControl can do for your business and want to dig deeper into one of them. We will do that now.
Launch ClusterControl, log into the service, and you will be able to see a Performance tab at the top. Hover over it and you should see Advisors readily accessible to you – click on it:
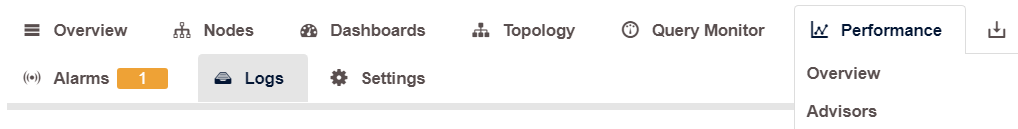
Once you click on the link,
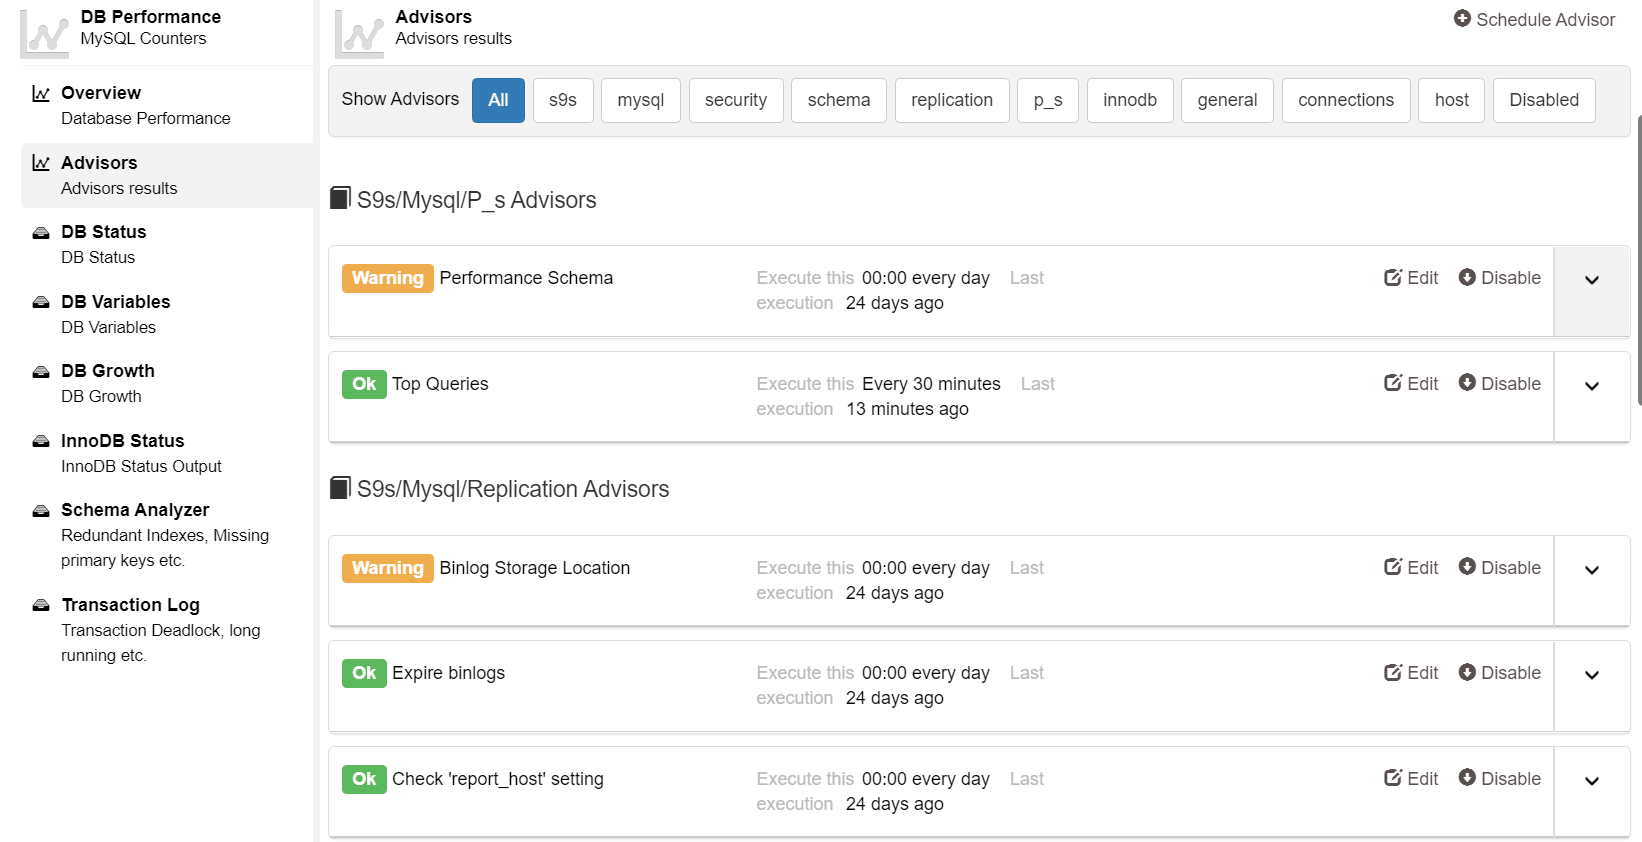
As you might see, performance advisors are divided into a few different categories: you can observe the performance of your MySQL instances, you can dive deeper into security, schema, replication, the performance schema, InnoDB, general advisors, advisors that let you observe connection information, host advisors as well. All of these advisors can either be enabled or disabled too.
For example, filter advisors by MySQL and you will be able to only see advisors relevant to MySQL:
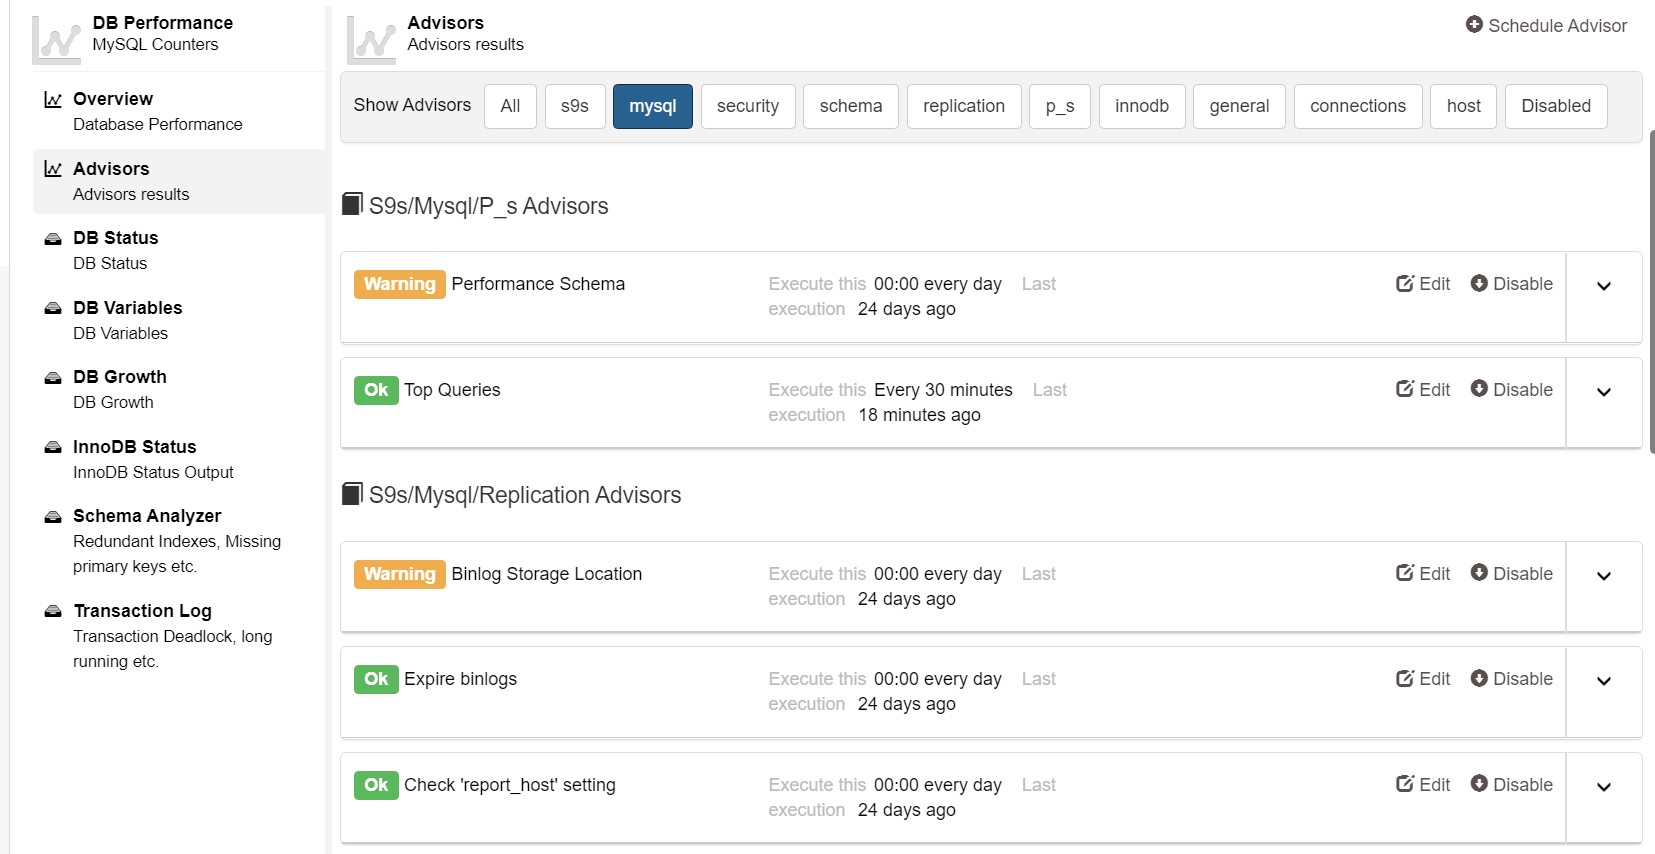
MySQL, in this space, has a few areas that ClusterControl takes care of:
-
Performance schema advisors let you know whether it’s enabled or disabled.
-
The top queries advisor provides information about top slow or long-running queries.
In the replication space, we have three advisors:
-
ClusterControl provides us with information about the binary log storage location.
-
We are able to see when our binary logs expire.
-
ClusterControl is able to check the status of the report host setting – this setting reports some information to the source during replica registration.
If we scroll down, we are also able to see connection advisors, general advisors, InnoDB advisors, as well as schema and security advisors:
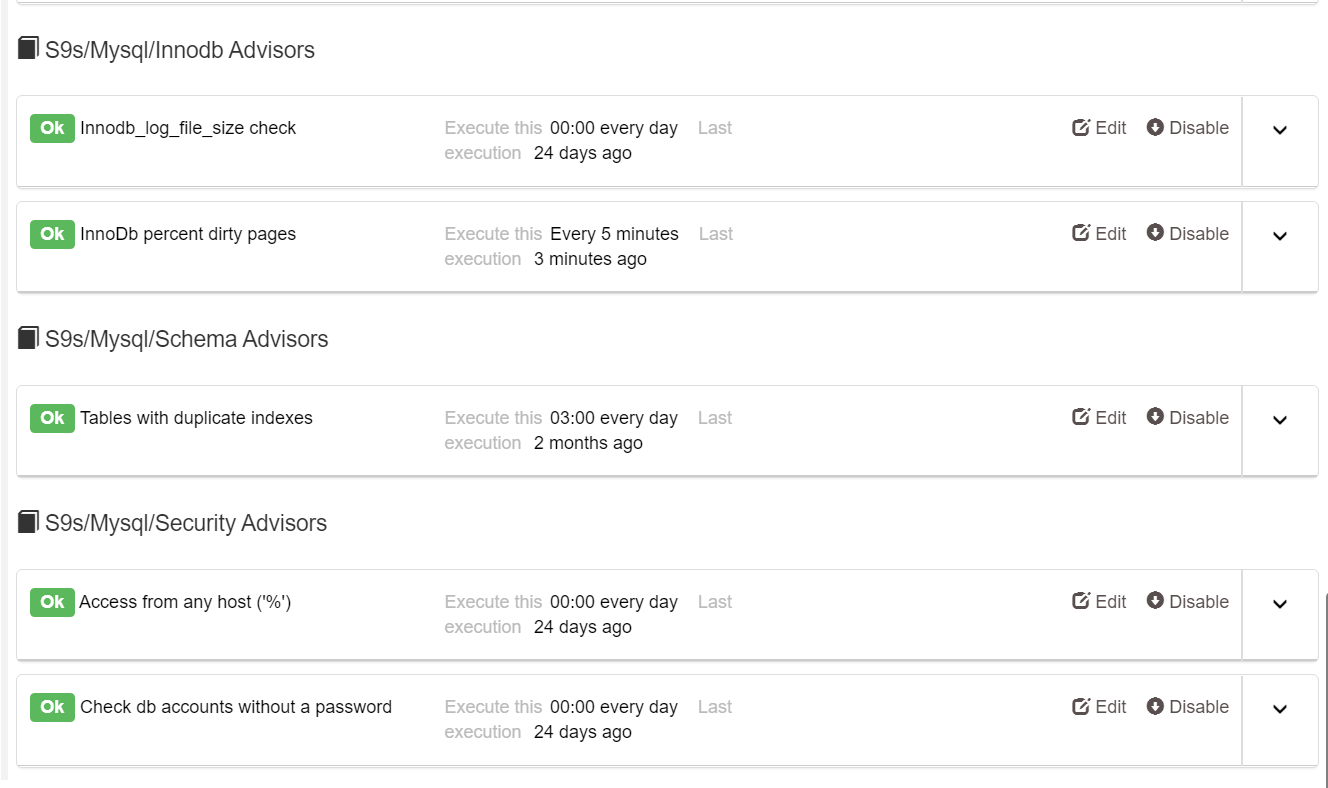
In this case, for example, ClusterControl is able to inform you:
-
Whether your InnoDB log file size is greater than the log produced per hour allowing you to see whether the InnoDB log file size is sized correctly.
-
An advisor below is able to check for tables with duplicate indexes (duplicate indexes might waste disk space and have an impact on performance too)
-
An advisor below is able to see whether your MySQL instances have any accounts allowed to connect from any host or user: doing so is a bad idea security-wise.
-
ClusterControl in this space also checks whether your database instances have any accounts that do not have a password set up: in this case, consider setting up a password for every account that you use together with your database instance – not doing so puts your business (and your database) at a tremendous risk – in that case, anyone who is able to access a login page for the management of your database instances (for example, anyone who is able to access phpMyAdmin) would be able to log in without needing a password.
In general, performance advisors provided by ClusterControl can save your database instances from all kinds of disasters ranging from monitoring whether the performance of your queries is up to par and you do not have any tables with duplicate indexes that might have an impact on performance to monitoring your CPU and disk space usage. With that being said, if you don’t seem to find the one performance advisor that might be the right fit for your database, you can also customize them and design one yourself – just click on the Edit icon on the right side of the performance advisor:

Once there, you will be able to see the available scripts in the so-called “Developer Studio” – new scripts can be created, imported or exported too. To modify a specific performance advisor, navigate to what you want to modify, then click on the file name:
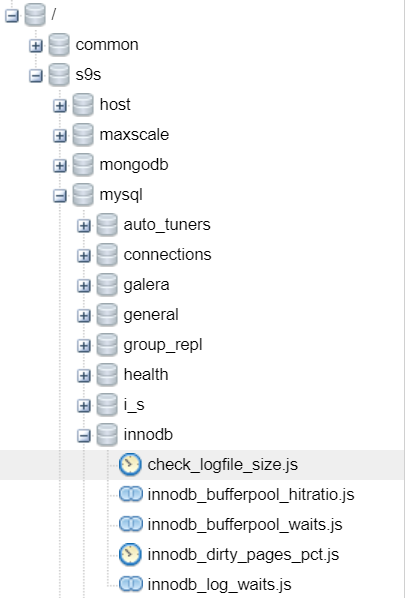
Once you have chosen the file, you can compile your job, compile and run it, schedule it or disable it altogether. If you elect to modify it, though, make sure you know some javascript – you are going to need it!
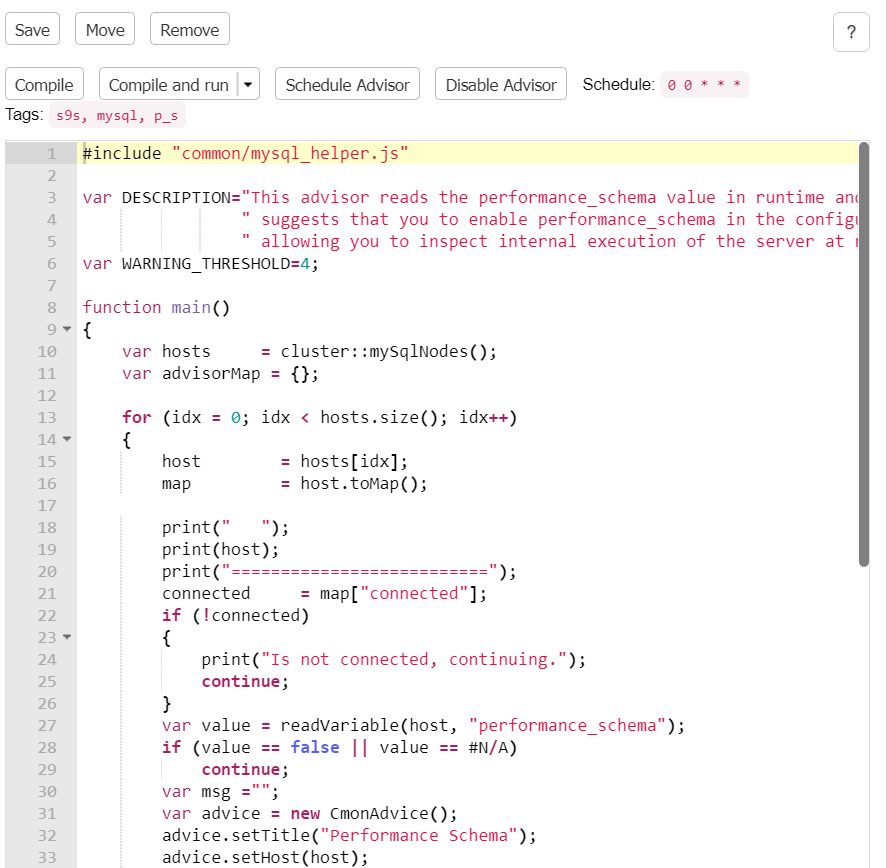
If we dissect a performance advisor present in ClusterControl, we can see that performance advisors, in general, begin with a description of themselves and a warning threshold. Then we have a function that actually defines what the performance advisor is supposed to do: in this case, the performance advisor is able to check whether the size of the InnoDB buffer pool is small or not.
Some performance advisors are simple, others are more complex. For example, observe the query cache hitratio advisor and you will be able to see that that advisor calculates the ratio of query cache hits over the sum of query cache hits and inserts and also provides recommendations for developers and DBAs to configure the query cache size correctly. If everything is done correctly, the advisor will provide a benefit for users with read-intensive workloads.
Creating advisors is hard – for that you need both good javascript knowledge, some knowledge about ClusterControl and, on top of that, you need to be intimately familiar with the functionality of your database clusters, but once you practice and create your first performance advisor, moving forward with the rest will be a piece of cake!
Summary
Monitoring the performance of your database clusters isn’t the easiest of tasks. In order to do that, you must be intimately familiar with the functionality of your database instances, and know what you need to monitor in order to push your database performance to the max in the first place. However, fear not – ClusterControl’s performance advisors can steer you in the right direction. We hope that this blog post has opened your eyes into the ClusterControl performance advisor world and helped you understand what performance advisors do – if you are still not sure, though, give ClusterControl a try yourself and find out.


