blog
ClusterControl Performance and Health Monitoring

In the previous two blog posts we covered both deploying the four types of clustering/replication (MySQL/Galera, MySQL Replication, MongoDB & PostgreSQL) and managing/monitoring your existing databases and clusters. So, after reading these two first blog posts you were able to add your 20 existing replication setups to ClusterControl, expand them and additionally deployed two new Galera clusters while doing a ton of other things. Or maybe you deployed MongoDB and/or PostgreSQL systems. So now, how do you keep them healthy?
That’s exactly what this blog post is about: how to leverage ClusterControl performance monitoring and advisors functionality to keep your MySQL, MongoDB and/or PostgreSQL databases and clusters healthy. So how is this done in ClusterControl?
Database Cluster List
The most important information can already be found in the cluster list: as long as there are no alarms and no hosts are shown to be down, everything is functioning fine. An alarm is raised if a certain condition is met, e.g. host is swapping, and brings to your attention the issue you should investigate. That means that alarms not only are raised during an outage but also to allow you to proactively manage your databases.
Suppose you would log into ClusterControl and see a cluster listing like this, you will definitely have something to investigate: one node is down in the Galera cluster for example and every cluster has various alarms:
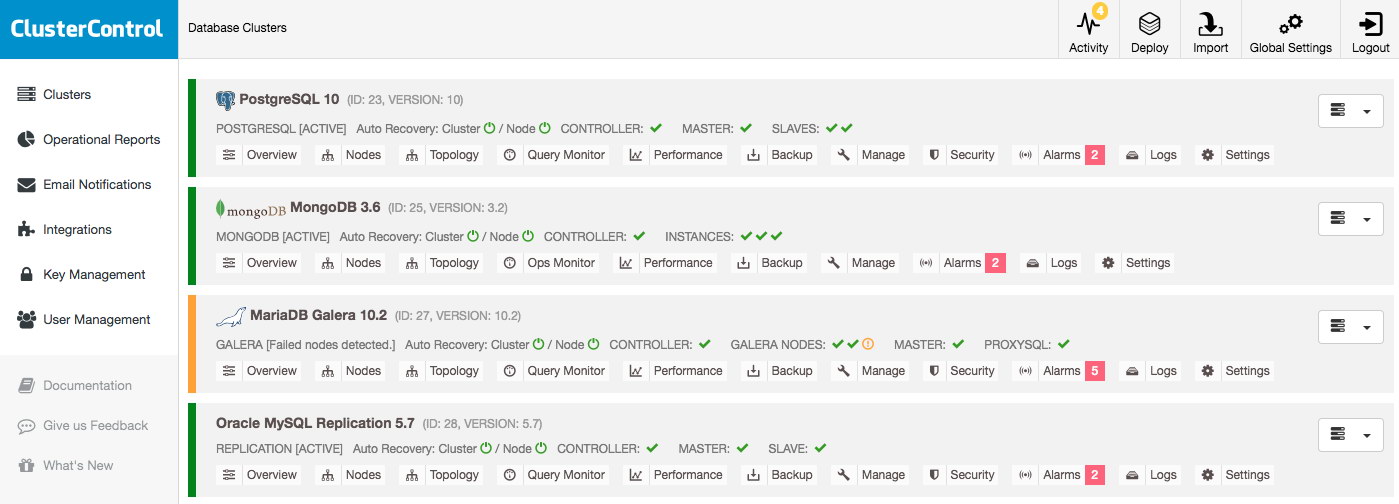
Once you click on one of the alarms, you will go to a detailed page on all alarms of the cluster. The alarm details will explain the issue and in most cases also advise the action to resolve the issue.
You can set up your own alarms by creating custom expressions, but that has been deprecated in favor of our new Developer Studio that allows you to write custom Javascripts and execute these as Advisors. We will get back to this topic later in this post.
Cluster Overview – Dashboards
When opening up the cluster overview, we can immediately see the most important performance metrics for the cluster in the tabs. This overview may differ per cluster type as, for instance, Galera has different performance metrics to watch than traditional MySQL, PostgreSQL or MongoDB.
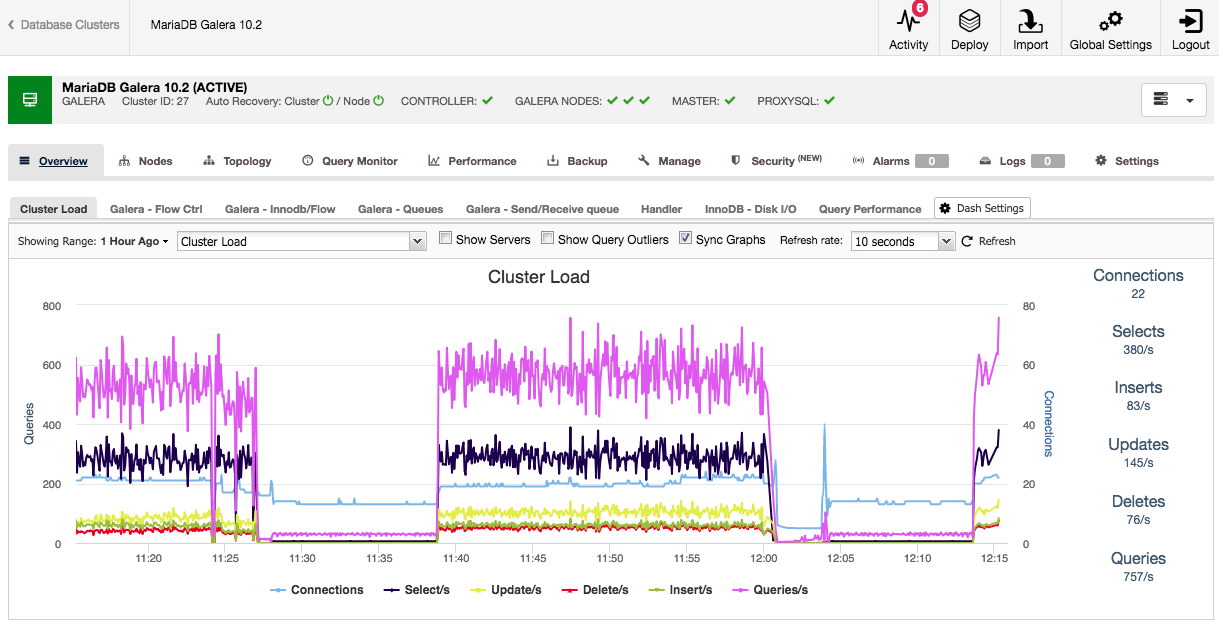
Both the default overview and the pre-selected tabs are customizable. By clicking on Overview -> Dash Settings you are given a dialogue that allows you to define the dashboard:
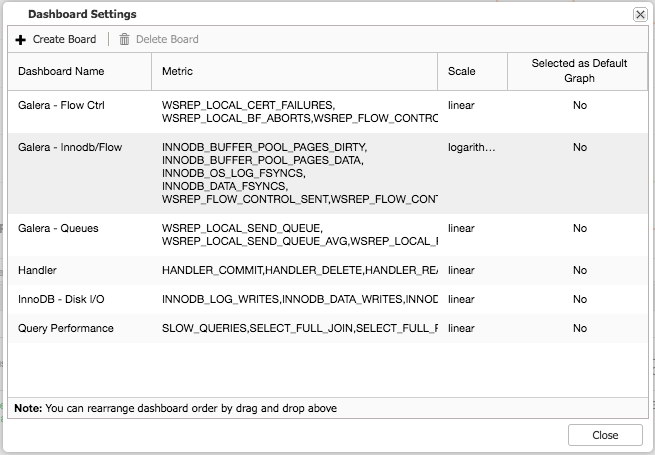
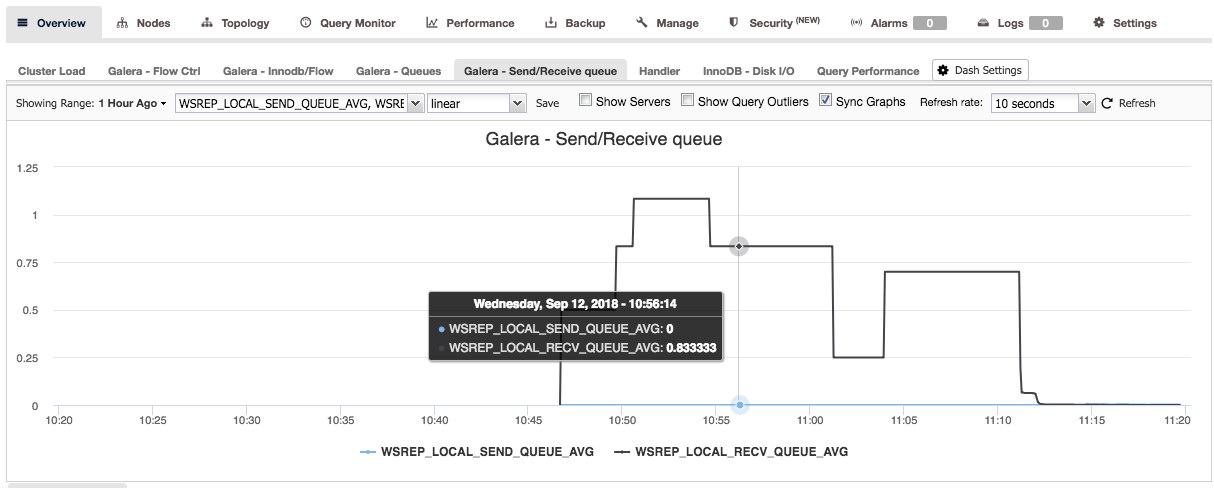
By pressing the plus sign you can add and define your own metrics to graph the dashboard. In our case we will define a new dashboard featuring the Galera specific send and receive queue average:
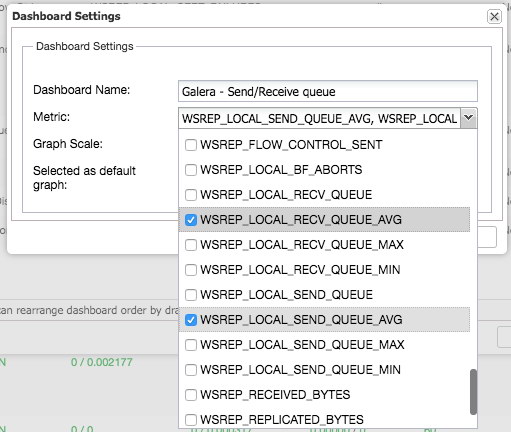
This new dashboard should give us good insight in the average queue length of our Galera cluster.
Once you have pressed save, the new dashboard will become available for this cluster:
Similarly you can do this for PostgreSQL as well, for example we can monitor the shared blocks hit versus blocks read:
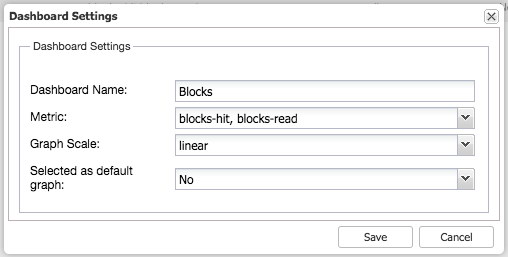
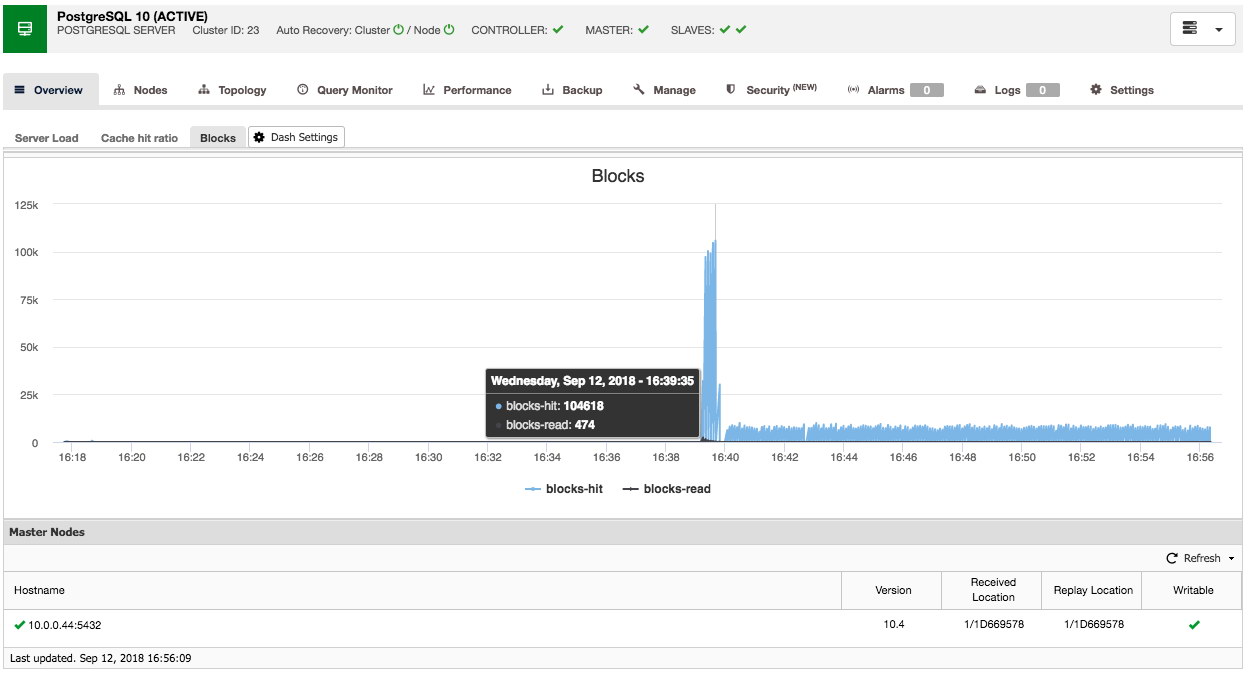
So as you can see, it is relatively easy to customize your own (default) dashboard.
Cluster Overview – Query Monitor
The Query Monitor tab is available for both MySQL and PostgreSQL based setups and consists out of three dashboards: Top Queries, Running Queries and Query Outliers.
In the Running Queries dashboard, you will find all current queries that are running. This is basically the equivalent of SHOW FULL PROCESSLIST statement in MySQL database.
Top Queries and Query Outliers both rely on the input of the slow query log or Performance Schema. Using Performance Schema is always recommended and will be used automatically if enabled. Otherwise, ClusterControl will use the MySQL slow query log to capture the running queries. To prevent ClusterControl from being too intrusive and the slow query log to grow too large, ClusterControl will sample the slow query log by turning it on and off. This loop is by default set to 1 second capturing and the long_query_time is set to 0.5 seconds. If you wish to change these settings for your cluster, you can change this via Settings -> Query Monitor.
Top Queries will, like the name says, show the top queries that were sampled. You can sort them on various columns: for instance the frequency, average execution time, total execution time or standard deviation time:
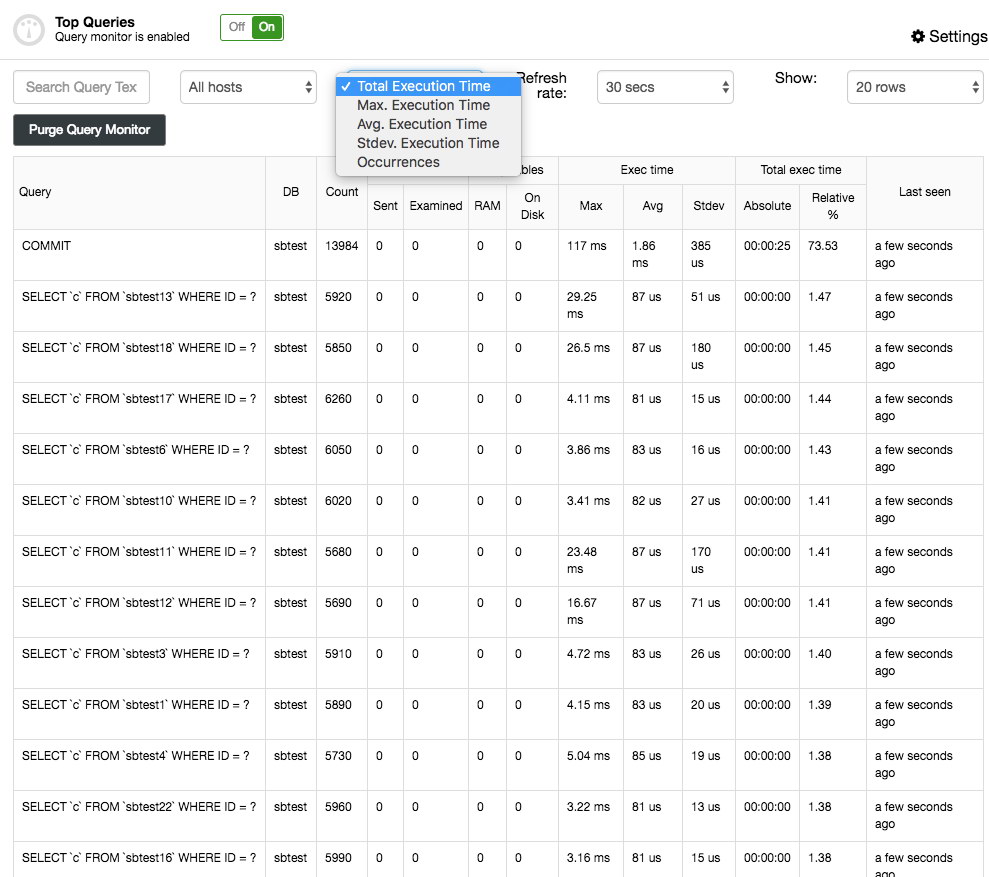
You can get more details about the query by selecting it and this will present the query execution plan (if available) and optimization hints/advisories. The Query Outliers is similar to the Top Queries but then allows you to filter the queries per host and compare them in time.
Cluster Overview – Operations
Similar to the PostgreSQL and MySQL systems the MongoDB clusters have the Operations overview and is similar to the MySQL’s Running Queries. This overview is similar to issuing the db.currentOp() command within MongoDB.
Cluster Overview – Performance
MySQL/Galera
The performance tab is probably the best place to find the overall performance and health of your clusters. For MySQL and Galera it consists of an Overview page, the Advisors, status/variables overviews, the Schema Analyzer and the Transaction log.
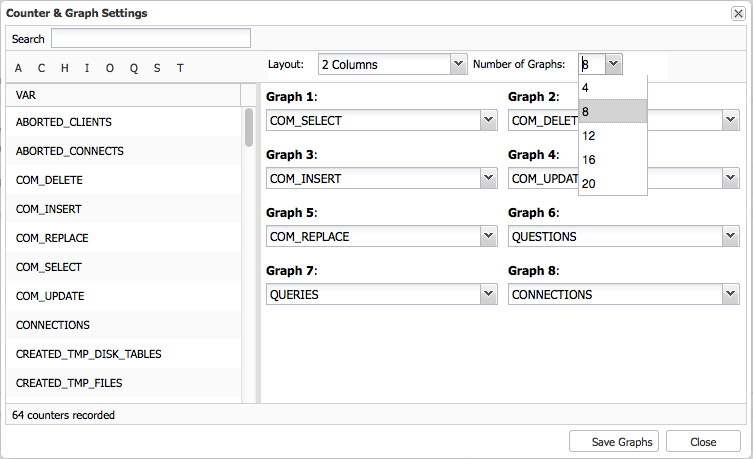
The Overview page will give you a graph overview of the most important metrics in your cluster. This is, obviously, different per cluster type. Eight metrics have been set by default, but you can easily set your own – up to 20 graphs if needed:
The Advisors is one of the key features of ClusterControl: the Advisors are scripted checks that can be run on demand. The advisors can evaluate almost any fact known about the host and/or cluster and give its opinion on the health of the host and/or cluster and even can give advice on how to resolve issues or improve your hosts!
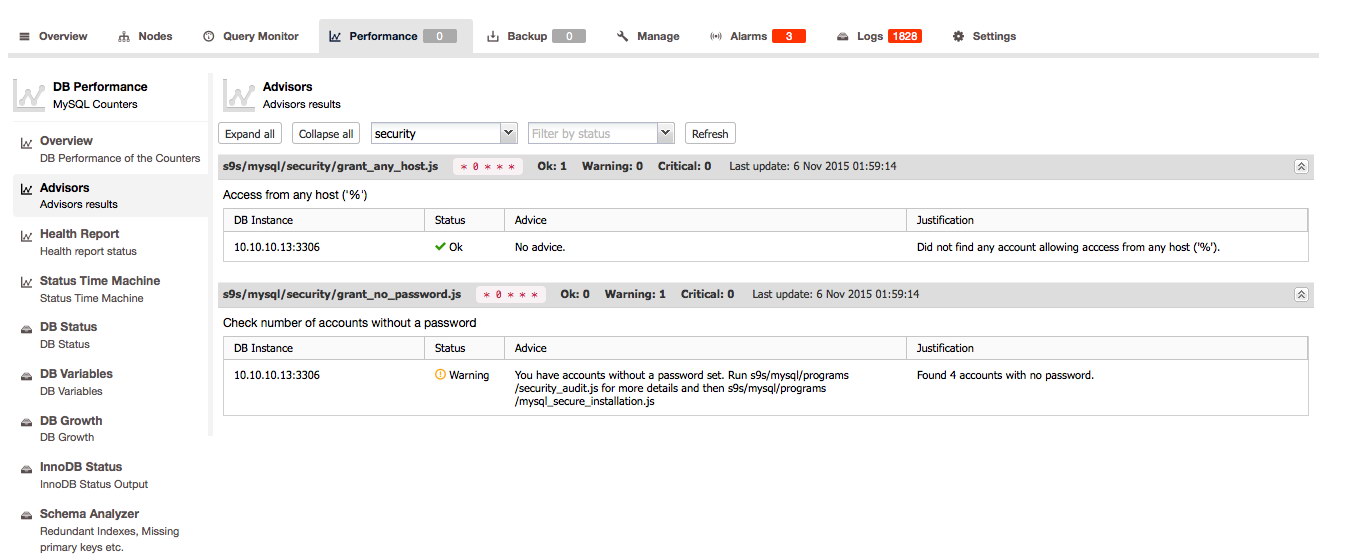
The best part is yet to come: you can create your own checks in the Developer Studio (ClusterControl -> Manage -> Developer Studio), run them on a regular interval and use them again in the Advisors section. We blogged about this new feature earlier this year.
We will skip the status/variables overview of MySQL and Galera as this is useful for reference but not for this blog post: it is good enough that you know it is here.
Now suppose your database is growing but you want to know how fast it grew in the past week. You can actually keep track of the growth of both data and index sizes from right within ClusterControl:
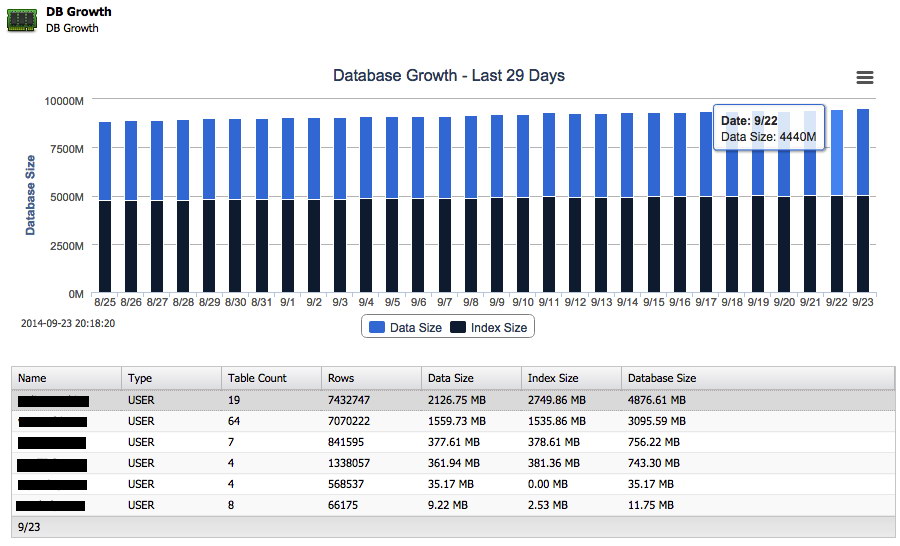
And next to the total growth on disk it can also report back the top 25 largest schemas.
Another important feature is the Schema Analyzer within ClusterControl:

ClusterControl will analyze your schemas and look for redundant indexes, MyISAM tables and tables without a primary key. Of course it is entirely up to you to keep a table without a primary key because some application might have created it this way, but at least it is great to get the advice here for free. The Schema Analyzer even recommends the necessary ALTER statement to fix the problem.
PostgreSQL
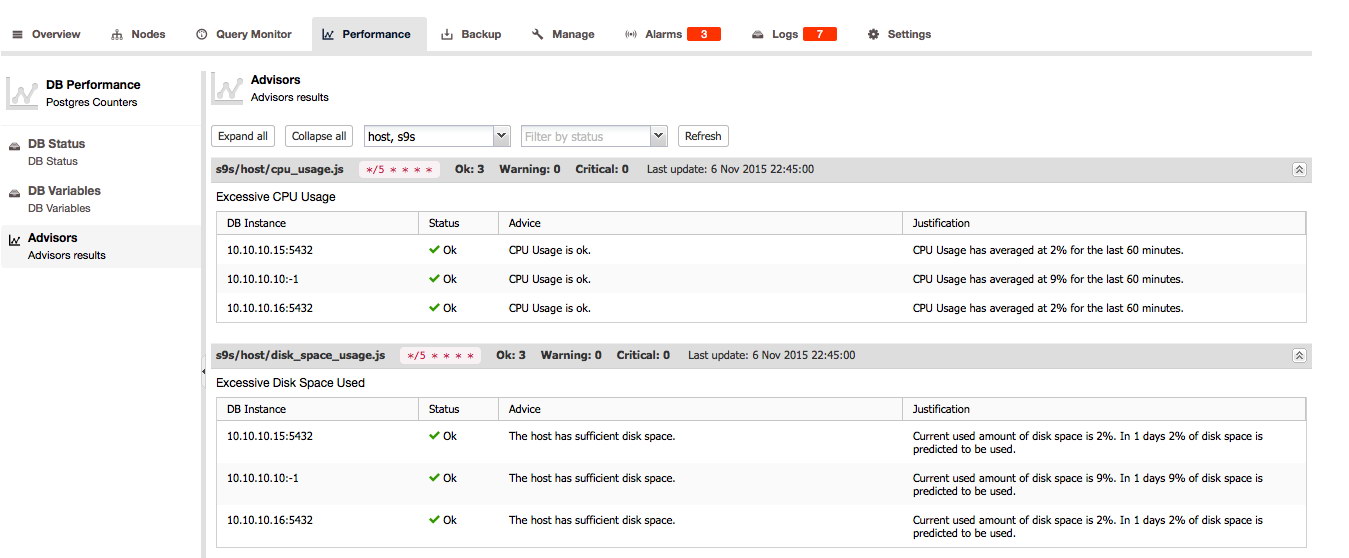
For PostgreSQL the Advisors, DB Status and DB Variables can be found here:
MongoDB
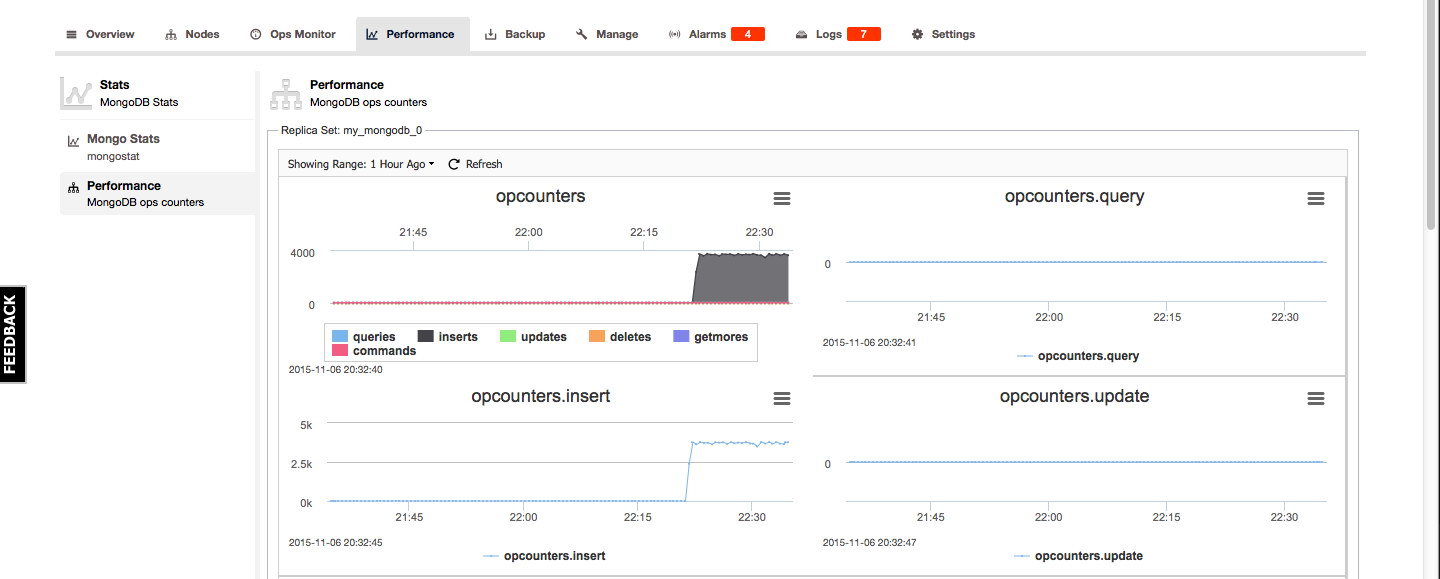
For MongoDB the Mongo Stats and performance overview can be found under the Performance tab. The Mongo Stats is an overview of the output of mongostat and the Performance overview gives a good graphical overview of the MongoDB opcounters:

Final Thoughts
We showed you how to keep your eyeballs on the most important monitoring and health checking features of ClusterControl. Obviously this is only the beginning of the journey as we will soon start another blog series about the Developer Studio capabilities and how you can make most of your own checks. Also keep in mind that our support for MongoDB and PostgreSQL is not as extensive as our MySQL toolset, but we are continuously improving on this.
You may ask yourself why we have skipped over the performance monitoring and health checks of HAProxy, ProxySQL and MaxScale. We did that deliberately as the blog series covered only deployments of clusters up till now and not the deployment of HA components. So that’s the subject we’ll cover next time.


