blog
Automate Database Schema Object Check

Monitoring your database schema changes in MySQL/MariaDB provides a huge help as it saves time analyzing your database growth, table definition changes, data size, index size, or row size. For MySQL/MariaDB, running a query referencing information_schema together with performance_schema gives you collective results for further analysis. The sys schema provides you views that serve as collective metrics that are very useful for tracking database changes or activity.
If you have many database servers, it would be tedious to run a query all the time. You also have to digest that result into a more readable and easier to understand.
In this blog, we’ll create an automation that would be helpful as your utility tool to have for your existing database to be monitored and collect metrics regarding database changes or schema change operations.
Creating Automation for Database Schema Object Check
In this exercise, we will monitor the following metrics:
-
No primary key tables
-
Duplicate indexes
-
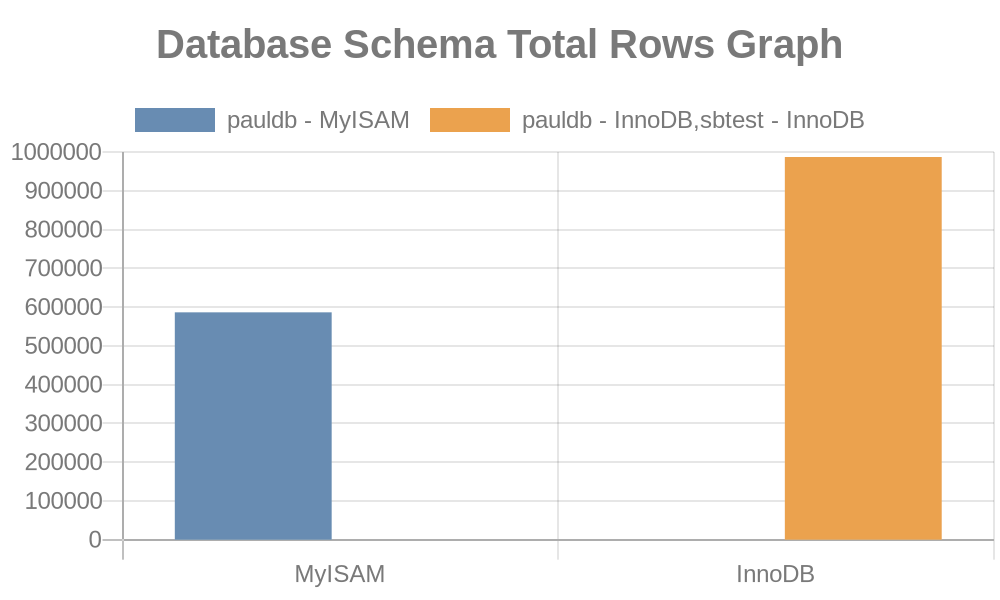
Generate a graph for total number of rows in our database schemas
-
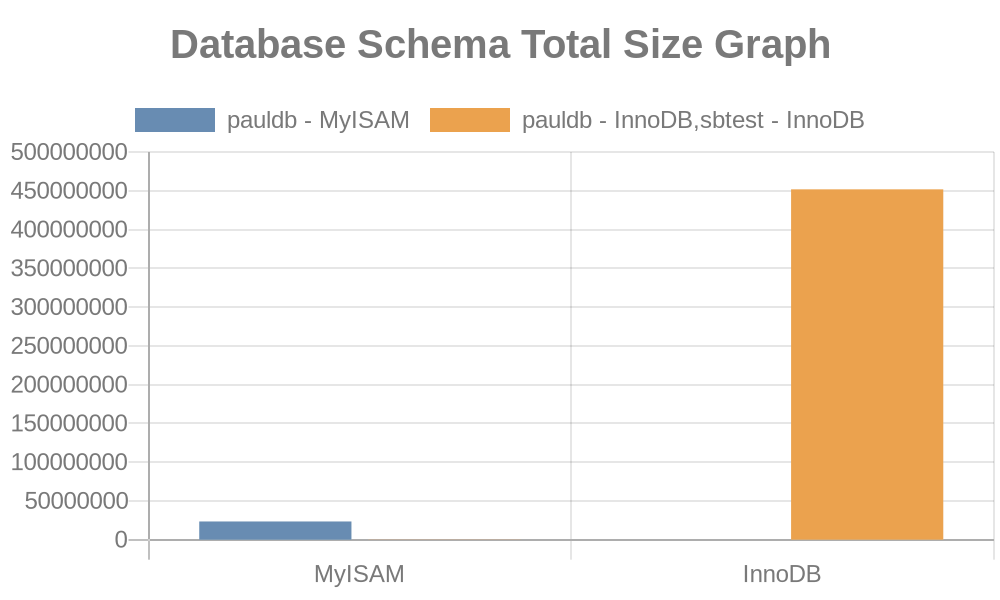
Generate a graph for total size of our database schemas
This exercise will give you a heads up and can be modified to gather more advanced metrics from your MySQL/MariaDB database.
Using Puppet for our IaC and Automation
This exercise shall use Puppet to provide automation and generate the expected results based on the metrics we want to monitor. We’ll not cover the installation and setup for the Puppet, including server and client, so I expect you to know how to use Puppet. You might want to visit our old blog Automated Deployment of MySQL Galera Cluster to Amazon AWS with Puppet, which covers the setup and installation of Puppet.
We’ll use the latest version of Puppet in this exercise but since our code consists of basic syntax, it would run for older versions of Puppet.
Preferred MySQL Database Server
In this exercise, we’ll use Percona Server 8.0.22-13 since I prefer Percona Server mostly for testing and some minor deployments either business or personal use.
Graphing Tool
There are tons of options to use especially using the Linux environment. In this blog, I’ll use the easiest that I found and an opensource tool https://quickchart.io/.
Let’s Play with Puppet
The assumption i have made here is that you have setup master server with registered client which is ready to communicate with the master server to receive automatic deployments.
Before we proceed, here’s the my server information:
Master server: 192.168.40.200
Client/Agent Server: 192.168.40.160
In this blog, our client/agent server is where our database server is running.In a real-world scenario, it doesn’t have to be especially for monitoring. As long as it’s able to communicate into the target node securely, then that is a perfect setup as well.
Setup the Module and the Code
-
Go to the master server and in the path /etc/puppetlabs/code/environments/production/module, let’s create the required directories for this exercise:
mkdir schema_change_mon/{files,manifests}
-
Create the files that we need
touch schema_change_mon/files/graphing_gen.sh
touch schema_change_mon/manifests/init.pp
-
Fill-up the init.pp script with the following content:
class schema_change_mon (
  $db_provider = "mysql",
  $db_user = "root",
  $db_pwd = "R00tP@55",
  $db_schema = []
) {

$dbs = ['pauldb', 'sbtest']
service { $db_provider :
ensure       => running,
enable       => true,
hasrestart   => true,
hasstatus    => true
}
exec { "mysql-without-primary-key" :
require     => Service['mysql'],
command => "/usr/bin/sudo MYSQL_PWD="${db_pwd}" /usr/bin/mysql -u${db_user} -Nse "select concat(tables.table_schema,'.',tables.table_name,', ', tables.engine) from information_schema.tables left join ( select table_schema , table_name from information_schema.statistics group by table_schema , table_name , index_name having  sum( case  when non_unique = 0  and nullable != 'YES' then 1  else 0  end ) = count(*) ) puks on tables.table_schema = puks.table_schema and tables.table_name = puks.table_name where puks.table_name is null and tables.table_type = 'BASE TABLE' and tables.table_schema not in ('performance_schema',  'information_schema', 'mysql');" >> /opt/schema_change_mon/assets/no-pk.log"
}
$dbs.each |String $db| {
exec { "mysql-duplicate-index-$db" :
require     => Service['mysql'],
command => "/usr/bin/sudo MYSQL_PWD="${db_pwd}" /usr/bin/mysql -u${db_user} -Nse "SELECT concat(t.table_schema,'.', t.table_name, '.', t.index_name, '(', t.idx_cols,')') FROM ( SELECT table_schema, table_name, index_name, Group_concat(column_name) idx_cols FROM ( SELECT table_schema, table_name, index_name, column_name FROM statistics WHERE table_schema='${db}' ORDER BY index_name, seq_in_index) t GROUP BY table_name, index_name) t JOIN ( SELECT table_schema, table_name, index_name, Group_concat(column_name) idx_cols FROM ( SELECT table_schema, table_name, index_name, column_name FROM statistics WHERE table_schema='pauldb' ORDER BY index_name, seq_in_index) t GROUP BY table_name, index_name) u where t.table_schema = u.table_schema AND t.table_name = u.table_name AND t.index_name<>u.index_name AND locate(t.idx_cols,u.idx_cols);" information_schema >> /opt/schema_change_mon/assets/dupe-indexes.log"
}
}

$genscript = "/tmp/graphing_gen.sh"
file { "${genscript}" :
ensure => present,
owner  => root,
group  => root,
mode   => '0655',
source => 'puppet:///modules/schema_change_mon/graphing_gen.sh'
}
exec { "generate-graph-total-rows" :
require     => [Service['mysql'],File["${genscript}"]],
path =>  [ '/bin/', '/sbin/' , '/usr/bin/', '/usr/sbin/' ],
provider => "shell",
logoutput => true,
command => "/tmp/graphing_gen.sh total_rows"
}
exec { "generate-graph-total-len" :
require  => [Service['mysql'],File["${genscript}"]],
path =>  [ '/bin/', '/sbin/' , '/usr/bin/', '/usr/sbin/' ],
provider => "shell",
logoutput => true,
command => "/tmp/graphing_gen.sh total_len"
}
}
-
Fill up the graphing_gen.sh file. This script will run on the target node and generate graphs for the total number of rows in our database and also total size of our database. For this script, let’s make it simpler ,and allow only MyISAM or InnoDB type of databases.
#!/bin/bash
graph_ident="${1:-total_rows}"
unset json myisam innodb nmyisam ninnodb; json='' myisam='' innodb='' nmyisam='' ninnodb='' url=''; json=$(MYSQL_PWD="R00tP@55" mysql -uroot -Nse "select json_object('dbschema', concat(table_schema,' - ', engine), 'total_rows', sum(table_rows), 'total_len', sum(data_length+data_length), 'fragment', sum(data_free)) from information_schema.tables where table_schema not in ('performance_schema', 'sys', 'mysql', 'information_schema') and engine in ('myisam','innodb') group by table_schema, engine;" | jq . |  sed ':a;N;$!ba;s/n//g' | sed 's|}{|},{|g' | sed 's/^/[/g'| sed 's/$/]/g' | jq '.' ); innodb=""; myisam=""; for r in $(echo $json | jq 'keys | .[]'); do if [[ $(echo $json| jq .[$r].'dbschema') == *"MyISAM"* ]]; then nmyisam=$(echo $nmyisam || echo '')$(echo $json| jq .[$r]."${graph_ident}")','; myisam=$(echo $myisam || echo '')$(echo $json| jq .[$r].'dbschema')','; else ninnodb=$(echo $ninnodb || echo '')$(echo $json| jq .[$r]."${graph_ident}")','; innodb=$(echo $innodb || echo '')$(echo $json| jq .[$r].'dbschema')','; fi; done; myisam=$(echo $myisam|sed 's/,$//g'); nmyisam=$(echo $nmyisam|sed 's/,$//g'); innodb=$(echo $innodb|sed 's/,$//g');ninnodb=$(echo $ninnodb|sed 's/,$//g'); echo $myisam "|" $nmyisam; echo $innodb "|" $ninnodb; url=$(echo "{type:'bar',data:{labels:['MyISAM','InnoDB'],datasets:[{label:[$myisam],data:[$nmyisam]},{label:[$innodb],data:[$ninnodb]}]},options:{title:{display:true,text:'Database Schema Total Rows Graph',fontSize:20,}}}"); curl -L -o /vagrant/schema_change_mon/assets/db-${graph_ident}.png -g https://quickchart.io/chart?c=$(python -c "import urllib,os,sys; print urllib.quote(os.environ['url'])")
-
Lastly, go to the module path directory or /etc/puppetlabs/code/environments/production in my setup. Let’s create the file manifests/schema_change_mon.pp.
touch manifests/schema_change_mon.pp-
Then fill the file manifests/schema_change_mon.pp with the following contents,
node 'pupnode16.puppet.local' { # Applies only to mentioned node. If nothing mentioned, applies to all.
        class { 'schema_change_mon':
        }
}
If you’re done, you should have the following tree structure just like mine,
root@pupmas:/etc/puppetlabs/code/environments/production/modules# tree schema_change_mon
schema_change_mon
├── files
│   └── graphing_gen.sh
└── manifests
    └── init.pp
What does our module do?
Our module which is called schema_change_mon does collect the following,
exec { "mysql-without-primary-key" :…
Which executes a mysql command and runs a query to retrieve tables without primary keys. Then,
$dbs.each |String $db| {
exec { "mysql-duplicate-index-$db" :
which does collect duplicate indexes that exist in the database tables.
Next, the lines generate graphs based on the metrics collected. These are the following lines,
exec { "generate-graph-total-rows" :
...

exec { "generate-graph-total-len" :
…
Once the query successfully runs, it generates the graph, which depends on the API provided by https://quickchart.io/.
Here are the following results of the graph:
Whereas the file logs simply contain strings with its table names, index names. See the result below,
root@pupnode16:~# tail -n+1 /opt/schema_change_mon/assets/*.log
==> /opt/schema_change_mon/assets/dupe-indexes.log <==
pauldb.c.my_index(n,i)
pauldb.c.my_index2(n,i)
pauldb.d.a_b(a,b)
pauldb.d.a_b2(a,b)
pauldb.d.a_b3(a)
pauldb.d.a_b3(a)
pauldb.t3.b(b)
pauldb.c.my_index(n,i)
pauldb.c.my_index2(n,i)
pauldb.d.a_b(a,b)
pauldb.d.a_b2(a,b)
pauldb.d.a_b3(a)
pauldb.d.a_b3(a)
pauldb.t3.b(b)

==> /opt/schema_change_mon/assets/no-pk.log <==
pauldb.b, MyISAM
pauldb.c, InnoDB
pauldb.t2, InnoDB
pauldb.d, InnoDB
pauldb.b, MyISAM
pauldb.c, InnoDB
pauldb.t2, InnoDB
pauldb.d, InnoDB
Why Not Use ClusterControl?
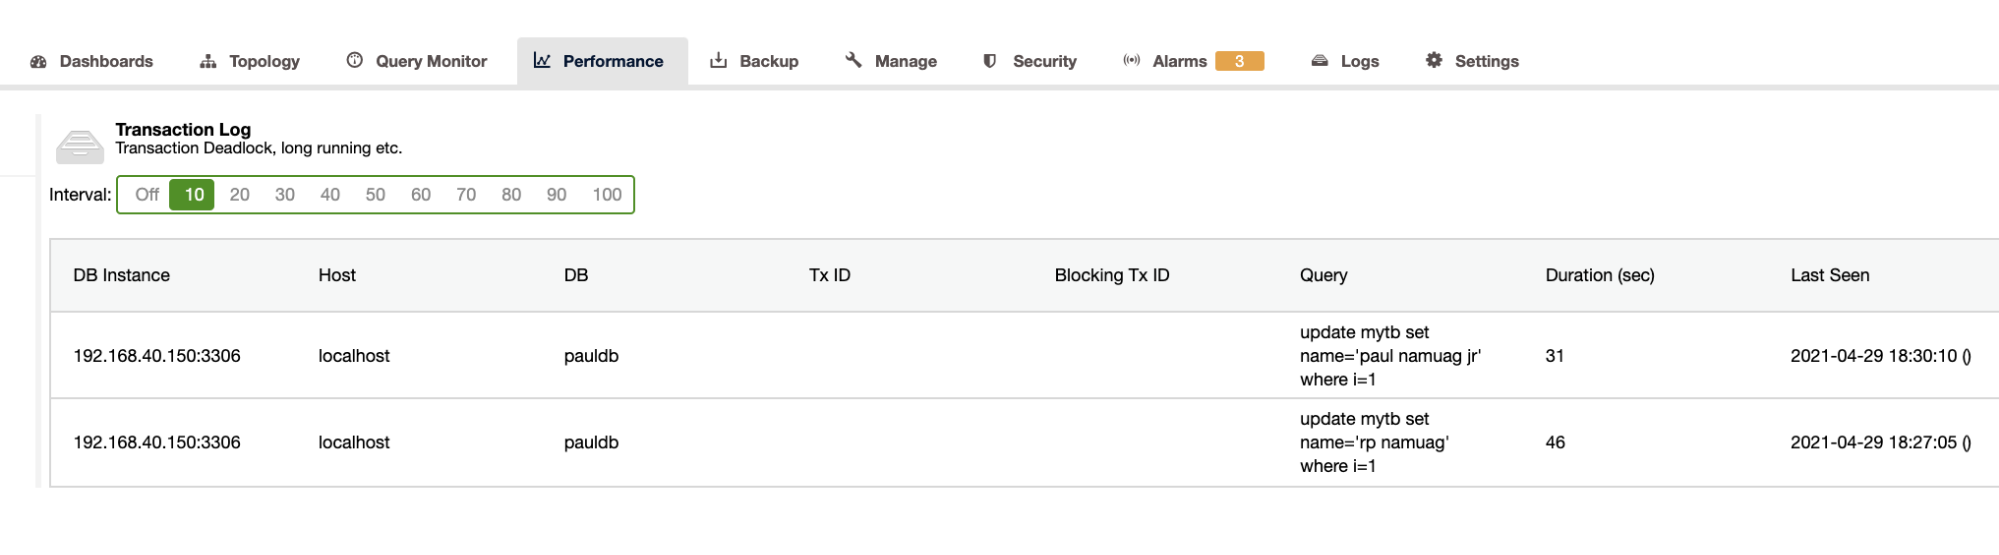
As our exercise showcases the automation and getting the database schema statistics such as changes or operations, ClusterControl provides this as well. There are other features as well aside from this and you don't need to reinvent the wheel. ClusterControl can provide the transaction logs such as deadlocks as shown above, or long running queries as shown below:
ClusterControl also shows the DB growth as shown below,
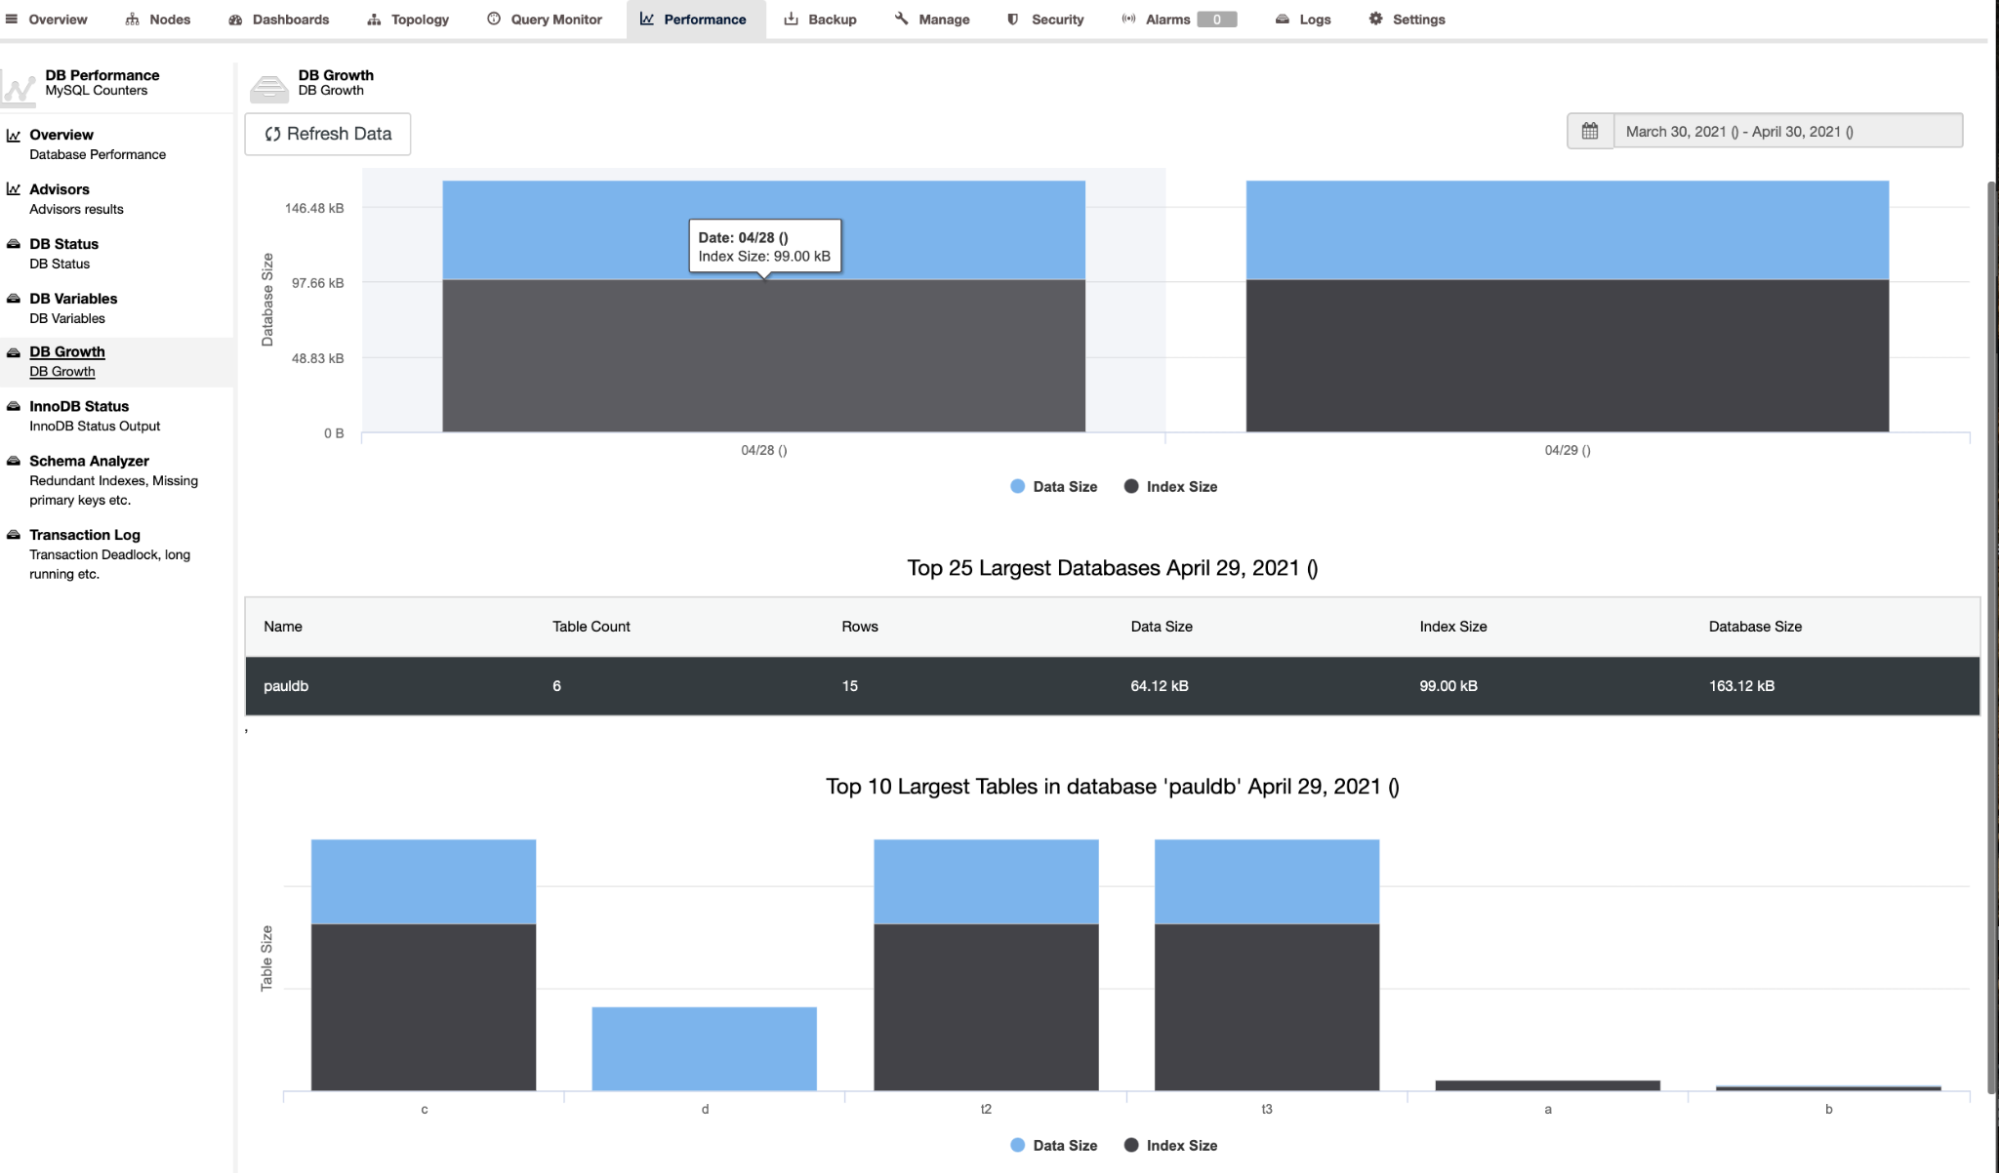
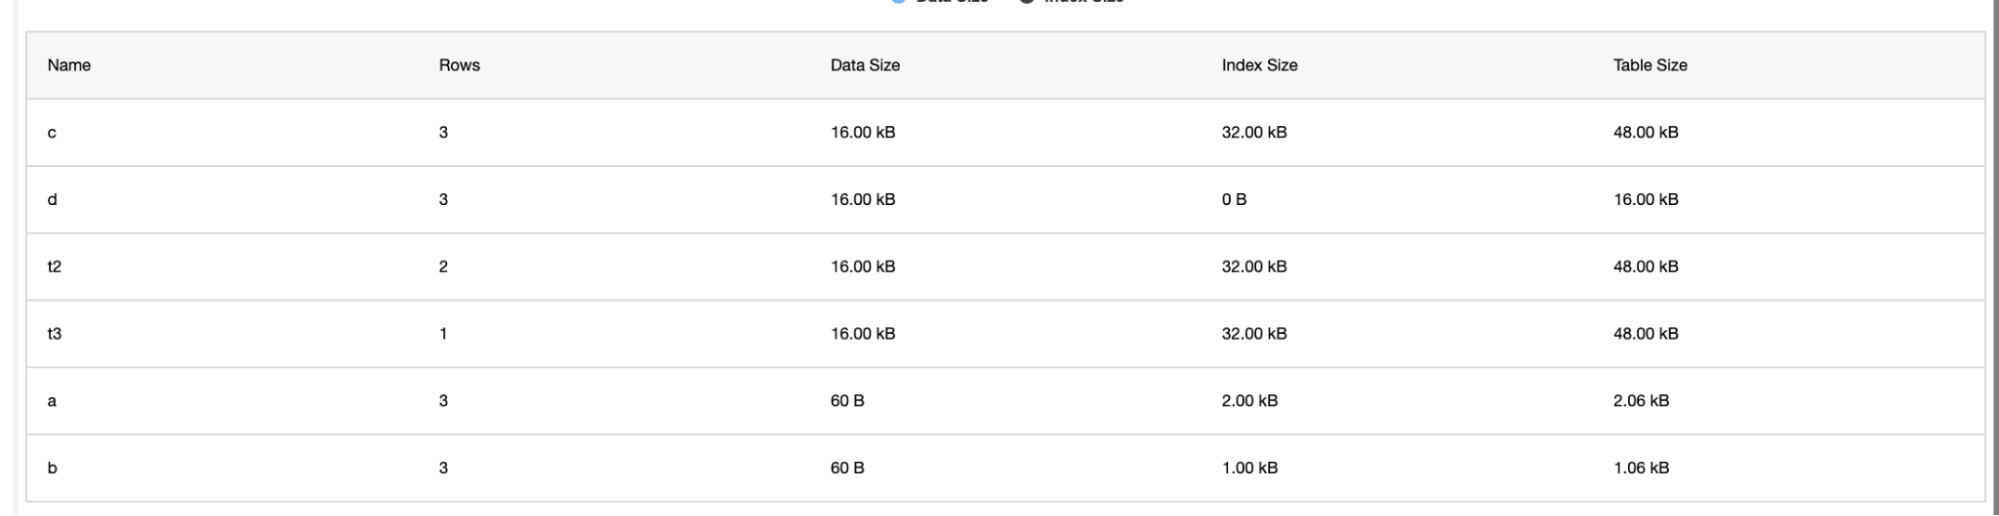
ClusterControl also gives additional information such as number of rows, disk size, index size, and total size.
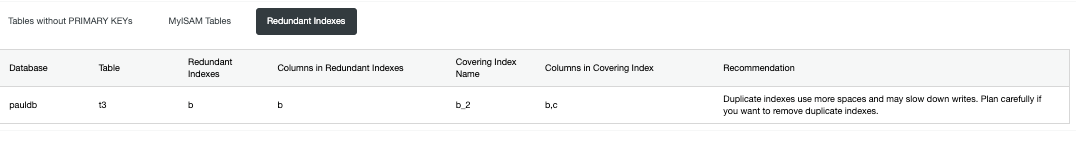
The schema analyzer under Performance tab -> Schema Analyzer is very helpful. It provides tables without primary keys, MyISAM tables, and duplicate indexes,
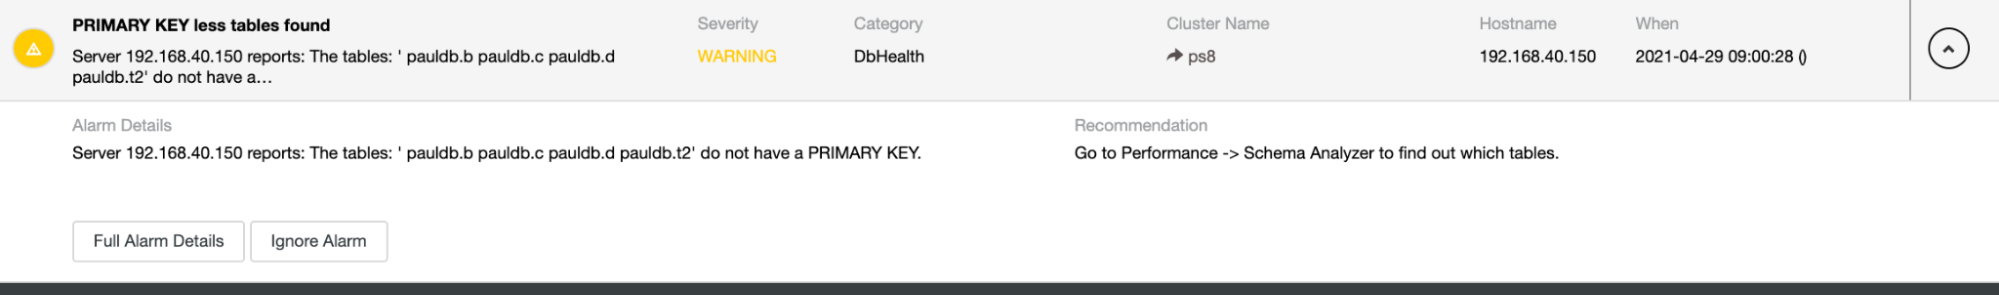
It also provides alarms in case there are detected duplicate indexes or tables without primary keys such as below,
You can check out more information about ClusterControl and its other features on our Product's page.
Conclusion
Providing automation for monitoring your database changes or any schema statistics such as writes, duplicate indexes, operation updates such as DDL changes, and many database activities is very beneficial to the DBAs. It helps to quickly identify the weak links and problematic queries that would give you an overview of a possible cause of bad queries that would lock up your database or stale your database.


