blog
Managing Your Database logfiles with ClusterControl

Earlier in the blog series, we touched upon deployment of clustering/replication (MySQL / Galera, MySQL Replication, MongoDB & PostgreSQL), management & monitoring of your existing databases and clusters, performance monitoring and health, how to make your setup highly available through HAProxy and MaxScale, how to prepare yourself for disasters by scheduling backups and in the last post how to manage your database configuration files where we described the new configuration management interface that got introduced in ClusterControl 1.2.11.
Another enhancement in ClusterControl 1.2.11 is the addition of system log files. Instead of having to log into each and every node in a cluster, you can now conveniently browse and read the mysqld and mongod log files of every node from within ClusterControl.
Todays blog post will cover the ClusterControl log section with all the tools available in ClusterControl and how to use them to your benefit. We will also cover how to grab all the necessary log files when troubleshooting issues together with the Severalnines support team.
Cluster Jobs
The Cluster Jobs contain the output of the various jobs that are run on a cluster. You can find the cluster specific jobs under Cluster > Logs > Cluster Jobs. The output of the job is in a certain sense just a log file detailing the steps executed in a job. Normally you would have no need to look at the output of these jobs. But should a certain job not succeed, then this is the first place to look for clues.
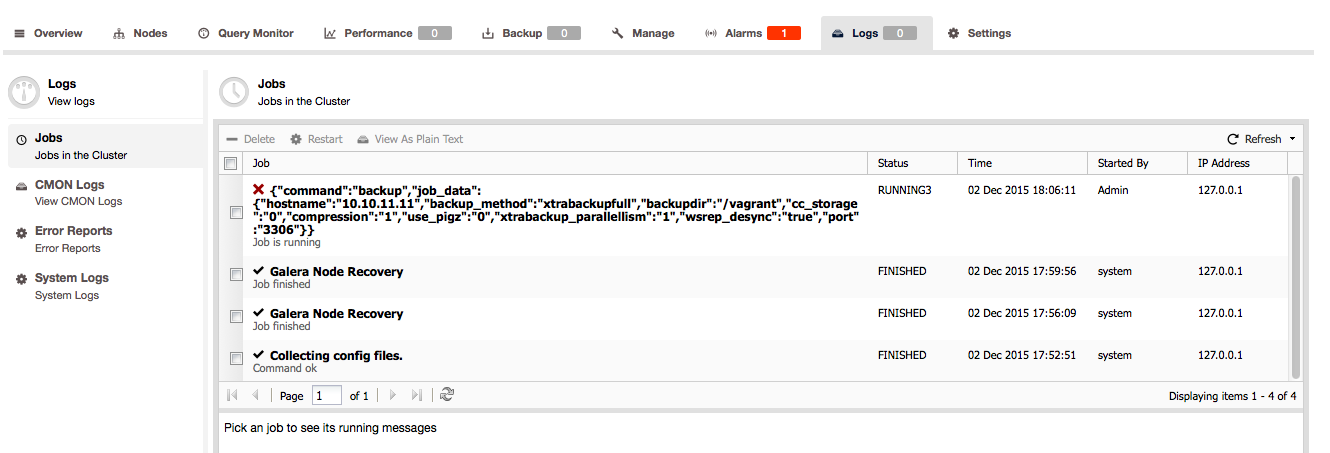
In this overview you can immediately see all jobs and their status. For instance here you can see that a backup is currently running on 10.10.11.11.
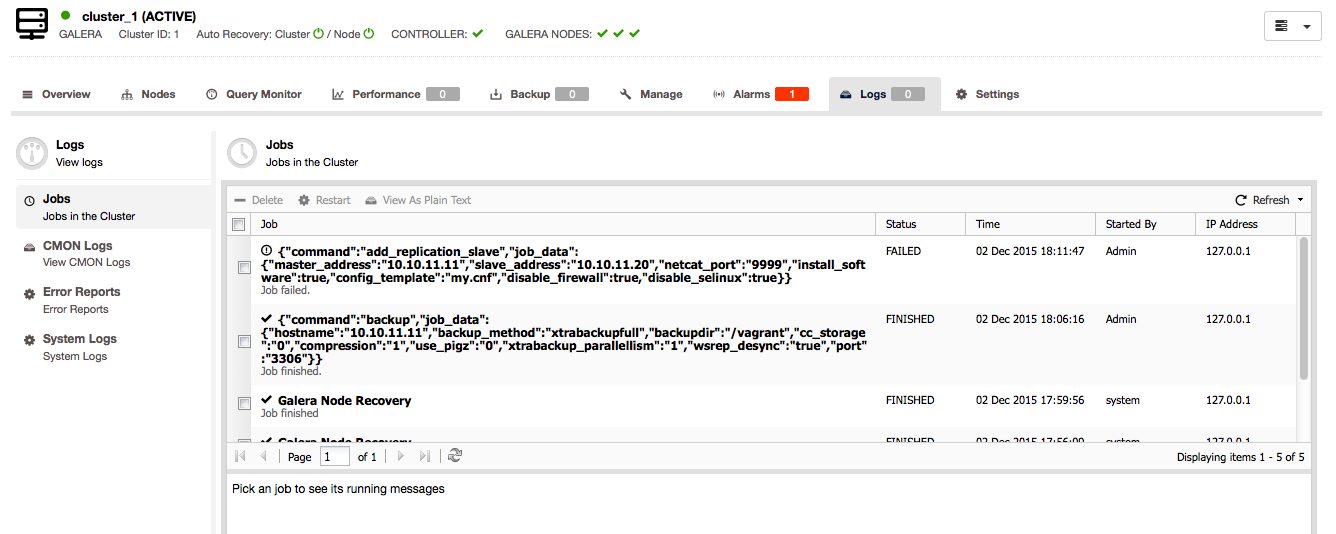
We can also spot a failed job. If we want to know why it failed, we can click on the entry and get the job output in the view below.
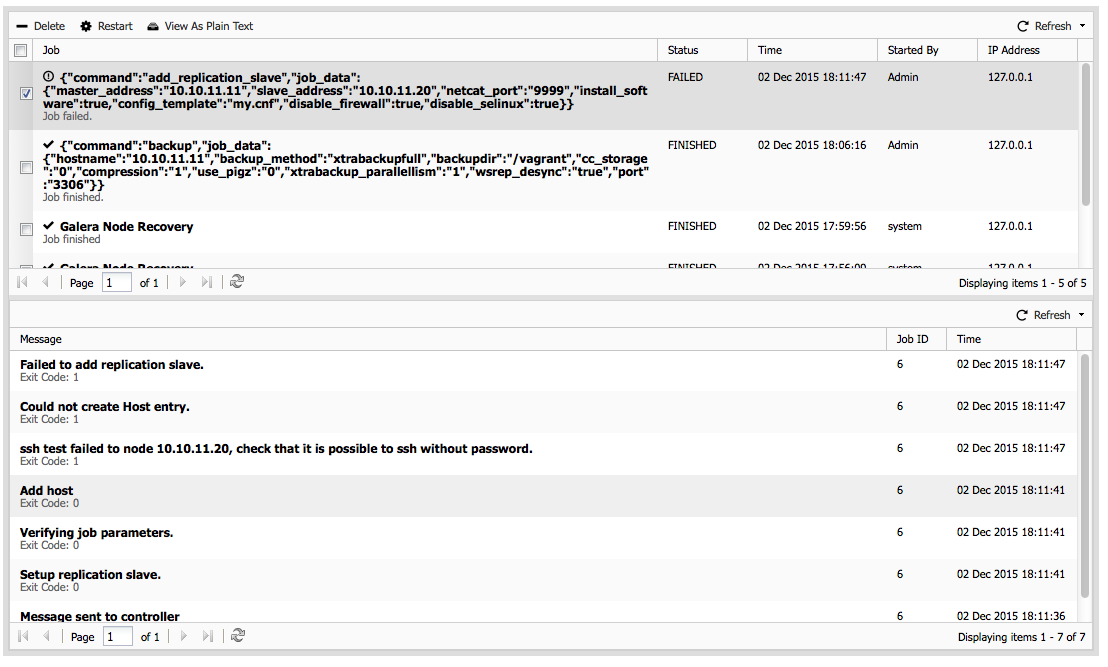
In the job details, we can look at the exit code of each step to trace back to the beginning of the problem. In this case, the first entry with an exit code of 1 is the ssh command to the new host. Apparently the CMON controller is unable to establish an ssh session to the new host and this is something we can resolve.
CMON Log files
The next place to look are the CMON Log files. You can find them under Cluster > Logs > CMON Logs. Here you will find the log entries of all scheduled jobs CMON is running, like crons and reports. Also any failure of nodes or cluster degradation can be found here. So for instance, if a node in your cluster is down, this is the place to look for hints.
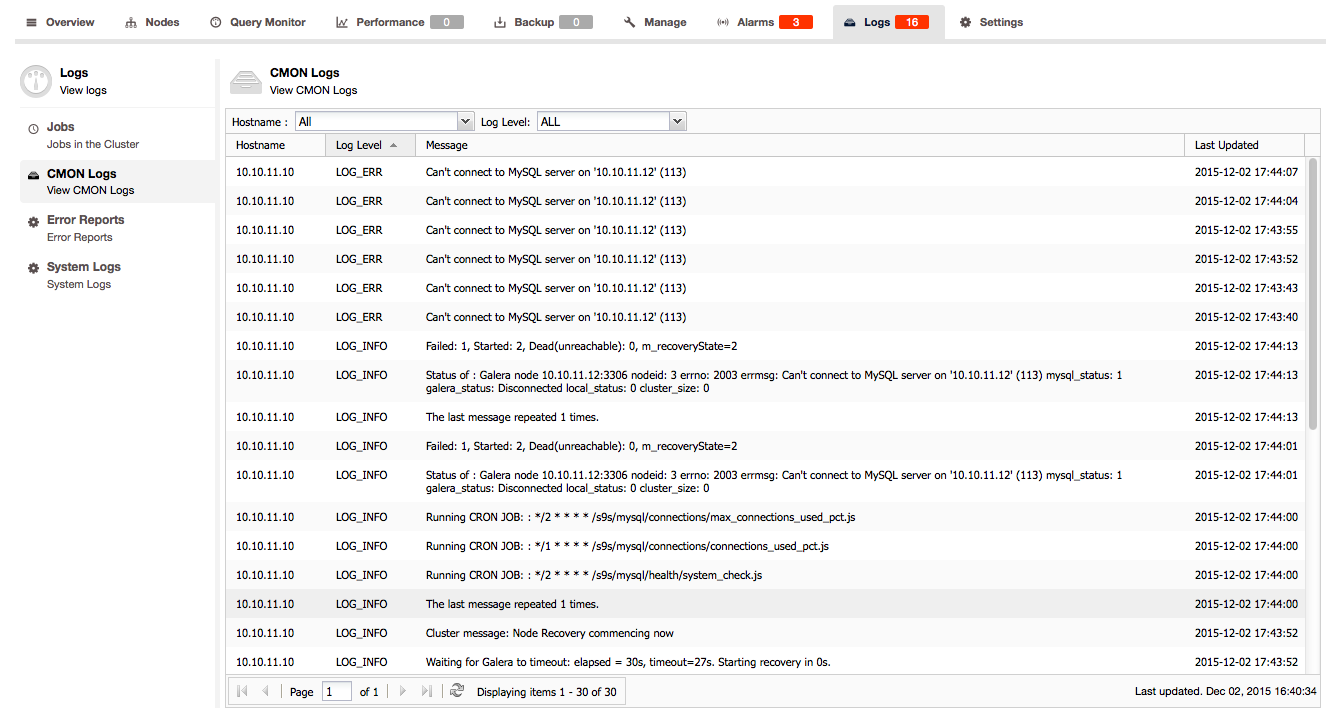
The example above shows log entries of errors that one node in the cluster cannot be reached while there are informative lines that inform you that the cluster has 1 dead node and 2 nodes that are alive.
You can sort and filter the log entries as well.
MySQL log files
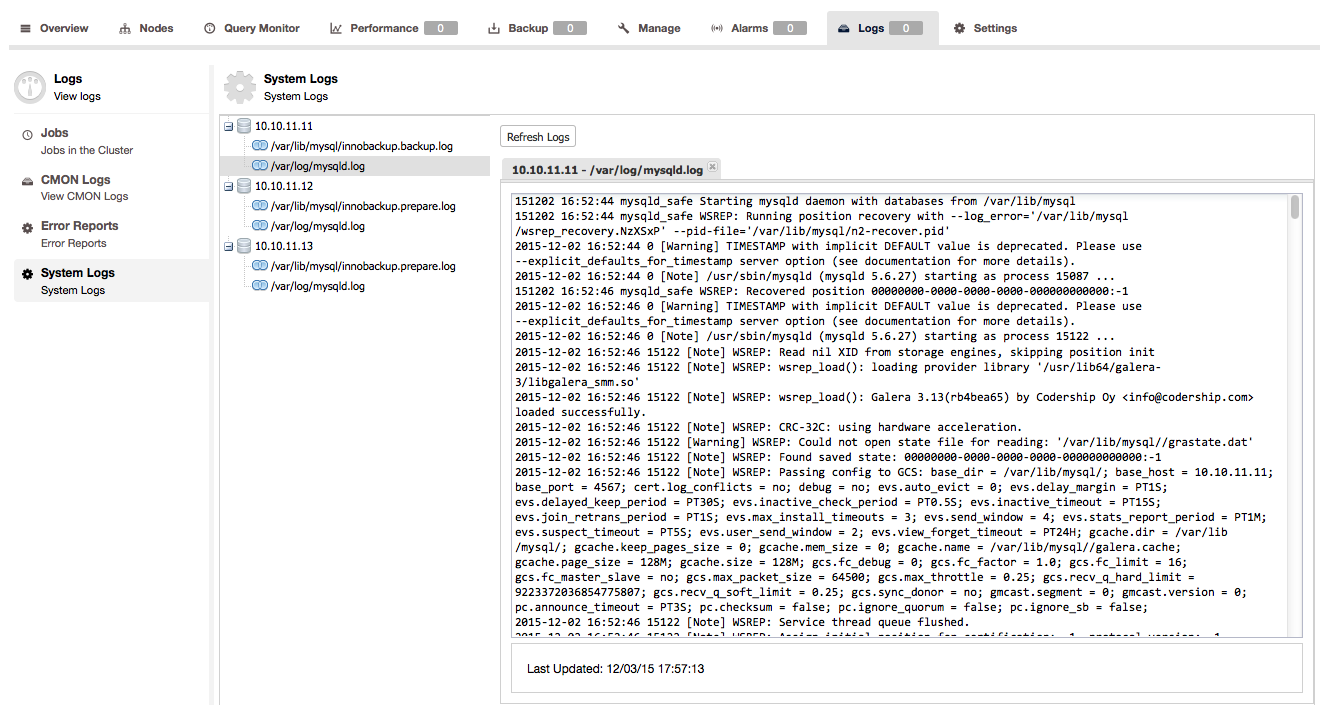
As mentioned earlier, we have added the collection of the mysql log files in ClusterControl 1.2.11. Files included are the MySQL error log, the innobackup backup and restore log files. You can find them under Cluster > Logs > System Logs.
All log files are being collected by ClusterControl every 30 minutes and you can check the “Last Updated” time at the bottom of the overview. If you are in immediate need of the log files you can push the “Refresh Logs” button to trigger a job in ClusterControl to collect the latest lines from the log files.
Also if you wish to have the log files collected more (or less) often, you can change this in Cluster > Settings > General Settings or change this in the cluster configuration file directly and reload the CMON service.
The MySQL error log can be very helpful to find and resolve issues within your cluster. We published a blog post about the ins and outs of the MySQL error log a few weeks ago.
Next to the MySQL error log, we also provide the innobackup backup and restore logs. These log files are created by the process that provides a node with the data from its master (or SST from another node in Galera’s case). If anything goes wrong during loading the data, these log files will give you a good clue about what went wrong.
To give an example, suppose we are forcing an SST in Galera and this fails. Firstly we can find the failed SST error in the MySQL error log:
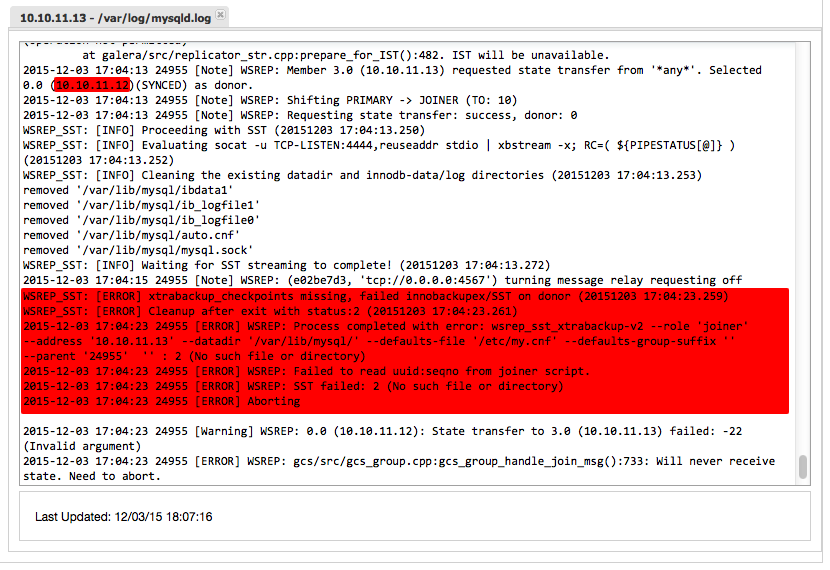
As you can see, first 10.10.11.12 get selected as a donor, the MySQL data directory gets emptied and then the data is transferred. So next step would be to check the innobackup backup log on the donor:
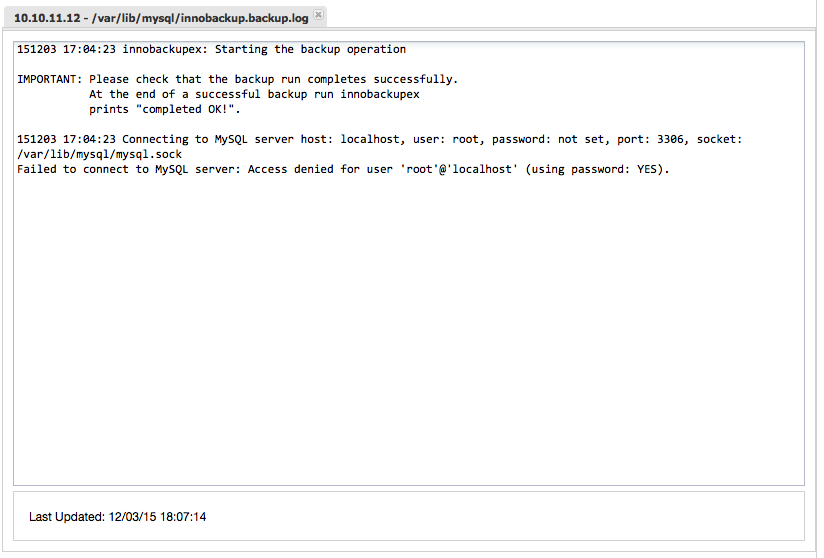
We can see that innobackupex made an attempt to make a backup but failed to connect to MySQL. It used the root account and password in this case, so this indicates the stored credentials for the SST (wsrep_sst_auth) are invalid. In this case, it is quite obvious why it failed. But in less obvious cases, these log files are a great help in resolving an issue.
Mongodb log files
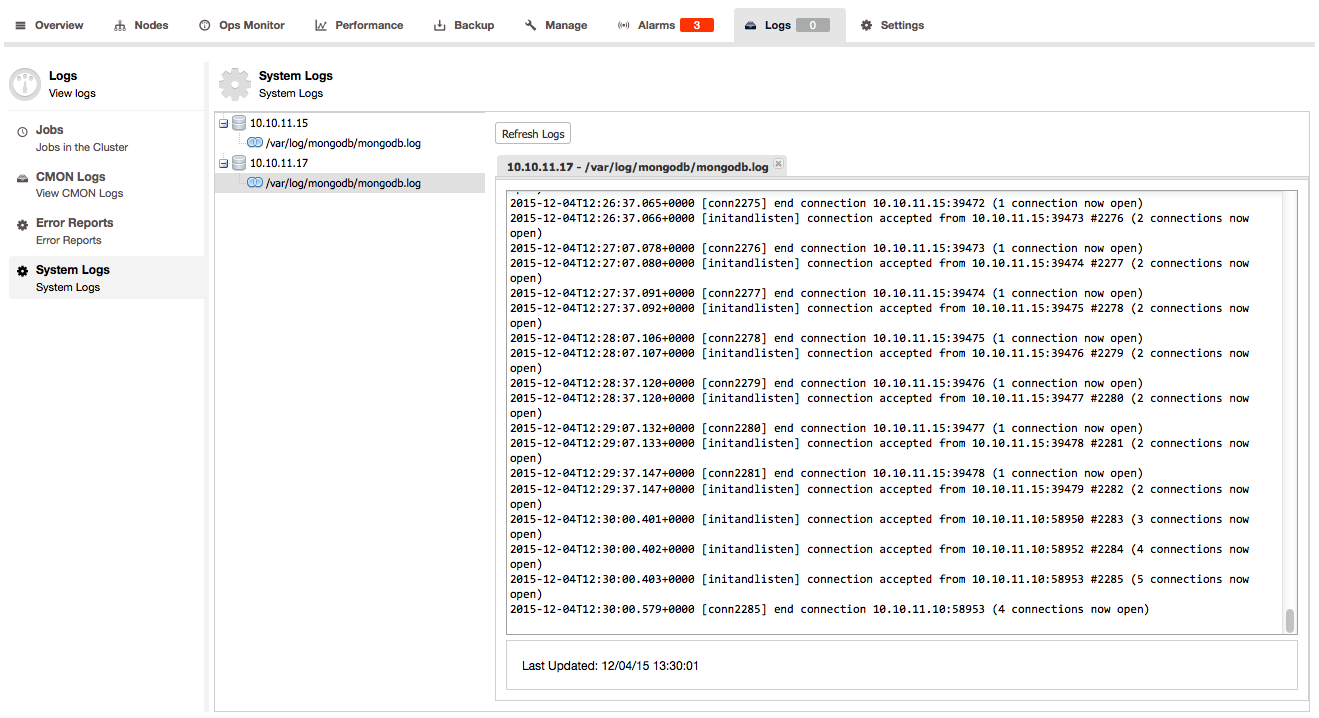
Just as described above, the MongoDB log files are collected by ClusterControl. You can find them under Cluster > Logs > System Logs.
All log files are being collected by ClusterControl every 30 minutes and you can check the “Last Updated” time at the bottom of the overview. If you are in immediate need of the log files you can push the “Refresh Logs” button to trigger a job in ClusterControl to collect the latest lines from the log files.
Error reports
Whenever you were not able to resolve your issues using the log files as described above and would like us to have a look, it is always handy to include an error report for us. You can find this under Cluster > Logs > Error reports. The error report is basically a tarball that contains a collection of log files, job lists and job details from the cluster.
You can create a job that will generate an error report by clicking on the “Create Error Report” button in the interface. This will give you a dialogue that asks whether you want to store the report on the web server or not. If you store the reports on the web server, you can download the report once the job has succeeded. Otherwise you can specify the location on the ClusterControl node where you want the report to be stored.
You can attach this report to the support ticket you are creating, so we have all the information at hand.
Final thoughts
With the combined insights you can retrieve from the cluster jobs, CMON logs and system log files, you should be able to narrow down issues more easily. Combine that insight with the knowledge of our blog post on the MySQL error log, this should help you not only identify the issue resolve it yourself.