Whitepapers
PostgreSQL load balancing with HAProxy

Attends June’s Live ClusterControl demo spotlighting failover and auto-recovery!

Applications typically connect to a database cluster by opening connections on one of the database nodes in order to run transactions. If the database node fails, the client would need to promote another database node and configure the application to connect it before it can continue to serve requests.
There are different ways to provide connectivity to one or more PostgreSQL database servers. One way is to use a database driver that supports connection pooling, load balancing, and failover for example:
Another solution is to use a load balancer between the clients and the database cluster.
This tutorial will walk you through on how to deploy, configure, and manage PostgreSQL load balancing with HAProxy using ClusterControl.
Content of the white paper
- What is HAProxy?
- Health checks for PostgreSQL
- Failure detection and failover
- Read/write splitting with HAProxy
- What is PgBouncer?
- Integration with ClusterControl
- HAProxy redundancy with Keepalived
- HAProxy statistics
- PgBouncer Connection Pooling Management
What is HAProxy?
HAProxy stands for High Availability Proxy and is a great software-based TCP/HTTP load balancer. It distributes a workload across a set of servers to maximize performance and optimize resource usage. HAProxy is built with sophisticated and customizable health checks methods, allowing a number of services to be load balanced in a single running instance.
A front-end application that relies on a database backend can easily over-saturate the database with too many concurrent running connections. HAProxy provides queuing and throttling of connections towards one or more PostgreSQL Servers and prevents a single server from becoming overloaded with too many requests. All clients connect to the HAProxy instance, and the reverse proxy forwards the connection to one of the available PostgreSQL Servers based on the load-balancing algorithm used.
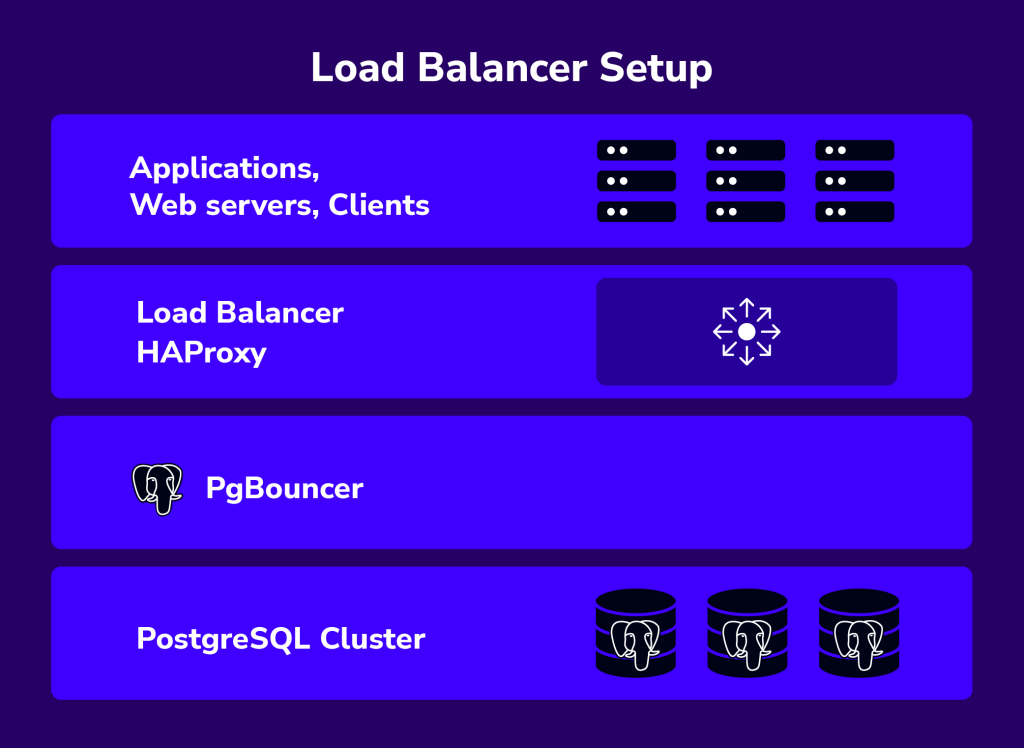
One possible setup is to install an HAProxy on each web server (or application server making requests on the database). This works fine if there are only a few web servers, so the load introduced by the health checks is kept in check. The web server would connect to the local HAProxy (e.g. making a psql connection on 127.0.0.1:5432), and can access all the database servers. The Web and HAProxy together form a working unit, so the webserver will not work if the HAProxy is not available.
With HAProxy in the load balancer tier, you will have the following advantages:
- All applications access the cluster via one single IP address or hostname. The topology of the database cluster is masked behind HAProxy.
- PostgreSQL connections are load-balanced between available DB nodes.
- It is possible to add or remove database nodes without any changes to the applications.
- Once the maximum number of database connections (in PostgreSQL) is reached, HAProxy queues additional new connections. This is a neat way of throttling database connection requests and achieves overload protection.
ClusterControl supports HAProxy deployment right from the UI and CLI, and by default, it supports three load-balancing algorithms – roundrobin, leastconn, or source. We recommend users to have HAProxy in between clients and a pool of database servers.
Health Checks for PostgreSQL
It is possible to have HAProxy check that a server is up by just making a connection to the PostgreSQL port (usually 5432) however, this is not good enough. The instance might be up, but the underlying storage engine might not be working as it should be. There are specific checks that need to be passed, depending on which database technology we are using.
Health Check Script
The best way to perform PostgreSQL health check is by using a custom shell script which determines whether a PostgreSQL server is available by carefully examining its internal state which depends on the clustering solution used. By default, ClusterControl provides its own version of a health check script called postgreschk, resides on each PostgreSQL server in the load balancing set, and has the ability to return an HTTP response status and/or standard output (stdout) which is useful for TCP health check.
postgreschk for PostgreSQL
If the backend PostgreSQL server is healthy, then the script will return a simple HTTP 200 OK status code with exit status 0. Else, the script will return 503 Service unavailable and exit status 1. Using xinetd is the simplest way to get the health check script executed by making it daemonized and listening to a custom port (default is 9201). HAProxy will then connect to this port and request a health check output. If the health check method is httpchk, HAProxy will look for the HTTP response code and if the method is tcp-check, it will look for the expected string (as shown in section 3.2.3).
The template file is located at /usr/share/cmon/templates/postgreschk on the ClusterControl server. This postgreschk script is automatically installed by ClusterControl on each PostgreSQL node participating in the load balancing set.
Setting up HAProxy for PostgreSQL allows you to split the traffic in two different HAProxy listeners e.g, port 5433 for writes to the primary node and port 5434 for reads to all available standby nodes (including primary). In this case, the template is located at /usr/share/cmon/templates/postgreschk_rw_split on the ClusterControl server. We have covered this in this blog post.
Other than HAProxy, you can now use your favorite reverse proxy to load balance requests across PostgreSQL nodes, namely:
- nginx 1.9 (–with-stream)
- keepalived
- IPVS
- distributor
- pen
This health check script is out of the scope of this tutorial since it is built for TCP-load balancers (other than HAProxy) with limited health-check capabilities to monitor the backend PostgreSQL nodes correctly.
Health Check Methods
HAProxy determines if a server is available for request routing by performing so-called health checks. HAProxy supports several backend health check methods usable to PostgreSQL through the following options:
- pgsql-check
- tcp-check
- httpchk
pgsql-check
The check sends a PostgreSQL StartupMessage and waits for either Authentication request or ErrorResponse message. It is a basic but useful test which does not produce error nor aborted connection on the server.
Take note that this does not check database presence nor database consistency. To do this, we must use an external check (via xinetd) which is explained in the next section.
tcp-check
By default, if “check” is set, the server is considered available when it’s able to accept periodic TCP connections. This is not robust enough for a database backend since the database server might be able to respond to connection requests while being in a non-operational state. The instance might be up, but the underlying storage engine might not be working properly. Also, there are specific checks that need to be done, depending on the database technology that you are using.
The postgreschk script provided by ClusterControl supports returning HTTP status code and standard output (stdout). By utilizing the stdout in xinetd, we can extend the tcp-check capability to make it more accurate with the PostgreSQL node status. The following example configuration shows the usability of it:
listen  haproxy_192.168.100.134_5434_ro
        bind *:5434
        mode tcp
        timeout client  10800s
        timeout server  10800s
        tcp-check connect port 9201
        tcp-check expect string is\ running
        balance leastconn
        option tcp-check
        default-server port 9201 inter 2s downinter 5s rise 3 fall 2 slowstart 60s maxconn 64 maxqueue 128 weight 100

        server 192.168.100.135 192.168.100.135:5433 check
        server 192.168.100.142 192.168.100.142:5432 check
The above configuration lines tell HAProxy to perform health checks using TCP send/expect sequence. It connects to port 9201 of the database and expects a string that contains “is\ running” (backslash is used to escape whitespace). To verify the postgreschk output through xinetd port 9201, perform telnet to the database node on HAProxy node:
$ telnet 192.168.100.135 9201
Trying 192.168.100.135...
Connected to 192.168.100.135.
Escape character is '^]'.

HTTP/1.1 200 OK
Content-Type: text/html
Content-Length: 56

<html><body>PostgreSQL master is running.</body></html>

Connection closed by foreign host.
You can use a similar configuration for checking the PostgreSQL primary node, where the expected string for the master is “master\ is\ running”.
ClusterControl defaults to use httpchk as described in the next section.
httpchk
Option httpchk uses HTTP protocol to check on the server’s health. This is common if you want to load balance an HTTP service, where HAProxy ensures the backend returns specific HTTP response codes before routing the incoming connections. This option does not necessarily require an HTTP backend, it also works with plain TCP backends. Using httpchk is the preferred option whenever possible since it utilizes fewer resources with a stateless HTTP connection.
listen  haproxy_192.168.100.134_5433_rw
        bind *:5433
        mode tcp
        timeout client  10800s
        timeout server  10800s
        balance leastconn
        option httpchk
        option allbackups
        default-server port 9201 inter 2s downinter 5s rise 3 fall 2 slowstart 60s maxconn 64 maxqueue 128 weight 100

        server 192.168.100.135 192.168.100.135:5433 check
        server 192.168.100.142 192.168.100.142:5432 check
The example above tells us that HAProxy will connect to port 9201, where xinetd is listening on the database servers. HAProxy will look for an expected HTTP response code. The postgreschk script will return either “HTTP 200 OK” if the server is healthy, otherwise, “HTTP 503 Service not available”.
Failure Detection and Failover
When a database node fails, the database connections that have been opened on that node will also fail. It is important that HAProxy does not redirect new connection requests to the failed node.
There are several user-defined parameters that determine how fast HAProxy will be able to detect that a server is not available. The following is the example HAProxy configuration deployed by ClusterControl located at /etc/haproxy/haproxy.cfg:
listen  haproxy_192.168.100.134_5433_rw
        bind *:5433
        mode tcp
        timeout client  10800s
        timeout server  10800s
        balance leastconn
        option httpchk
        default-server port 9201 inter 2s downinter 5s rise 3 fall 2 slowstart 60s maxconn 64 maxqueue 128 weight 100

        server 192.168.100.135 192.168.100.135:5433 check
        server 192.168.100.142 192.168.100.142:5432 check
A quick explanation for each line above:
- listen: Listen section defines a complete proxy with its frontend and backend parts combined in one section. It is generally useful for TCP-only traffic. Specify the HAproxy instance name next to it. The next line describing the section must be indented.
- bind: Bind to all IP addresses on this host on port 5433. Your clients will have to connect to the port defined in this line.
- mode: Protocol of the instance. For PostgreSQL, the instance should work in pure TCP mode. A full-duplex connection will be established between clients and servers, and no layer 7 examination will be performed.
- timeout client: Maximum inactivity time in the client-side. It’s recommended to keep the same value with a timeout server for the predictability.
- timeout server: Maximum inactivity time on the server-side. It’s recommended to keep the same value with a timeout client for the predictability.
- balance: Load balancing algorithm. ClusterControl is able to deploy leastconn, roundrobin, and source, though you can customize the configuration at a later stage. Using leastconn is the preferred option so that the database server with the lowest number of connections receives the connection. If the database servers have the same number of connections, then roundrobin is performed to ensure that all servers are used.
- option httpchk: Perform HTTP-based health check instead. ClusterControl configures an xinetd script on each backend server in the load balancing set which returns HTTP response code.
- default-server: Default options for the backend servers listed under the server option.
- port: The backend health check port. ClusterControl configures an xinetd process listening on port 9201 on each of the database nodes running a custom health check script.
- inter: The interval between health checks for a server that is “up”, transitionally “up or down”, or not yet checked is 2 seconds.
- downinter: The down interval is 5 seconds when the server is 100% down or unreachable.
- rise: The server will be considered available after 3 consecutive successful health checks.
- fall: The server will be considered down/unavailable after 2 consecutive unsuccessful health checks.
- slowstart: In 60 seconds, the number of connections accepted by the server will grow from 1 to 100% of the usual dynamic limit after it gets back online.
- maxconn: HAProxy will stop accepting connections when the number of connections is 64.
- maxqueue: The maximum number of connections that will wait in the queue for this server. If this limit is reached, the next requests will be re-dispatched to other servers instead of indefinitely waiting to be served.
- weight: In general, all nodes are usually treated equally. So setting it to 100 is a good start.
- server: Define the backend server name, IP address, port, and server’s options. We enabled health checks by using the check option on each of the servers. The rest options are the same as under default-server.
From the above configurations, the backend PostgreSQL server fails at health checks when:
- HAProxy was unable to connect to port 9201 of the PostgreSQL server
- If 9201 is connected, the HTTP response code sent by PostgreSQL server returns other than HTTP/1.1 200 OK (option httpchk)
Whereby, the downtime and uptime chronology would be:
- Every 2 seconds, HAProxy performs a health check on port 9201 of the backend server (port 9201 inter 2s).
- If the health check fails, the fall count starts and it will check for the next failure. After 5 seconds, if the second try still fails, HAProxy will mark the PostgreSQL server as down (downinter 5s fall 2).
- The PostgreSQL server is automatically excluded from the list of available servers.
- Once the PostgreSQL server gets back online, if the health check succeeds, the rise count starts and it will check if the next consecutive attempt is succeeded. If the count reaches 3, the server will be marked as available (rise 3).
- The PostgreSQL server is automatically included in the list of available servers.
- The PostgreSQL server starts to accept the connections gradually for 60 seconds (slowstart 60s).
- The PostgreSQL server is up and fully operational.
Read/Write Splitting with HAProxy
HAProxy as PostgreSQL load balancer works similarly to a TCP forwarder, which operates in the transport layer of TCP/IP model. It does not understand the SQL queries (which operate in the higher layer) that it distributes to the backend PostgreSQL servers. Operating in the transport layer also consumes less overhead compared to the database-aware load balancers/reverse proxy like MaxScale or ProxySQL for MySQL or MariaDB databases, or even Pgpool-II for PostgreSQL.
The problem is that as PostgreSQL doesn’t support multiple writable servers in a native way if a standby server receives write traffic, that will be a problem, so the best here is to split the read and write traffic in two different listeners.
Writes must be forwarded only to a primary node, while reads can be forwarded to all standby nodes (and also primary).
To make HAProxy capable of handling reads and writes separately, one must:
- Configure health checks for PostgreSQL Replication. The health check script must be able to:
- Report the replication role (primary, standby, or none)
- Must be accessible by HAProxy (configured via xinetd or forwarding port)
- Create two HAProxy listeners, one for read and one for write:
- Read listener – forward to all standby nodes (or primary) to handle reads
- Write listener – forward writes to a primary node
- Instruct your application to send reads/writes to the respective listener:
- Build/Modify your application to have the ability to send reads and writes to the respective listeners
- Use an application connector which supports built-in read/write splitting
What is PgBouncer?
PgBouncer is a lightweight connection pooler for PostgreSQL databases. It sits between the HAProxy and the PostgreSQL server and manages the connections to the database, providing benefits such as improved performance and scalability.
Some of PgBouncer’s advantages such as:
- Connection Pooling: PgBouncer maintains a pool of connections to the PostgreSQL database. Instead of connecting directly to the database, clients connect to PgBouncer, which then manages the connections to the database server.
- Connection Pool Management: It efficiently manages connections, reducing the overhead of connection setup and teardown. Connections are reused rather than being opened and closed for each client request, which can greatly improve performance, especially in high-traffic environments.
- Query Caching: It can cache frequently used queries, which can further reduce the load on the PostgreSQL server and improve overall performance.
- Authentication: PgBouncer can handle client authentication, reducing the need for the database server to authenticate each connection individually.
PgBouncer is a useful tool for managing connections to PostgreSQL databases, particularly in environments where there are a large number of client connections or where performance optimization is critical.
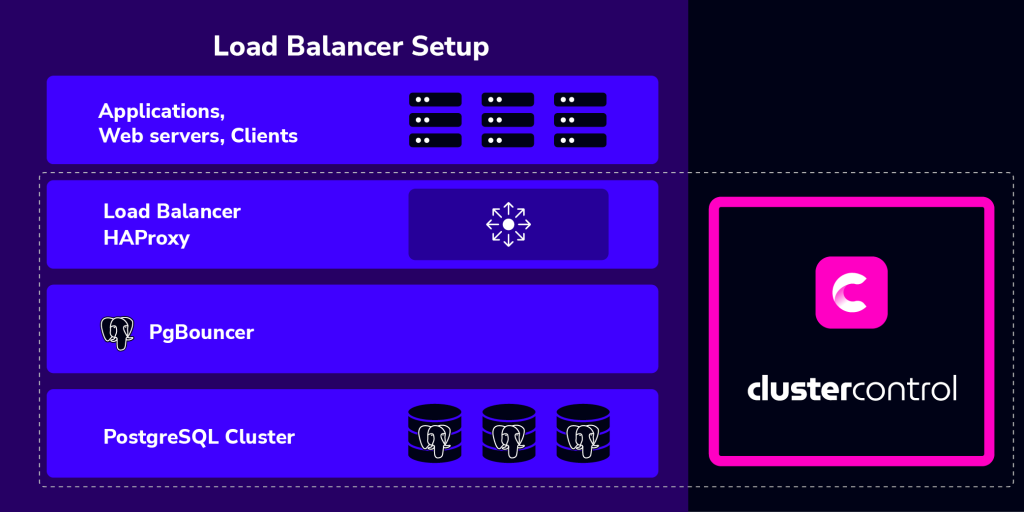
Integration with ClusterControl
ClusterControl integrates with HAProxy and PgBouncer to ease up deployment and management of the load balancer and connection management. It is also possible to add an existing/already deployed HAProxy instance into ClusterControl, so you can monitor and manage it directly from ClusterControl UI together with the database nodes.
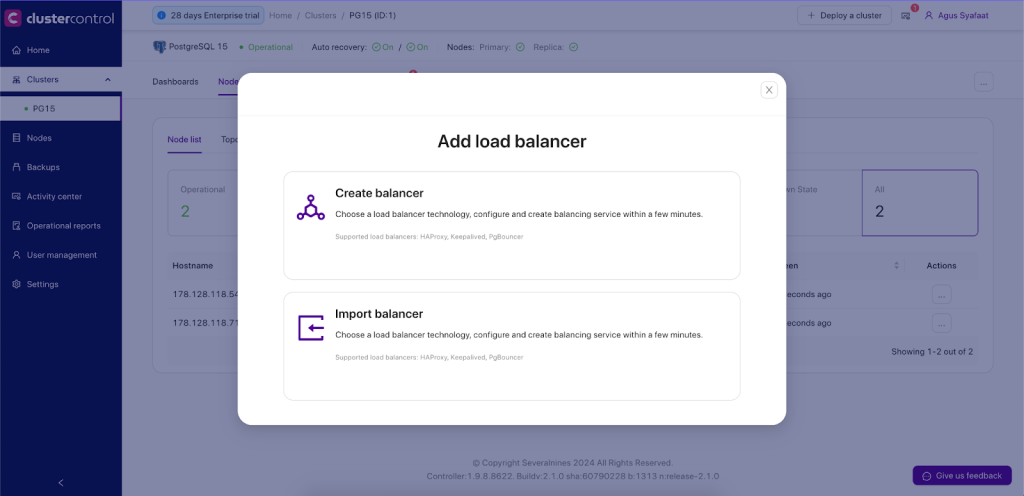
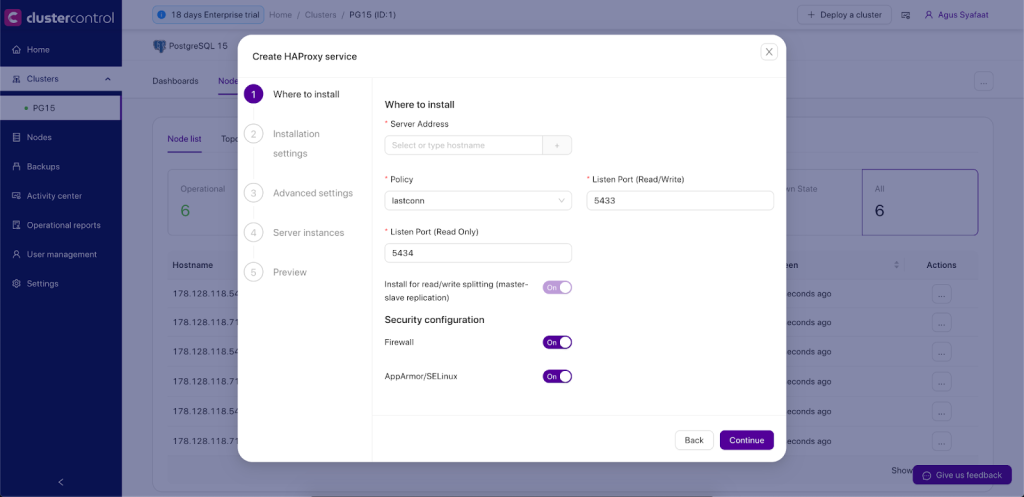
To deploy it, you just need to go to ClusterControl -> Cluster Menu -> Add New -> Load Balancer. There will be a dialogue box for creating a load balancer and importing the existing one as shown below:
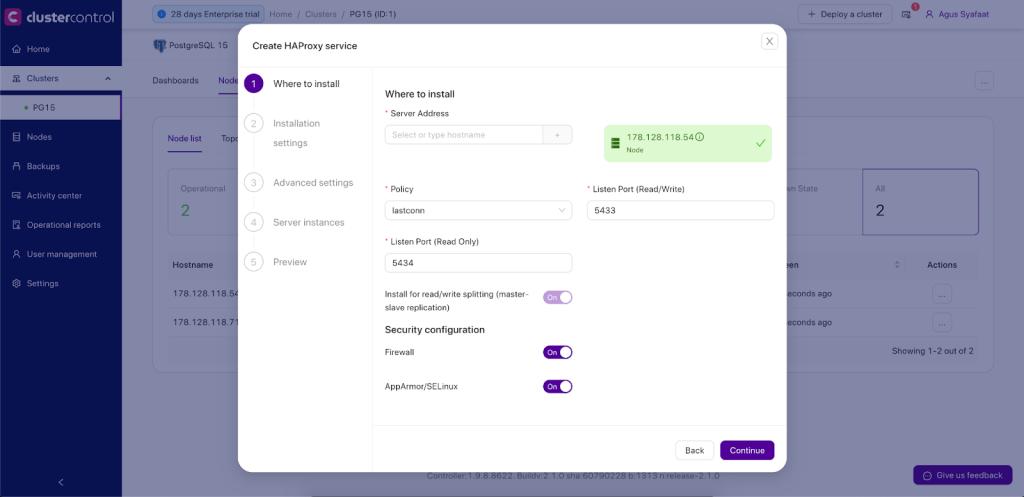
- Server Address: IP address or hostname of HAProxy node. ClusterControl must be able to connect via passwordless SSH.
- Listen Port (Read/Write): Port that HAProxy instance will listen to. This port will be used to connect to the load-balanced write PostgreSQL connections.
- Listen Port (Read-Only): Port that HAProxy instance will listen to. This port will be used to connect to the load-balanced Read PostgreSQL connections.
- Policy: Load balancing algorithm. Supported values are:
- leastconn – The server with the lowest number of connections receives the connection.
- roundrobin – Each server is used in turns, according to their weights.
- source – The client IP address is hashed and divided by the total weight, so it will always reach the same server as long as no server goes down or up.
- Build from Source: The latest available source package will be used:
- ClusterControl will compile the latest available source package downloaded from http://www.haproxy.org/#down.
- This option is only required if you intend to use the latest version of HAProxy or if you are having problems with the package manager of your OS distribution. Some older OS versions do not have HAProxy in their package repositories.
- Overwrite Existing /usr/local/sbin/postgreschk on targets: If the postgreschk script is already there, overwrite it for this deployment. If you have adjusted the script to suit your needs, you might need to uncheck this.
- Disable Firewall?: If you want ClusterControl to disable the firewall in the HAProxy node.
- Disable SELinux/AppArmor?: If you want ClusterControl to disable SELinux (RedHat-based OS) or AppArmor (Debian-Based OS) in the HAProxy node.
- Show Advanced Settings:
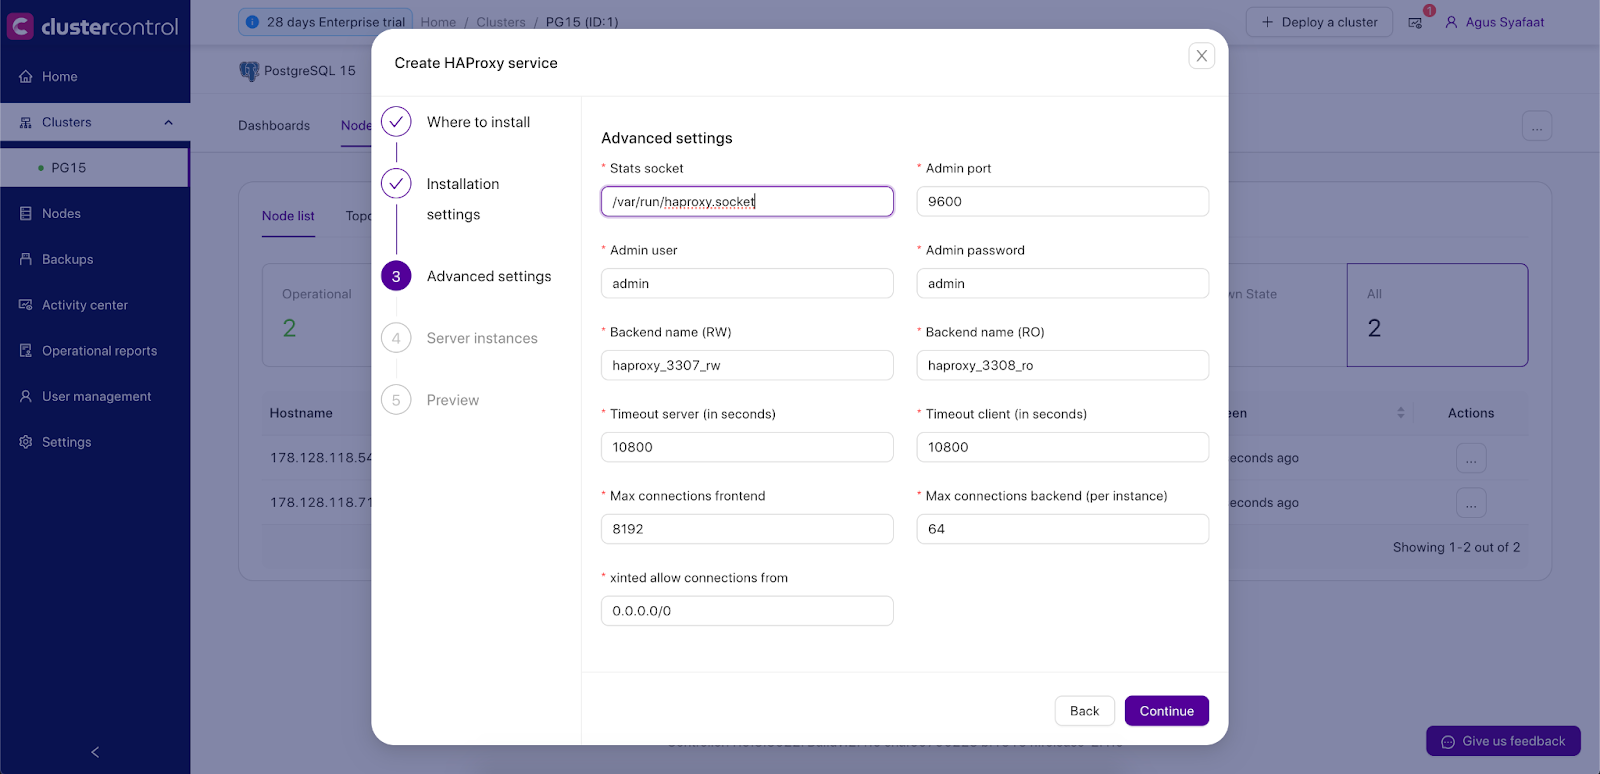
- Stats Socket: UNIX socket file location for various statistics outputs. Default is /var/run/haproxy.socket and it’s recommended not to change this.
- Admin Port: Port for HAProxy admin-level statistic page. The default is 9600.
- Admin User: Admin user when connecting to the statistics page.
- Admin Password: Password for Admin User
- Backend Name: The listener’s name for the backend without whitespace.
- Timeout Server (seconds): Maximum inactivity time on the server-side.
- Timeout Client (seconds): Maximum inactivity time on the client-side.
- Max Connections Frontend: Maximum per-process number of concurrent connections for the frontend.
- Max Connection Backend per instance: Limit the number of connections that can be made from HAProxy to each PostgreSQL Server. Connections exceeding this value will be queued by HAProxy. A best practice is to set it to less than the PostgreSQL’s max_connections parameter to prevent connections flooding.
- xinetd allow connections from: Only allow this network to connect to the health check script on PostgreSQL server via xinetd service
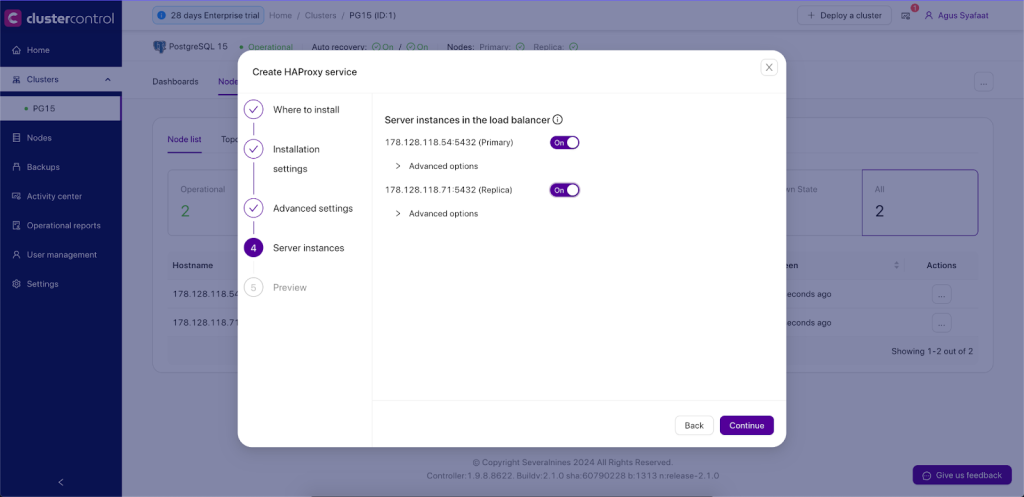
- Server Instances: List of PostgreSQL servers in the cluster.
- Include: Include the server in the load balancing set.
- Role: Choose whether the node is Active or Backup. In Backup mode, the server will be only used in load balancing when all other Active servers are unavailable.
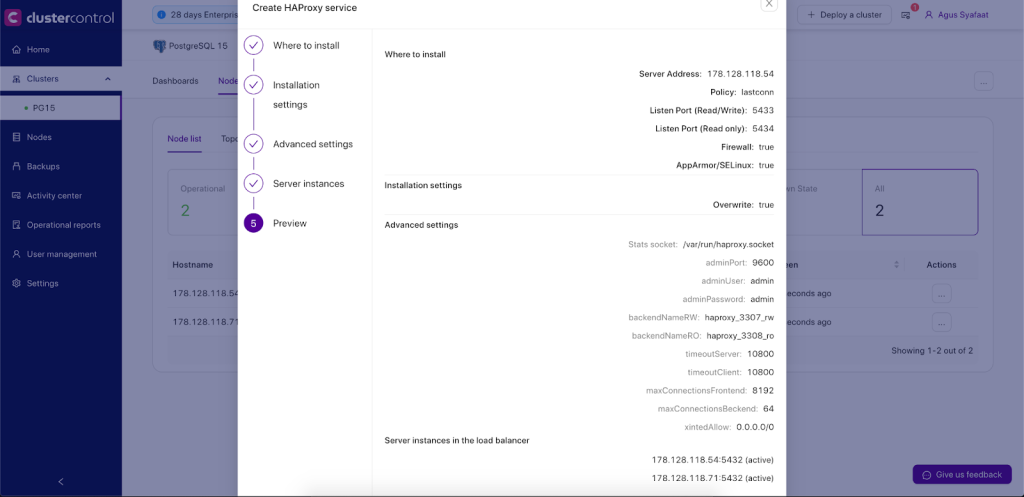
Once the dialog is filled up, there will be a preview page before we click on Deploy HAProxy’ button to trigger the deployment job.
ClusterControl will perform the following tasks when the deployment job is triggered:
- Installs helper packages
- Tunes the TCP stack of the instance
- Copies and configures postgreschk script (from template) on every PostgreSQL node
- Installs and configures xinetd at /etc/xinetd.d/postgreschk
- Registers HAProxy node into ClusterControl
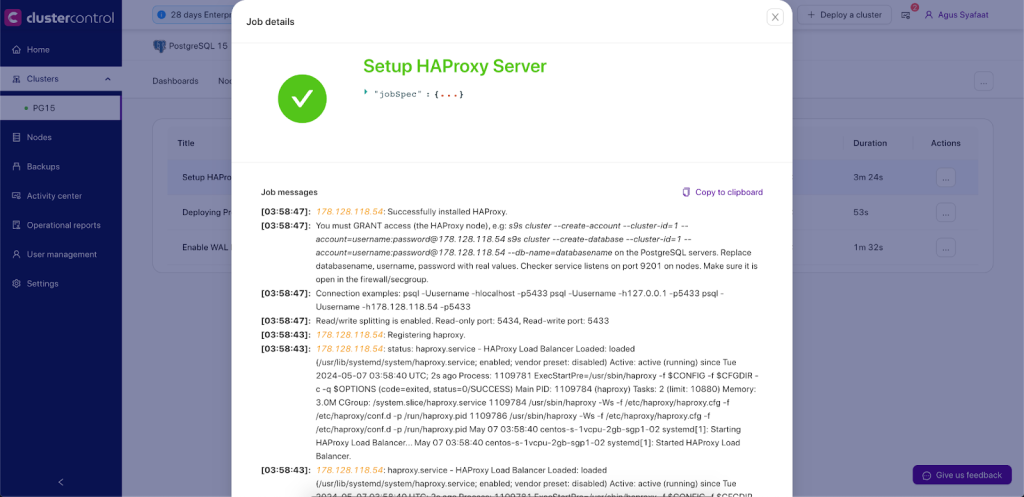
You can monitor the deployment progress under the ClusterControl Activity Section, similar to the example below:
By default, the HAProxy server will listen on both 5433 (writes) and 5434 (reads) ports for connections. In this example, the HAProxy host IP address is 192.168.100.133. You can connect your applications to 192.168.100.133:5433 or 192.168.100.133:5434 and requests will be load balanced on the backend PostgreSQL Servers.
Do not forget to GRANT access from the HAProxy server to the PostgreSQL Servers (database user creation and pg_hba.conf file), because the PostgreSQL Servers will see the HAProxy making the connections, not the Application server(s) itself. In the example above, issue on the PostgreSQL Servers the access rights you wish.
User creation:
CREATE USER admindb WITH PASSWORD 'Password' LOGIN;
GRANT SELECT ON ALL TABLES IN SCHEMA public TO admindb;
GRANT SELECT ON ALL SEQUENCES IN SCHEMA public TO admindb;
ALTER ROLE admindb WITH SUPERUSER;
Pg_hba.conf configuration file:
host all admindb 192.168.100.133/32 md5
The HAProxy process will be managed by ClusterControl and is automatically restarted if it fails.
HAProxy Redundancy with Keepalived
Since all applications will depend on HAProxy to connect to an available database node, to avoid a single point of failure with your HAProxy, one would set up two identical HAProxy instances (one active and one standby) and use Keepalived to run VRRP between them. VRRP provides a virtual IP address to the active HAProxy, and transfers the Virtual IP to the standby HAProxy in case of failure. This is seamless because the two HAProxy instances need no shared state.
By adding Keepalived into the picture, our infrastructure will now look something like this:
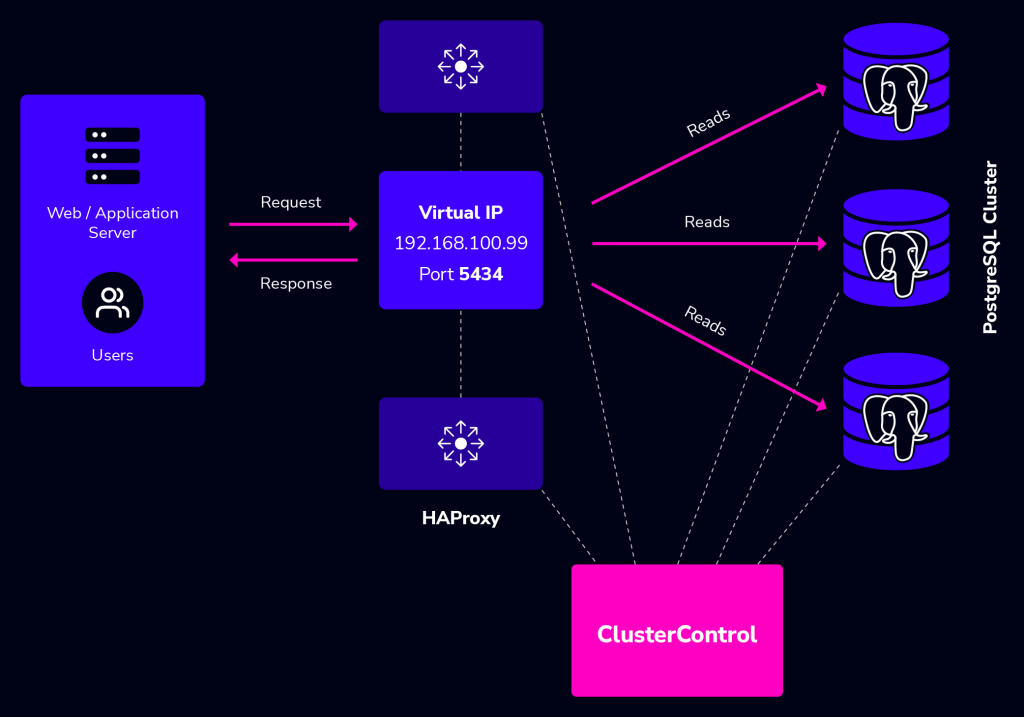
In this example, we are using two nodes to act as the load balancer with IP address failover in front of our database cluster. Virtual IP (VIP) address will be floating around between HAProxy #1 (master) and HAProxy #2 (backup). When HAProxy #1 goes down, the VIP will be taking over by HAProxy #2 and once the HAProxy #1 up again, the VIP will be failback to HAProxy #1 since it holds the higher priority number. The failover and failback process is automatic, controlled by Keepalived.
You need to have at least two HAProxy instances in order to install Keepalived. Use “Add New Load balancer“ to install another HAProxy instance and then go to ClusterControl -> Cluster Actions -> Add Load Balancer -> Keepalived tab to deploy or add existing Keepalived instance, as shown in the following screenshot:
Take note that your network environment supports VRRP (IP protocol 112) for health check communication between two nodes. It’s also possible to let Keepalived run in a non-multicast environment by configuring unicast, which will be used by default by ClusterControl if Keepalived installed is version 1.2.8 and later.
For more details on how ClusterControl configures Keepalived and what to expect from the failover and failback, see this blog post.
HAProxy Statistics
Other than deployment and management, ClusterControl also provides insight into HAProxy statistics from the UI. From ClusterControl, you can access the statistics page at ClusterControl -> Select Cluster -> Nodes -> choose the HAProxy node and click the Node Menu -> Node Details similar to screenshot below:
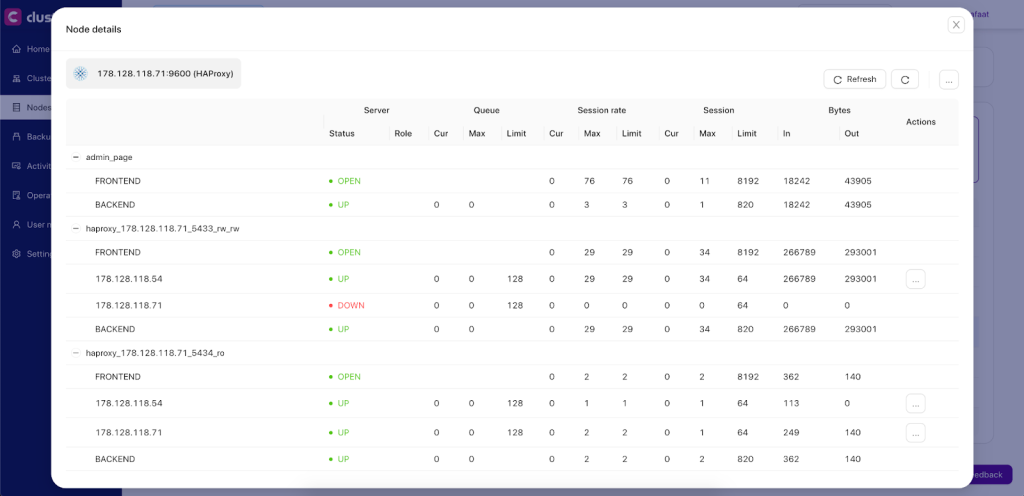
You can enable/disable a server from the load balancing by clicking the Action button. This is very useful when you want your application to intentionally skip connecting to a server e.g., for maintenance or for testing and validating new configuration parameters or optimized queries.
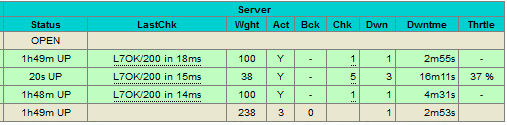
It’s also possible to access the default HAProxy statistics page by connecting to port 9600 on the HAProxy node. Following screenshot shows the example when connecting to http://[HAProxy_node_IP_address]:9600/ with default username and password “admin”:
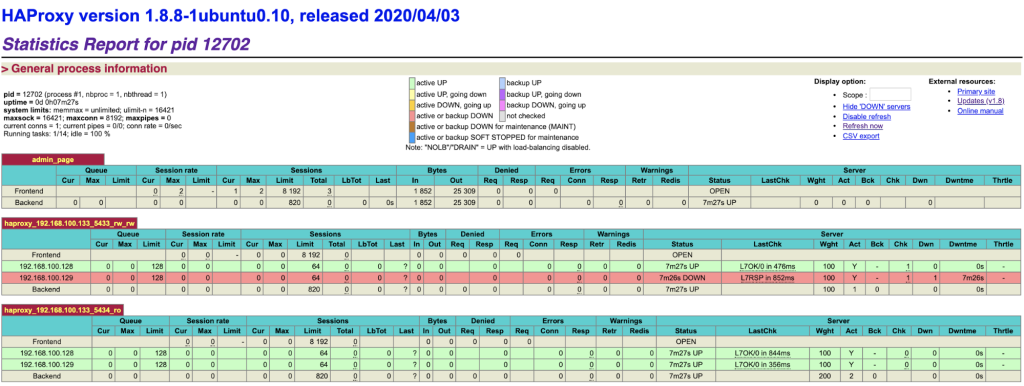
Based on the table legend, the green rows indicate that the servers are available, while red indicates down. In this case, the red node is in fact waiting to become master if needed, as it is the read/write port which only has the current primary node as online. If you take a look at the read-only port, you can see the same node up, available to receive traffic in this port.
When a server becomes available, you should notice the throttling part (last column) where “slowstart 60s” kicks in. This server will receive gradual connections where the weight is dynamically adjusted for 60 seconds before it reaches the expected weight (weight 100):
PgBouncer Connection Pooling Management
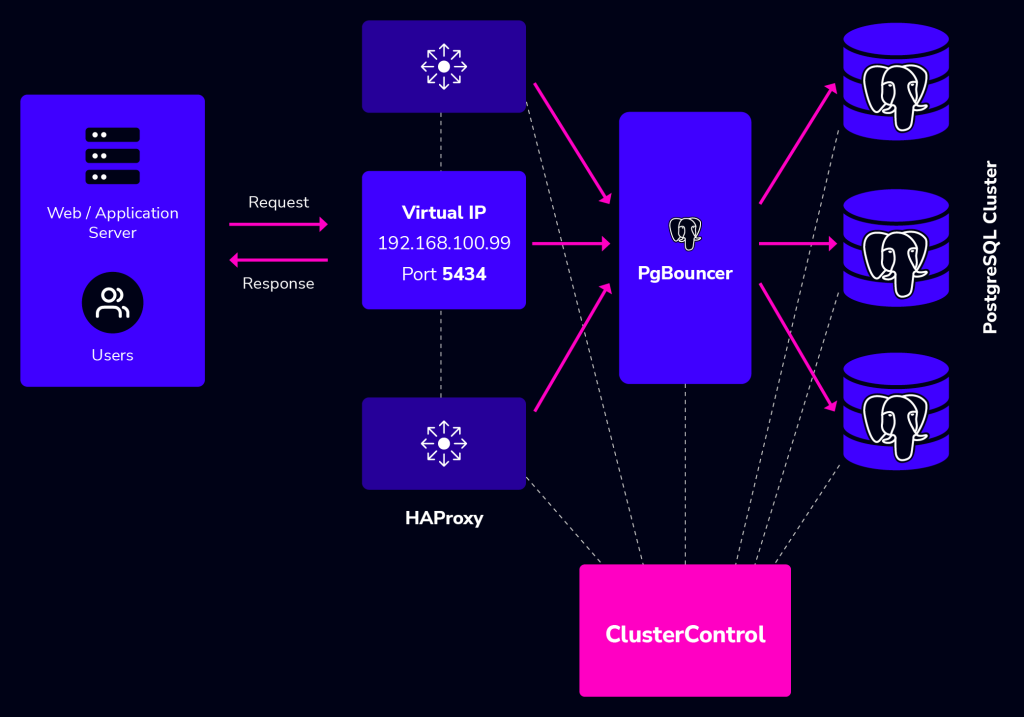
PgBouncer sits between the HAProxy and PostgreSQL database clusters. The application will go to the HAProxy using the VIP IP Address and the HAProxy will pass through to the PgBouncer before executing the queries in the database.
PgBouncer will manage connection pools to the database, so the database is protected from too many connections. The final architecture with PgBouncer added in the middle layer between HAProxy and PostgreSQL cluster will be as below:
Deployment of PgBouncer in ClusterControl is straightforward, you can go to Cluster Menu -> Add New Load Balancer. There will be an option to deploy the PgBouncer.
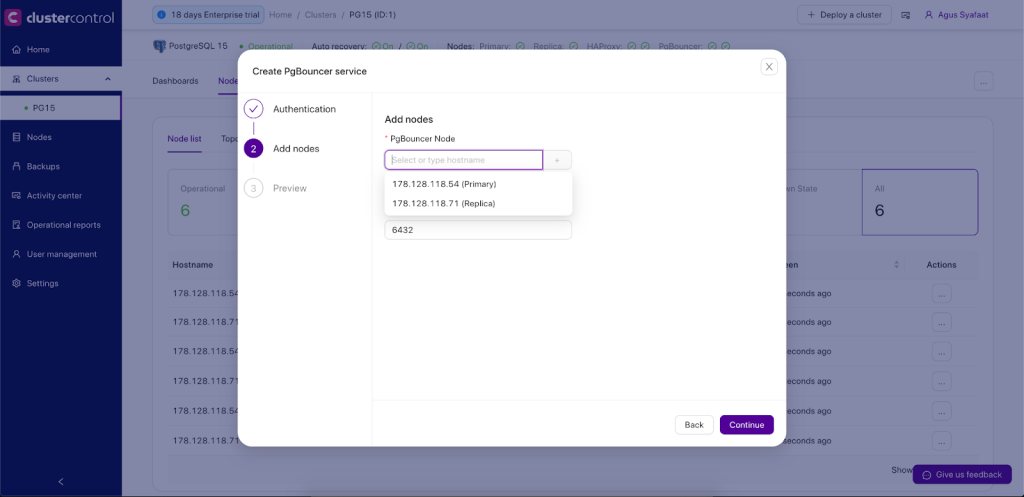
Later after the deployment of PgBouncer, you configure the new pool in PgBouncer.
You can go to Nodes -> choose the PgBouncer and expand the Node Menu as shown below screenshot:
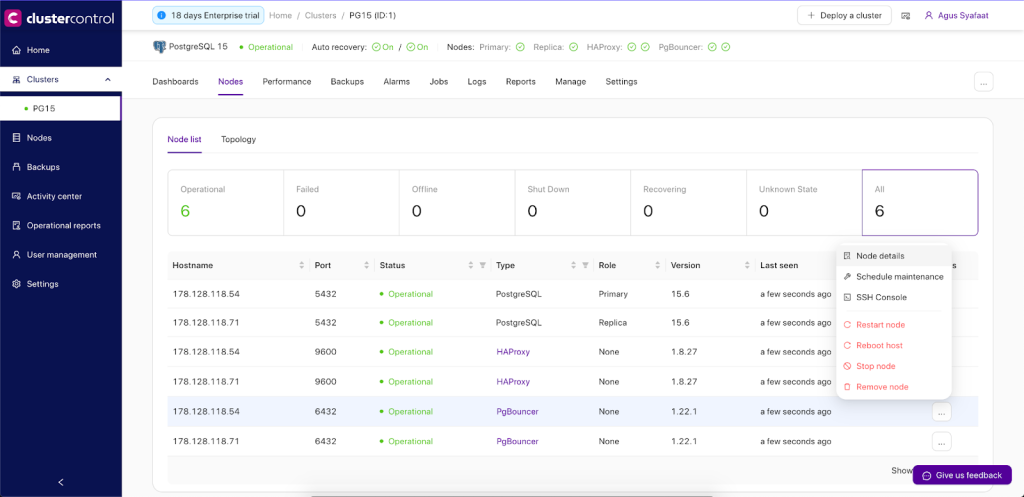
Choose the Node details and Create a new pool. Select the PgBouncer hostname, define the pool name, and choose the username, pool size, pool mode, and maximum connection.
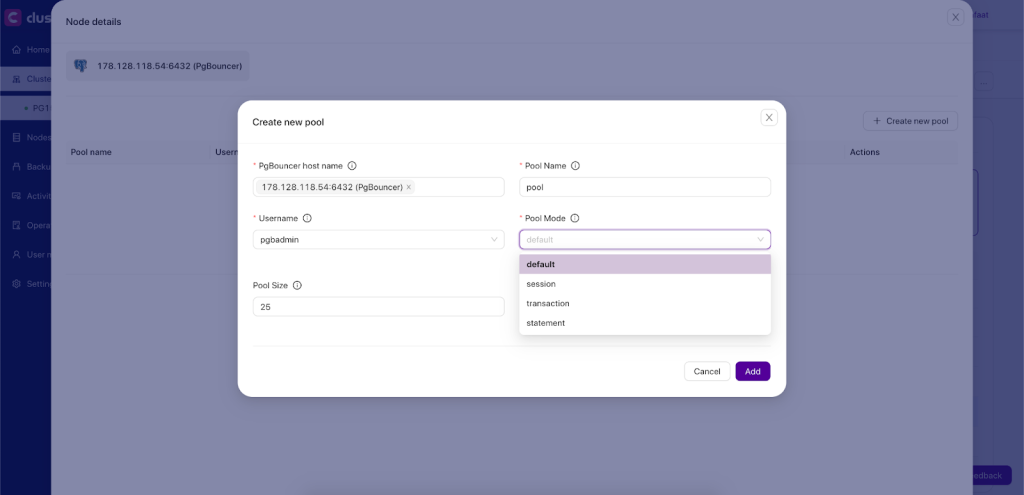
There are 3 modes in the PgBouncer Pool, which are:
- Session: In session pooling mode, each client connection is assigned a dedicated database connection for the entire duration of the session. This means once a client connects, they hold onto that specific database connection until they disconnect. This mode is suitable for applications that maintain a persistent connection to the database and where stateful information needs to be preserved across multiple queries within a session.
- Transactions: Transaction pooling mode allocates a database connection to a client only for the duration of a single transaction. Once the transaction completes, the connection is returned to the pool and can be reused by another client.
- Statements: In statement pooling mode, a database connection is assigned to a client only for the duration of executing a single SQL statement. After the statement is executed, the connection is immediately returned to the pool, ready to be used by another client for the next SQL statement.
Additional resources
How to set up SQL Load Balancing with HAProxy
Performance Tuning of HAProxy for Database Load Balancing webinar replay