blog
Understanding the ProxySQL Audit Log

ProxySQL became a very important bit of infrastructure in the database environments. It works as a load balancer, it helps to shape the flow of the traffic and reduce the downtime. With great power comes great responsibility. How can you stay up to date on who is accessing the ProxySQL configuration? Who is connecting to the database through ProxySQL? Those questions can be answered using ProxySQL Audit Log, which is available starting from ProxySQL 2.0.5. In this blog post we will look into how to enable this feature and how the log contents look like.
The initial steps will be to deploy ProxySQL. We can easily do that using ClusterControl – both MySQL Replication and Galera Cluster types support ProxySQL deployment.
Assuming we have a cluster up and running, we can deploy ProxySQL from Manage -> LoadBalancers:
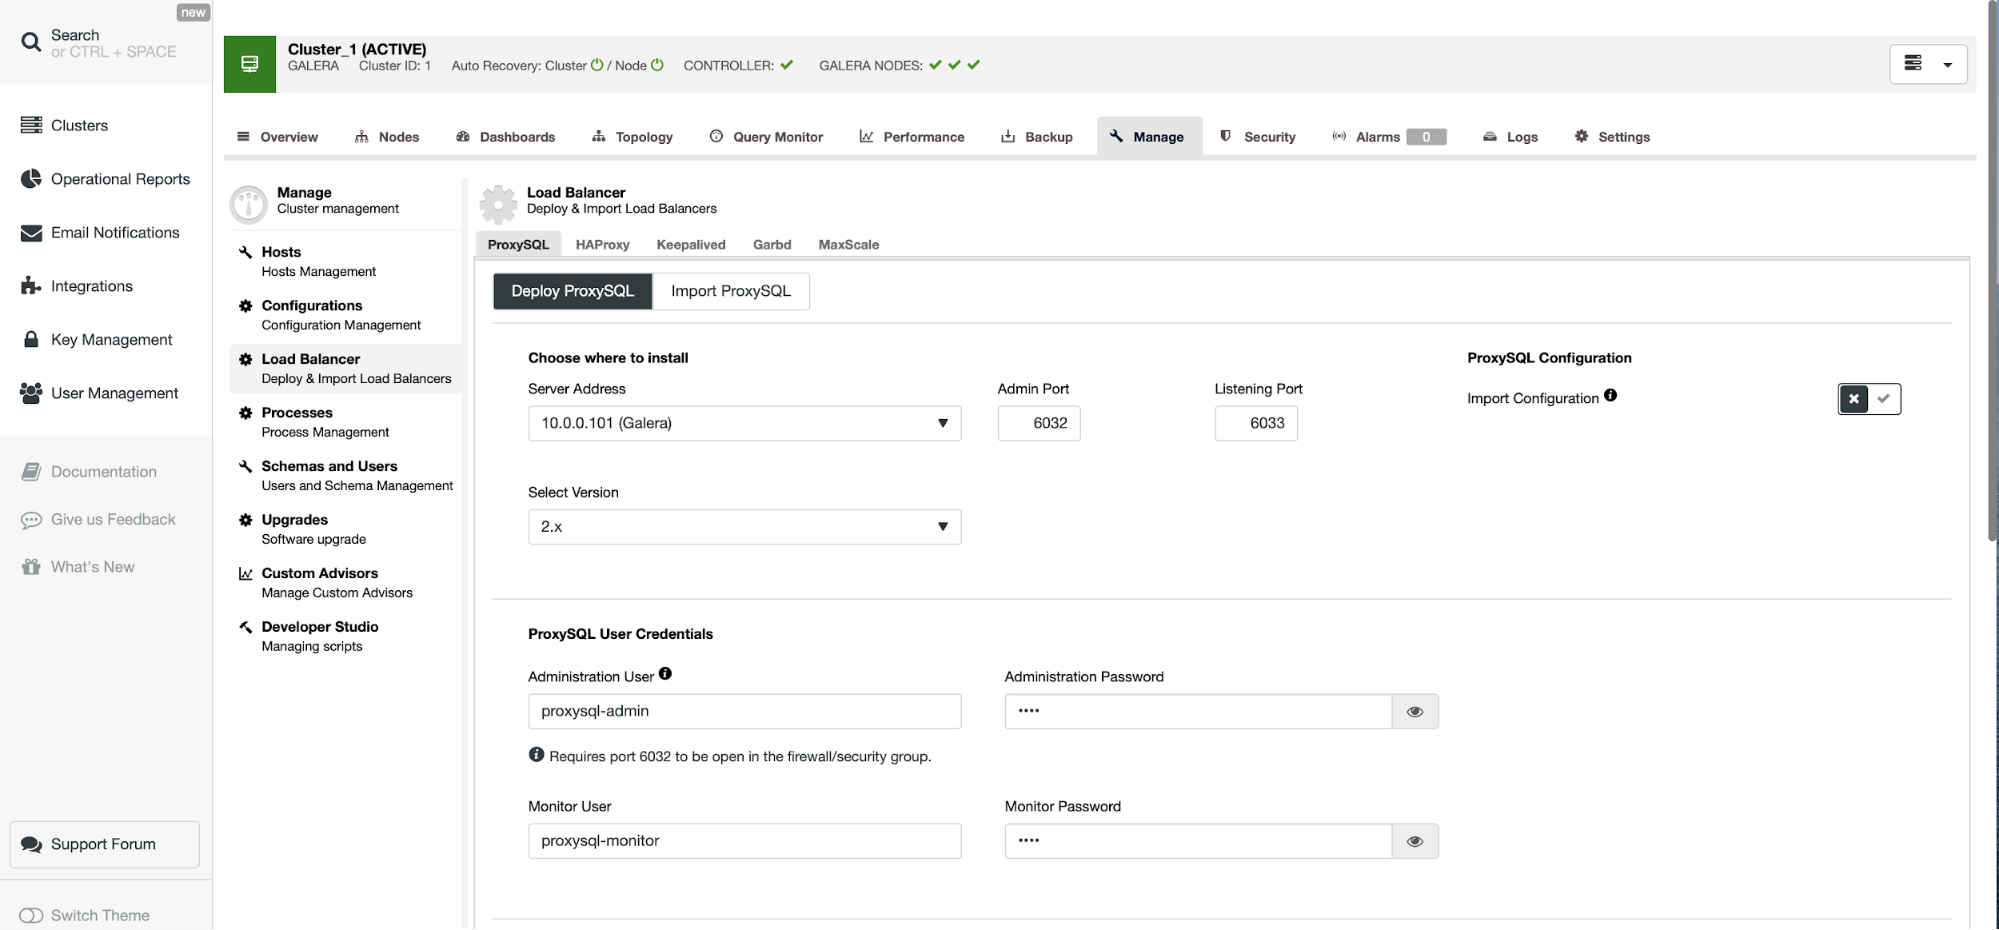
We have to decide on which node ProxySQL should be installed, its version (we’ll keep the default 2.x) and define credentials for ProxySQL administrative and monitoring users.
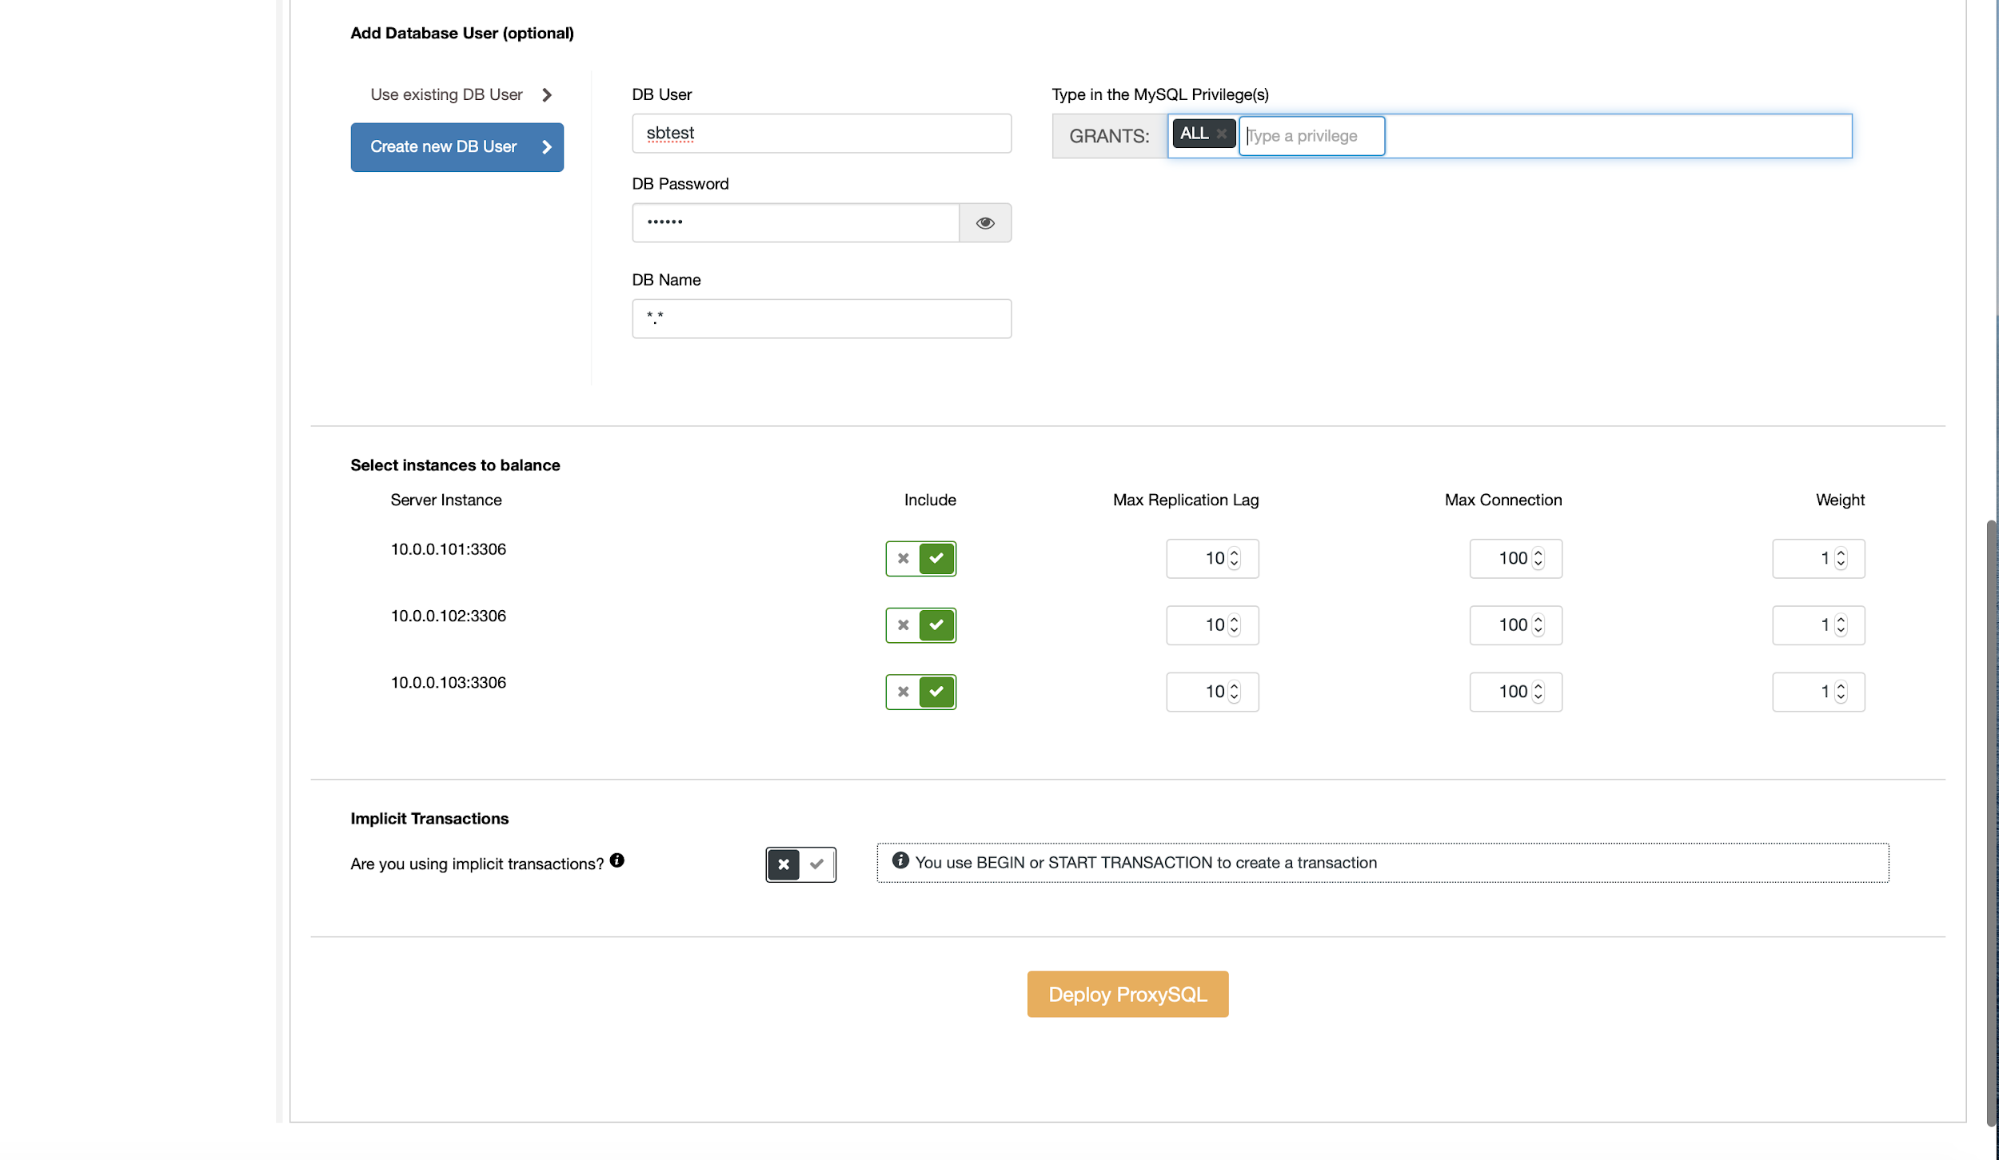
Below we can either import existing application users from the database or create a new one by assigning name, password, schema and MySQL privileges. We can then configure which nodes should be included in ProxySQL and decide if we use implicit transactions or not. Once everything is done, we can deploy ProxySQL. For high availability you probably want to add a second ProxySQL and then keepalived on top of them. Keepalived can also be easily deployed from ClusterControl:
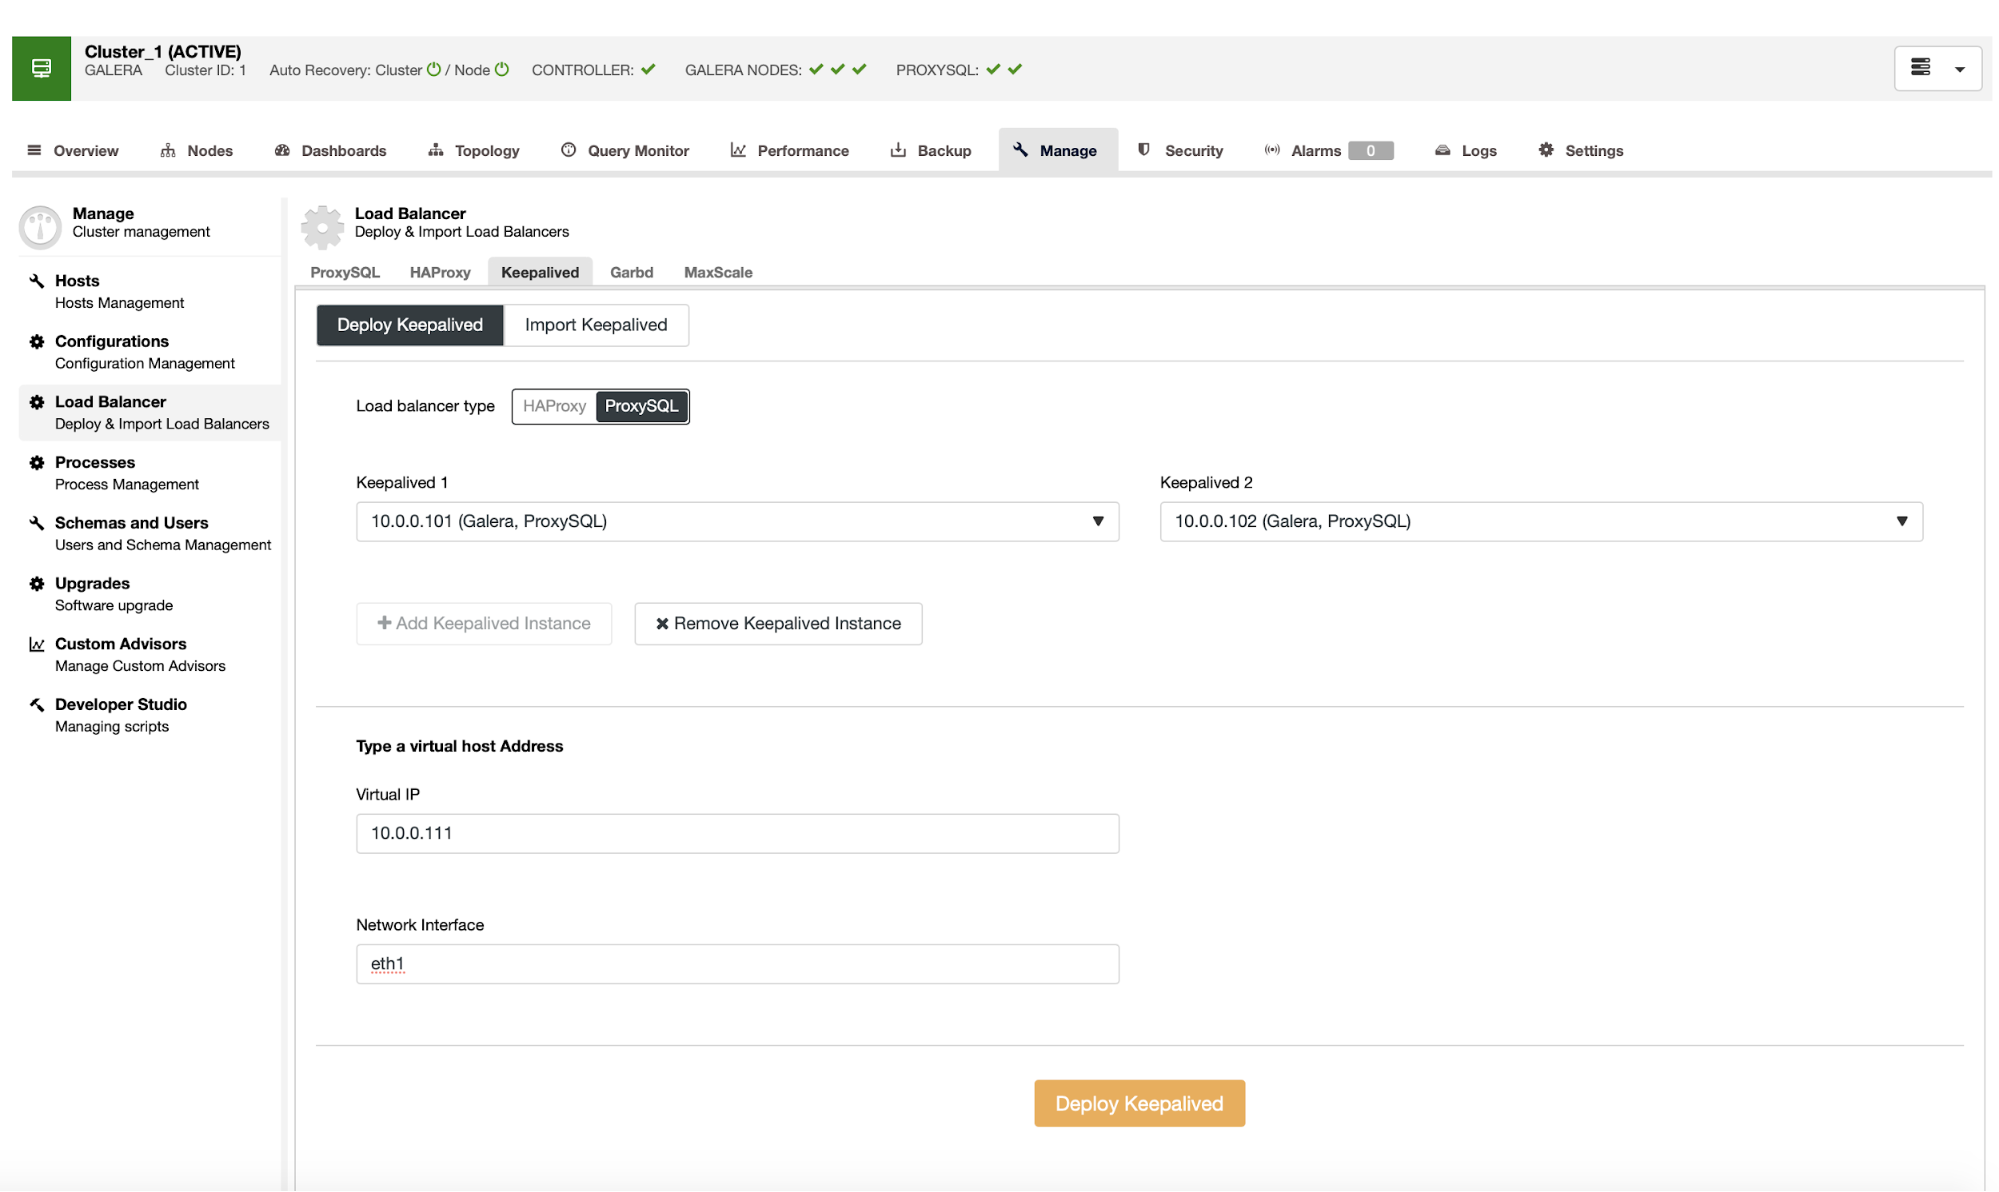
Here we have to pick nodes on which ProxySQL is deployed, pass the Virtual IP and network interface VIP should be assigned to. Once this is done, ClusterControl can deploy Keepalived for you.
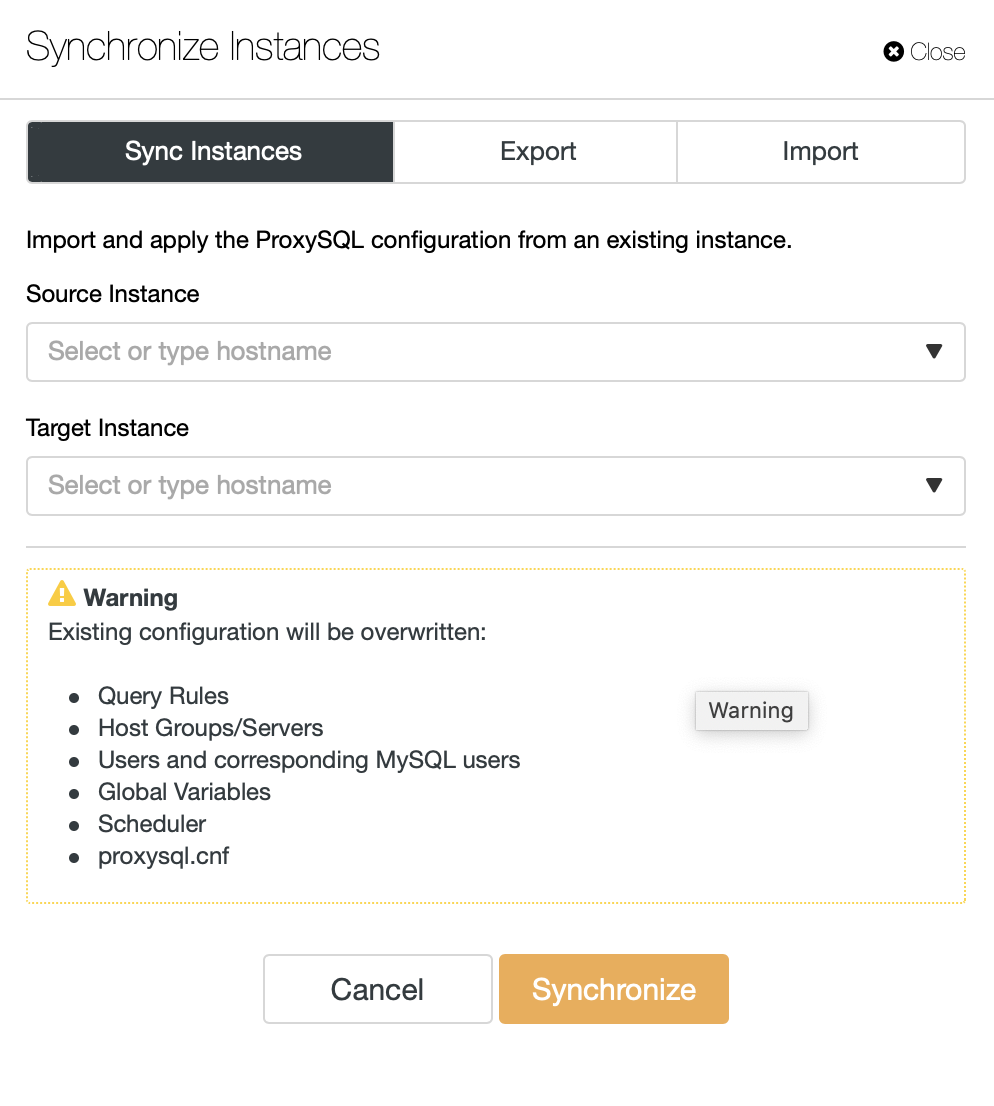
Now, let’s take a look at the audit log. All configurations should be performed on both ProxySQL nodes. Alternatively you can use an option to sync the nodes:
There are two settings that govern how the audit log should work:
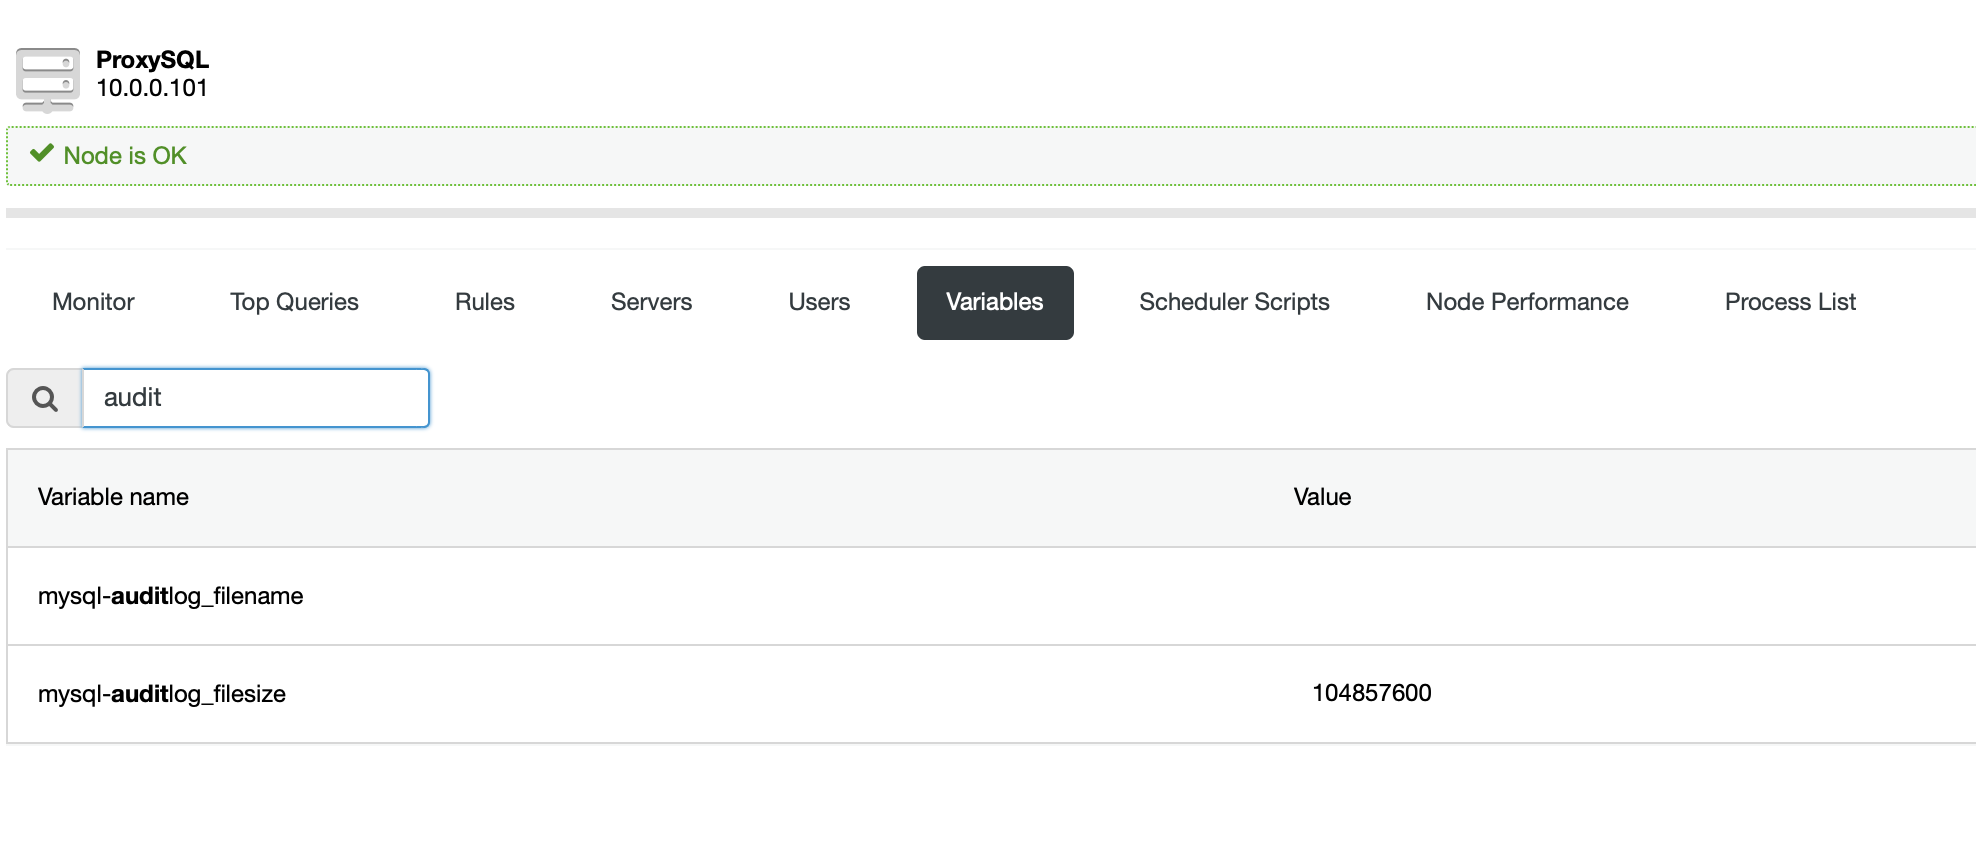
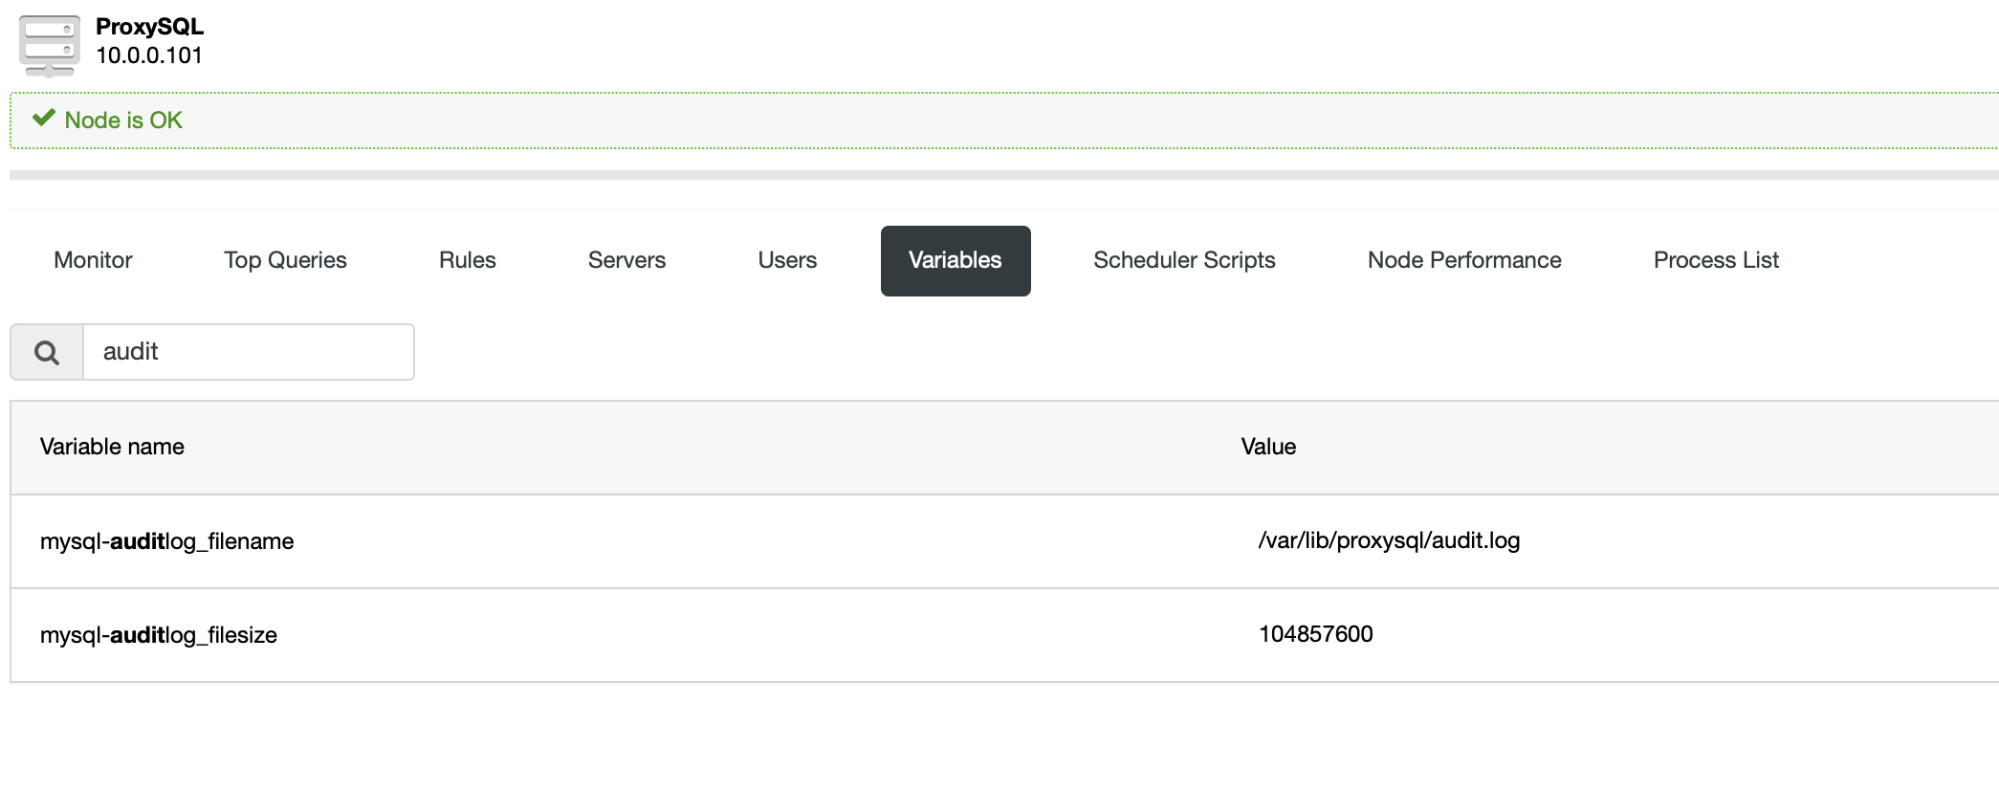
The first one defines the file where data should be stored, the second tells how large the log file should be before it’ll be rotated. Let’s configure log in ProxySQL data directory:
Now, we can take a look at the data we see in the audit log file. First of all, the format in which data is stored is JSON. There are two types of events, one related to MySQL connectivity and second related to ProxySQL admin interface connectivity.
Here is an example of entries triggered by MySQL traffic:
  "client_addr": "10.0.0.100:40578",

  "event": "MySQL_Client_Connect_OK",

  "proxy_addr": "0.0.0.0:6033",

  "schemaname": "sbtest",

  "ssl": false,

  "thread_id": 810,

  "time": "2020-01-23 14:24:17.595",

  "timestamp": 1579789457595,

  "username": "sbtest"

}

{

  "client_addr": "10.0.0.100:40572",

  "event": "MySQL_Client_Quit",

  "proxy_addr": "0.0.0.0:6033",

  "schemaname": "sbtest",

  "ssl": false,

  "thread_id": 807,

  "time": "2020-01-23 14:24:17.657",

  "timestamp": 1579789457657,

  "username": "sbtest"

}

{

  "client_addr": "10.0.0.100:40572",

  "creation_time": "2020-01-23 14:24:17.357",

  "duration": "299.653ms",

  "event": "MySQL_Client_Close",

  "extra_info": "MySQL_Thread.cpp:4307:process_all_sessions()",

  "proxy_addr": "0.0.0.0:6033",

  "schemaname": "sbtest",

  "ssl": false,

  "thread_id": 807,

  "time": "2020-01-23 14:24:17.657",

  "timestamp": 1579789457657,

  "username": "sbtest"

}
As you can see, most of the data repeats: client address, ProxySQL address, schema name, if SSL was used in connections, related thread number in MySQL, user that created the connection. The “MySQL_Client_Close” event also contains information about the time when the connection was created and the duration of the connection. You can also see which part of ProxySQL code was responsible for closing the connection.
Admin connections are quite similar:
{

  "client_addr": "10.0.0.100:52056",

  "event": "Admin_Connect_OK",

  "schemaname": "information_schema",

  "ssl": false,

  "thread_id": 815,

  "time": "2020-01-23 14:24:19.490",

  "timestamp": 1579789459490,

  "username": "proxysql-admin"

}

{

  "client_addr": "10.0.0.100:52056",

  "event": "Admin_Quit",

  "schemaname": "information_schema",

  "ssl": false,

  "thread_id": 815,

  "time": "2020-01-23 14:24:19.494",

  "timestamp": 1579789459494,

  "username": "proxysql-admin"

}

{

  "client_addr": "10.0.0.100:52056",

  "creation_time": "2020-01-23 14:24:19.482",

  "duration": "11.795ms",

  "event": "Admin_Close",

  "extra_info": "MySQL_Thread.cpp:3123:~MySQL_Thread()",

  "schemaname": "information_schema",

  "ssl": false,

  "thread_id": 815,

  "time": "2020-01-23 14:24:19.494",

  "timestamp": 1579789459494,

  "username": "proxysql-admin"

}
The data collected is very similar, the main difference is that it is related to connections to the ProxySQL administrative interface.
Conclusion
As you can see, in a very easy way you can enable auditing of the access to ProxySQL. This, especially the administrative access, is something which should be monitored from the security standpoint. Audit plugin makes it quite easy to accomplish.


