blog
Introducing Agent-Based Database Monitoring with ClusterControl 1.7

We are excited to announce the 1.7 release of ClusterControl – the only management system you’ll ever need to take control of your open source database infrastructure!
ClusterControl 1.7 introduces new exciting agent-based monitoring features for MySQL, Galera Cluster, PostgreSQL & ProxySQL, security and cloud scaling features … and more!
Release Highlights
Monitoring & Alerting
- Agent-based monitoring with Prometheus
- New performance dashboards for MySQL, Galera Cluster, PostgreSQL & ProxySQL
Security & Compliance
- Enable/disable Audit Logging on your MariaDB databases
- Enable policy-based monitoring and logging of connection and query activity
Deployment & Scaling
- Automatically launch cloud instances and add nodes to your cloud deployments
Additional Highlights
- Support for MariaDB v10.3
View the ClusterControl ChangeLog for all the details!
View Release Details and Resources
Release Details
Monitoring & Alerting
Agent-based monitoring with Prometheus
ClusterControl was originally designed to address modern, highly distributed database setups based on replication or clustering. It provides a systems view of all the components of a distributed cluster, including load balancers, and maintains a logical topology view of the cluster.
So far we’d gone the agentless monitoring route with ClusterControl, and although we love the simplicity of not having to install or manage agents on the monitored database hosts, an agent-based approach can provide higher resolution of monitoring data and has certain advantages in terms of security.
With that in mind, we’re happy to introduce agent-based monitoring as a new feature added in ClusterControl 1.7!
It makes use of Prometheus, a full monitoring and trending system that includes built-in and active scraping and storing of metrics based on time series data. One Prometheus server can be used to monitor multiple clusters. ClusterControl takes care of installing and maintaining Prometheus as well as exporters on the monitored hosts.
Users can now enable their database clusters to use Prometheus exporters to collect metrics on their nodes and hosts, thus avoiding excessive SSH activity for monitoring and metrics collections and use SSH connectivity only for management operations.
Monitoring & Alerting
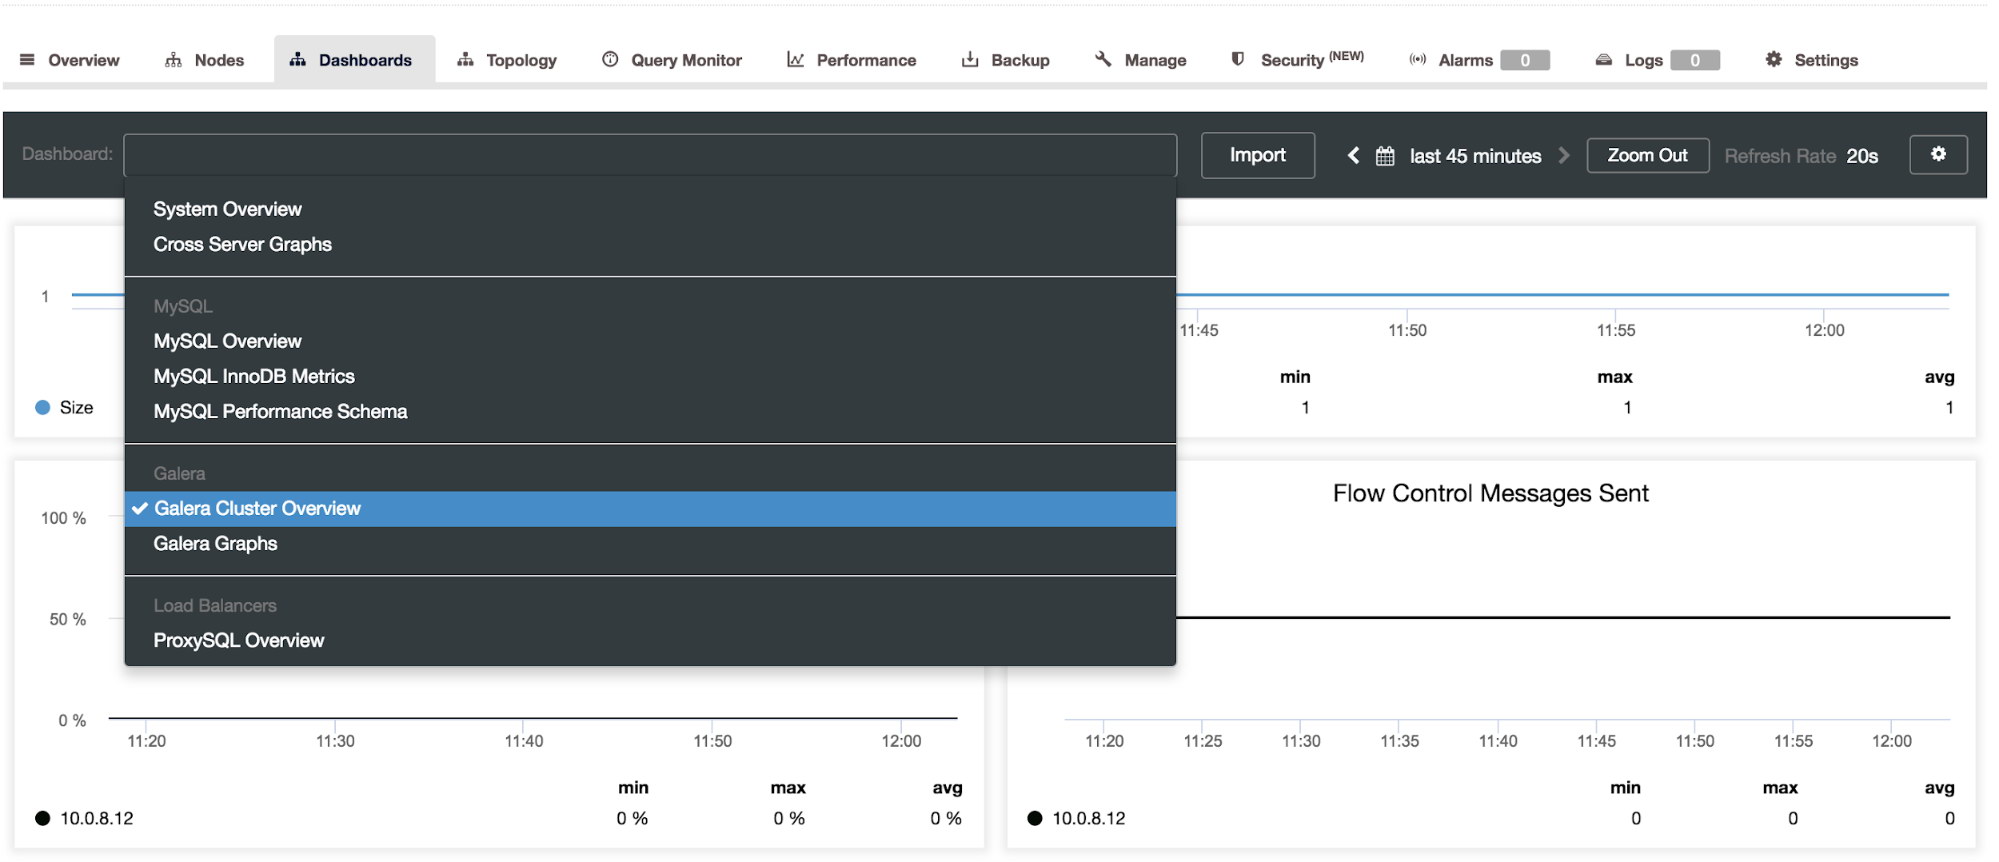
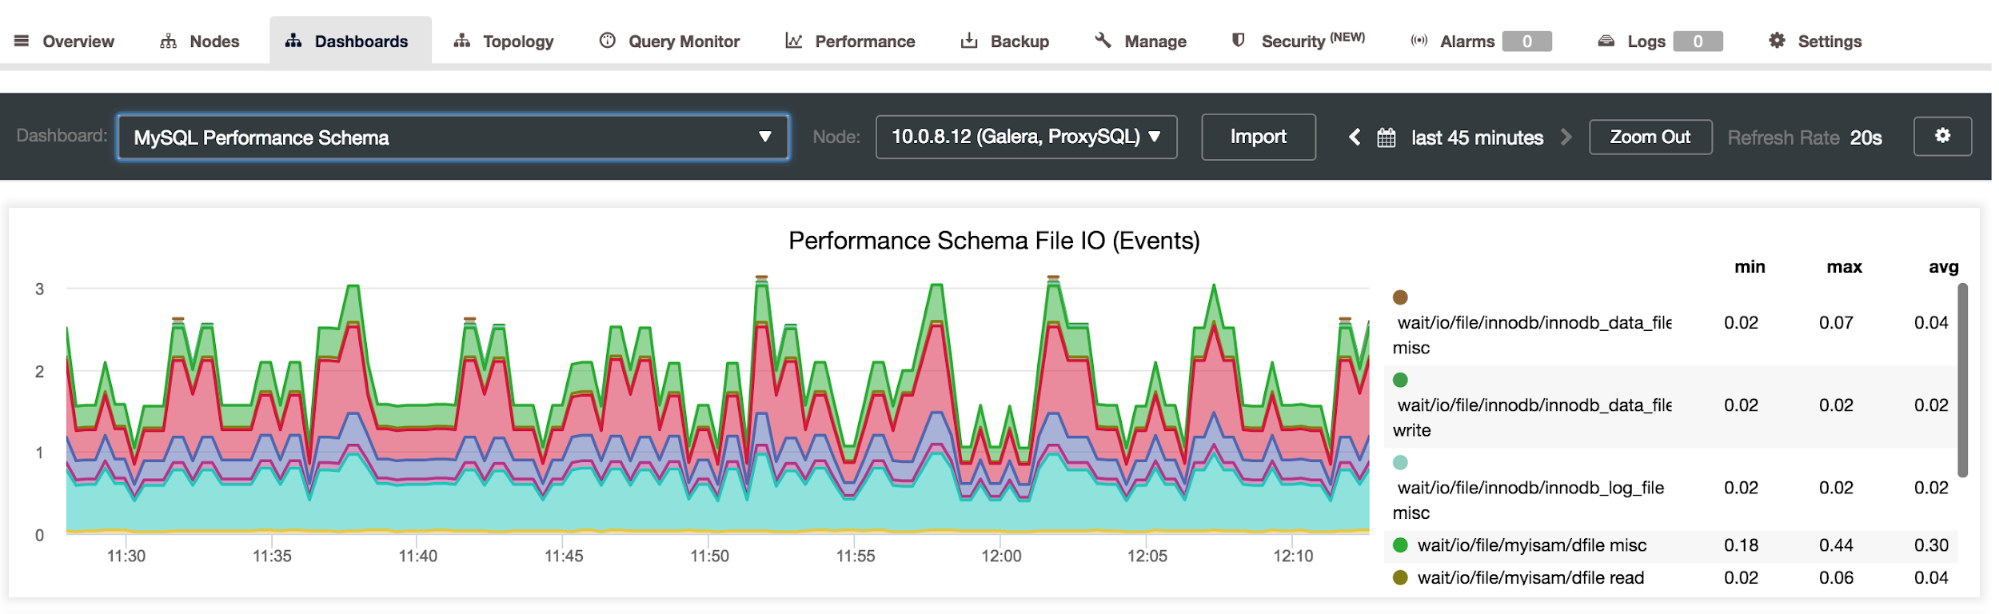
New performance dashboards for MySQL, Galera Cluster, PostgreSQL & ProxySQL
ClusterControl users now have access to a set of new dashboards that have Prometheus as the data source with its flexible query language and multi-dimensional data model, where time series data is identified by metric name and key/value pairs. This allows for greater accuracy and customization options while monitoring your database clusters.
The new dashboards include:
- Cross Server Graphs
- System Overview
- MySQL Overview, Replication, Performance Schema & InnoDB Metrics
- Galera Cluster Overview & Graphs
- PostgreSQL Overview
- ProxySQL Overview
Security & Compliance
Audit Log for MariaDB
Continuous auditing is an imperative task for monitoring your database environment. By auditing your database, you can achieve accountability for actions taken or content accessed. Moreover, the audit may include some critical system components, such as the ones associated with financial data to support a precise set of regulations like SOX, or the EU GDPR regulation. Usually, it is achieved by logging information about DB operations on the database to an external log file.
With ClusterControl 1.7 users can now enable a plugin that will log all of their MariaDB database connections or queries to a file for further review; it also introduces support for version 10.3 of MariaDB.
Additional New Functionalities
View the ClusterControl ChangeLog for all the details!
Download ClusterControl today!
Happy Clustering!


