blog
How to Identify PostgreSQL Performance Issues with Slow Queries

When working with OLTP (OnLine Transaction Processing) databases, query performance is paramount as it directly impacts the user experience. Slow queries mean that the application feels unresponsive and slow and this results in bad conversion rates, unhappy users, and all sets of problems.
OLTP is one of the common use cases for PostgreSQL therefore you want your queries to run as smooth as possible. In this blog we’d like to talk about how you can identify problems with slow queries in PostgreSQL.
Understanding the Slow Log
Generally speaking, the most typical way of identifying performance problems with PostgreSQL is to collect slow queries. There are a couple of ways you can do it. First, you can enable it on a single database:
pgbench=# ALTER DATABASE pgbench SET log_min_duration_statement=0;

ALTER DATABASE
After this all new connections to ‘pgbench’ database will be logged into PostgreSQL log.
It is also possible to enable this globally by adding:
log_min_duration_statement = 0to PostgreSQL configuration and then reload config:
pgbench=# SELECT pg_reload_conf();

 pg_reload_conf

----------------

 t

(1 row)
This enables logging of all queries across all of the databases in your PostgreSQL. If you do not see any logs, you may want to enable logging_collector = on as well. The logs will include all of the traffic coming to PostgreSQL system tables, making it more noisy. For our purposes let’s stick to the database level logging.
What you’ll see in the log are entries as below:
2020-02-21 09:45:39.022 UTC [13542] LOG:  duration: 0.145 ms statement: SELECT abalance FROM pgbench_accounts WHERE aid = 29817899;

2020-02-21 09:45:39.022 UTC [13544] LOG:  duration: 0.107 ms statement: SELECT abalance FROM pgbench_accounts WHERE aid = 11782597;

2020-02-21 09:45:39.022 UTC [13529] LOG:  duration: 0.065 ms statement: SELECT abalance FROM pgbench_accounts WHERE aid = 16318529;

2020-02-21 09:45:39.022 UTC [13529] LOG:  duration: 0.082 ms statement: UPDATE pgbench_tellers SET tbalance = tbalance + 3063 WHERE tid = 3244;

2020-02-21 09:45:39.022 UTC [13526] LOG:  duration: 16.450 ms statement: UPDATE pgbench_branches SET bbalance = bbalance + 1359 WHERE bid = 195;

2020-02-21 09:45:39.023 UTC [13523] LOG:  duration: 15.824 ms statement: UPDATE pgbench_accounts SET abalance = abalance + -3726 WHERE aid = 5290358;

2020-02-21 09:45:39.023 UTC [13542] LOG:  duration: 0.107 ms statement: UPDATE pgbench_tellers SET tbalance = tbalance + -2716 WHERE tid = 1794;

2020-02-21 09:45:39.024 UTC [13544] LOG:  duration: 0.112 ms statement: UPDATE pgbench_tellers SET tbalance = tbalance + -3814 WHERE tid = 278;

2020-02-21 09:45:39.024 UTC [13526] LOG:  duration: 0.060 ms statement: INSERT INTO pgbench_history (tid, bid, aid, delta, mtime) VALUES (4876, 195, 39955137, 1359, CURRENT_TIMESTAMP);

2020-02-21 09:45:39.024 UTC [13529] LOG:  duration: 0.081 ms statement: UPDATE pgbench_branches SET bbalance = bbalance + 3063 WHERE bid = 369;

2020-02-21 09:45:39.024 UTC [13523] LOG:  duration: 0.063 ms statement: SELECT abalance FROM pgbench_accounts WHERE aid = 5290358;

2020-02-21 09:45:39.024 UTC [13542] LOG:  duration: 0.100 ms statement: UPDATE pgbench_branches SET bbalance = bbalance + -2716 WHERE bid = 210;

2020-02-21 09:45:39.026 UTC [13523] LOG:  duration: 0.092 ms statement: UPDATE pgbench_tellers SET tbalance = tbalance + -3726 WHERE tid = 67;

2020-02-21 09:45:39.026 UTC [13529] LOG:  duration: 0.090 ms statement: INSERT INTO pgbench_history (tid, bid, aid, delta, mtime) VALUES (3244, 369, 16318529, 3063, CURRENT_TIMESTAMP);
You can see information about the query and its duration. Not much else but it’s definitely a good place to start. The main thing to keep in mind is that not every slow query is a problem. Sometimes queries have to access a significant amount of data and it is expected for them to take longer to access and analyze all of the information user asked for. Another question is what “slow” means? This mostly depends on the application. If we are talking about interactive applications, most likely anything slower than a second is noticeable. Ideally everything is executed within 100 – 200 milliseconds limit.
Developing a Query Execution Plan
Once we determine that given query is indeed something we want to improve, we should take a look at the query execution plan. First of all, it may happen that there’s nothing we can do about it and we’ll have to accept that given query is just slow. Second, query execution plans may change. Optimizers always try to pick the most optimal execution plan but they make their decisions based on just a sample of data therefore it may happen that the query execution plan changes in time. In PostgreSQL you can check the execution plan in two ways. First, the estimated execution plan, using EXPLAIN:
pgbench=# EXPLAIN SELECT abalance FROM pgbench_accounts WHERE aid = 5290358;

                                          QUERY PLAN

----------------------------------------------------------------------------------------------

 Index Scan using pgbench_accounts_pkey on pgbench_accounts  (cost=0.56..8.58 rows=1 width=4)

   Index Cond: (aid = 5290358)
As you can see, we are expected to access data using primary key lookup. If we want to double-check how exactly the query will be executed, we can use EXPLAIN ANALYZE:
pgbench=# EXPLAIN ANALYZE SELECT abalance FROM pgbench_accounts WHERE aid = 5290358;

                                                               QUERY PLAN

----------------------------------------------------------------------------------------------------------------------------------------

 Index Scan using pgbench_accounts_pkey on pgbench_accounts  (cost=0.56..8.58 rows=1 width=4) (actual time=0.046..0.065 rows=1 loops=1)

   Index Cond: (aid = 5290358)

 Planning time: 0.053 ms

 Execution time: 0.084 ms

(4 rows)
Now, PostgreSQL has executed this query and it can tell us not just the estimates but exact numbers when it comes to the execution plan, number of rows accessed and so on. Please keep in mind that logging all of the queries may become a serious overhead on your system. You should also keep an eye on the logs and ensure they are properly rotated.
Pg_stat_statements
Pg_stat_statements is the extension that collects execution statistics for different query types.
pgbench=# select query, calls, total_time, min_time, max_time, mean_time, stddev_time, rows from public.pg_stat_statements order by calls desc LIMIT 10;

                                                query                                                 | calls | total_time | min_time | max_time |     mean_time | stddev_time | rows

------------------------------------------------------------------------------------------------------+-------+------------------+----------+------------+---------------------+---------------------+-------

 UPDATE pgbench_branches SET bbalance = bbalance + $1 WHERE bid = $2                                  | 30437 | 6636.83641200002 | 0.006533 | 83.832148 | 0.218051595492329 | 1.84977058799388 | 30437

 BEGIN                                                                                                | 30437 | 231.095600000001 | 0.000205 | 20.260355 | 0.00759258796859083 | 0.26671126085716 | 0

 END                                                                                                  | 30437 | 229.483213999999 | 0.000211 | 16.980678 | 0.0075396134310215 | 0.223837608828596 | 0

 UPDATE pgbench_accounts SET abalance = abalance + $1 WHERE aid = $2                                  | 30437 | 290021.784321001 | 0.019568 | 805.171845 | 9.52859297305914 | 13.6632712046825 | 30437

 UPDATE pgbench_tellers SET tbalance = tbalance + $1 WHERE tid = $2                                   | 30437 | 6667.27243200002 | 0.00732 | 212.479269 | 0.219051563294674 | 2.13585110968012 | 30437

 SELECT abalance FROM pgbench_accounts WHERE aid = $1                                                 | 30437 | 3702.19730600006 | 0.00627 | 38.860846 | 0.121634763807208 | 1.07735927551245 | 30437

 INSERT INTO pgbench_history (tid, bid, aid, delta, mtime) VALUES ($1, $2, $3, $4, CURRENT_TIMESTAMP) | 30437 | 2349.22475800002 | 0.003218 |  61.372127 | 0.0771831901304325 | 0.971590327400244 | 30437

 SELECT $1                                                                                            | 6847 | 60.785467 | 0.002321 | 7.882384 | 0.00887767883744706 | 0.105198744982906 | 6847

 insert into pgbench_tellers(tid,bid,tbalance) values ($1,$2,$3)                                      | 5000 | 18.592042 | 0.001572 | 0.741427 | 0.0037184084 | 0.0137660355678027 | 5000

 insert into pgbench_tellers(tid,bid,tbalance) values ($1,$2,$3)                                      | 3000 | 7.323788 | 0.001598 | 0.40152 | 0.00244126266666667 | 0.00834442591085048 | 3000

(10 rows)
As you can see on the data above, we have a list of different queries and information about their execution times – this is just a part of the data you can see in the pg_stat_statements but it is enough for us to understand that our primary key lookup takes sometimes almost 39 seconds to complete – this does not look good and it is definitely something we want to investigate.
If you do not have pg_stat_statements enabled, you can do it in a standard way. Either via configuration file and
shared_preload_libraries = 'pg_stat_statements'Or you can enable it via PostgreSQL command line:
pgbench=# CREATE EXTENSION pg_stat_statements;

CREATE EXTENSION
Using ClusterControl to Eliminate Slow Queries
If you happen to use ClusterControl to manage your PostgreSQL database, you can use it to collect data about slow queries.
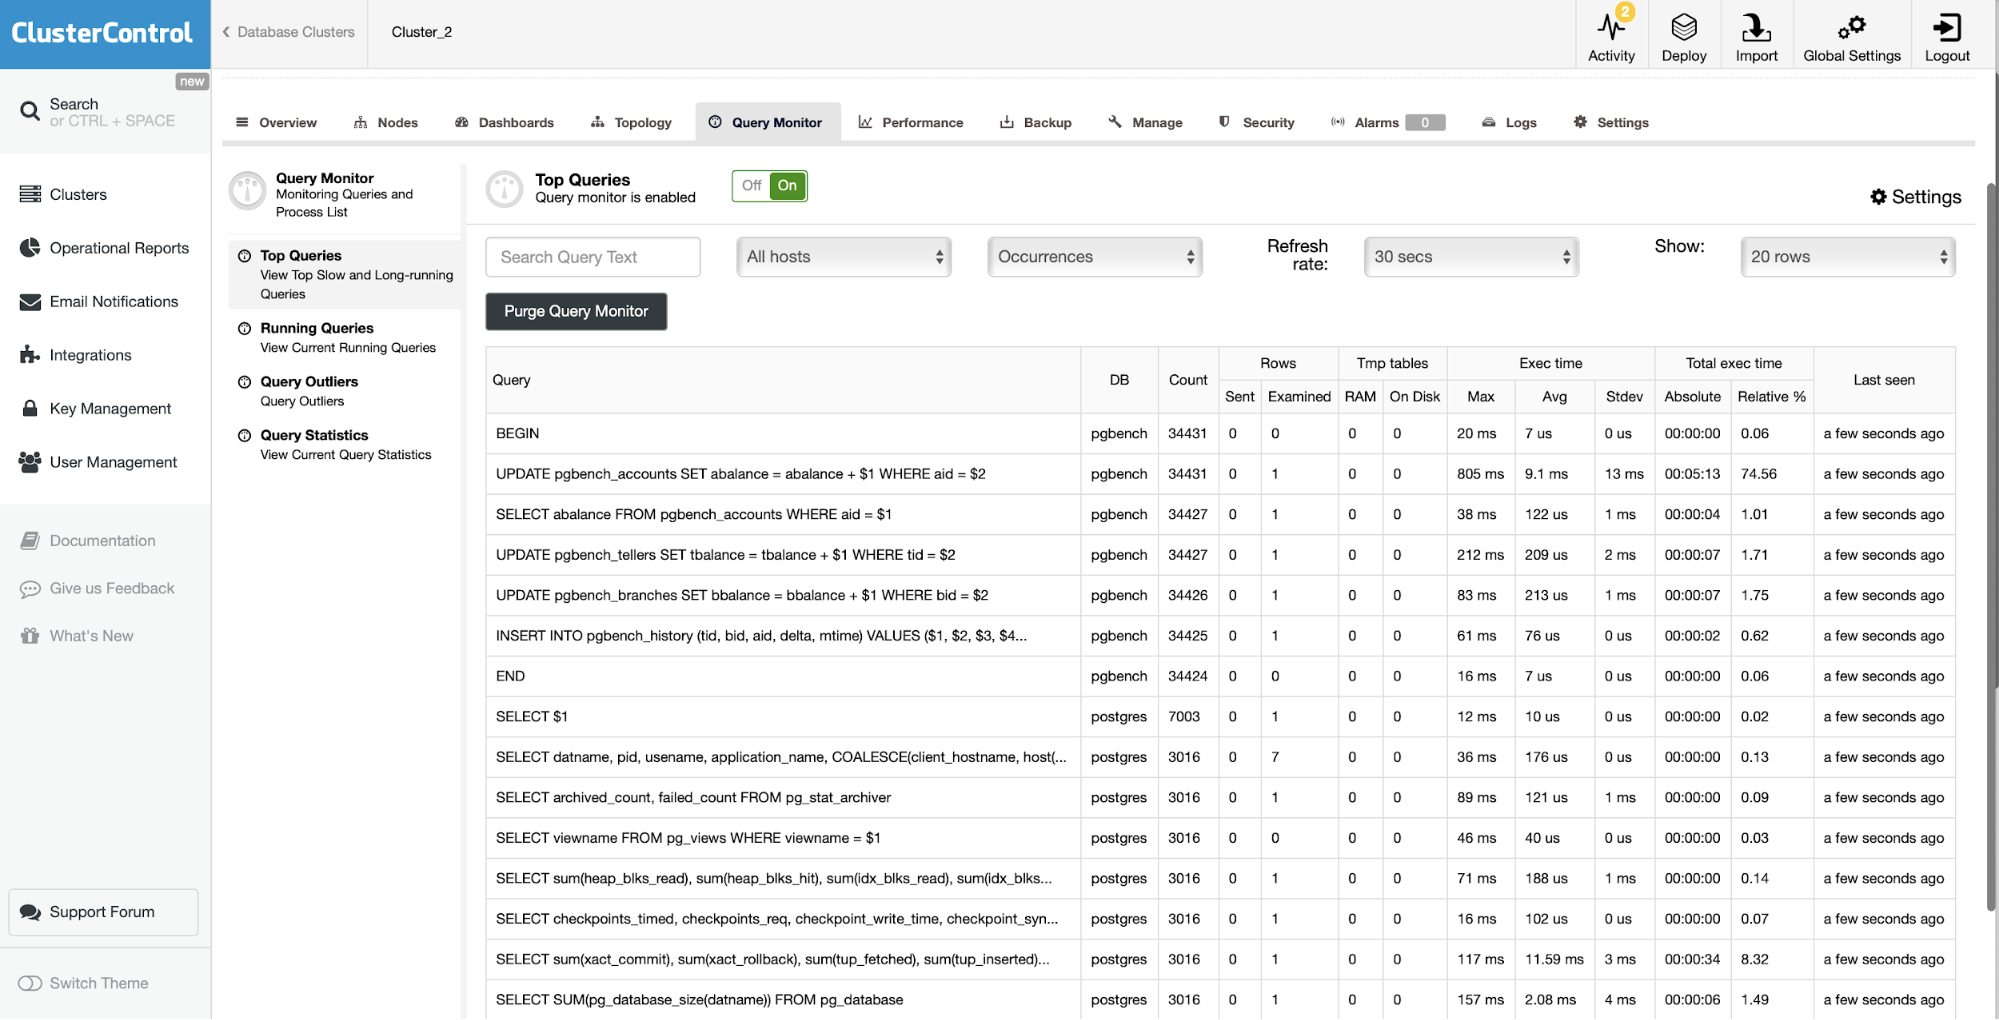
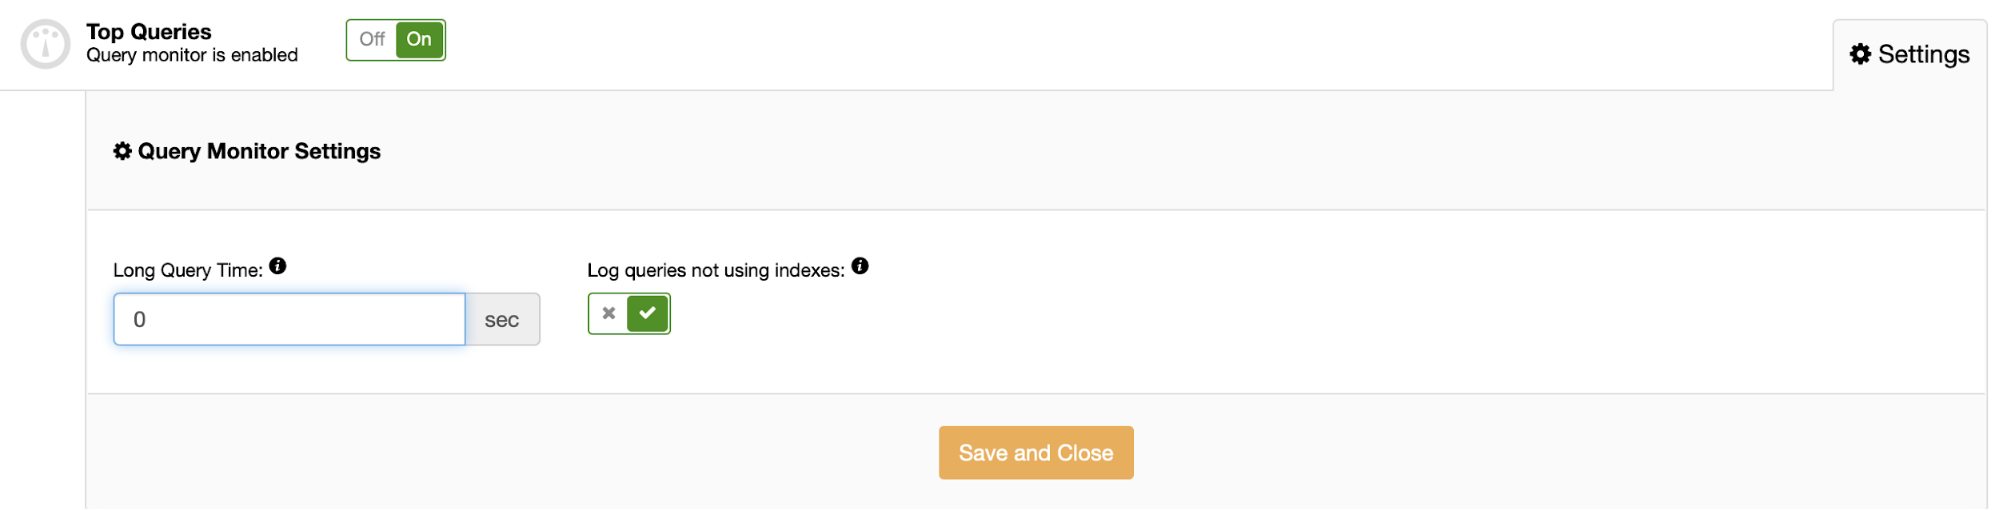
As you can see, it collects data about query execution – rows sent and examined, execution time statistics and so on. With it you can easily pinpoint the most expensive queries, and see what the average and maximum execution times looks like. By default ClusterControl collects queries that took longer than 0.5 second to complete, you can change this in the settings:
Conclusion
This short blog by no means covers all of the aspects and tools helpful in identifying and solving query performance problems in PostgreSQL. We hope it is a good start and that it will help you to understand what you can do to pinpoint the root cause of the slow queries.


