blog
How High CPU Utilization Effects Database Performance

One of the indicators to see if our database is experiencing performance issues is by looking at the CPU utilization. High CPU usage is directly proportional to disk I/O (where data is either read or written to the disk). In this blog we will take a close look at some of the parameters in the database and how they are related to the CPU core of the server.
How to Confirm if Your CPU Utilization is High
If you think you are experiencing high CPU utilization, you should check the process in the Operating System to determine what is causing the issue. To do this, you can utilize the htop / top command in the operating system.
[root@n1]# top

top - 14:10:35 up 39 days, 20:20,  2 users, load average: 0.30, 0.68, 1.13

Tasks: 461 total,   2 running, 459 sleeping,   0 stopped, 0 zombie

%Cpu(s):  0.7 us, 0.6 sy,  0.0 ni, 98.5 id, 0.1 wa,  0.0 hi, 0.0 si, 0.0 st

KiB Mem : 13145656+total,   398248 free, 12585008+used, 5208240 buff/cache

KiB Swap: 13421772+total, 11141702+free, 22800704 used.  4959276 avail Mem


  PID USER      PR NI VIRT    RES SHR S %CPU %MEM     TIME+ COMMAND

15799 mysql     20 0 145.6g 118.2g   6212 S 87.4 94.3 7184:35 mysqld

21362 root      20 0 36688 15788   2924 S 15.2 0.0 5805:21 node_exporter
From above top command, the highest CPU utilization came from mysqld daemon. You can check inside the database itself, what’s process is running :
mysql> show processlist;
+-----+----------+-------------------+--------------------+------------------+------+---------------------------------------------------------------+------------------------------------------------------------------------+-----------+---------------+
| Id | User | Host | db | Command | Time | State | Info | Rows_sent | Rows_examined |
+-----+----------+-------------------+--------------------+------------------+------+---------------------------------------------------------------+------------------------------------------------------------------------+-----------+---------------+
| 32 | rpl_user | 10.10.10.18:45338 | NULL | Binlog Dump GTID | 4134 | Master has sent all binlog to slave; waiting for more updates | NULL | 0 | 0 |
| 47 | cmon | 10.10.10.10:37214 | information_schema | Sleep | 1 | | NULL | 492 | 984 |
| 50 | cmon | 10.10.10.10:37390 | information_schema | Sleep | 0 | | NULL | 0 | 0 |
| 52 | cmon | 10.10.10.10:37502 | information_schema | Sleep | 2 | | NULL | 1 | 599 |
| 429 | root | localhost | item | Query | 4 | Creating sort index | select * from item where i_data like '%wjf%' order by i_data | 0 | 0 |
| 443 | root | localhost | item | Query | 2 | Creating sort index | select * from item where i_name like 'item-168%' order by i_price desc | 0 | 0 |
| 471 | root | localhost | NULL | Query | 0 | starting | show processlist | 0 | 0 |
+-----+----------+-------------------+--------------------+------------------+------+---------------------------------------------------------------+------------------------------------------------------------------------+-----------+---------------+
7 rows in set (0.00 sec)There are some running queries (as shown above) and it’s the SELECT query to the table item with state Creating sort index. The meaning of the creating sort index state is where the database is figuring out the order of returned values based on the order clause, the constraint with availability of CPU speed. So if you have limited CPU cores, this will impact the query.
Enabling a slow query log is beneficial to check if there’s an issue from the application side. You can enable the slow query by setting two parameters in the database, which is slow_query_log and long_query_time. Parameter slow_query_log must be set to ON to enable the slow query log, and long_query_time parameter is used for the threshold alert of long running query. There is also one parameter related to location of slow query file, slow_query_log_file can be set to any path to store the slow query log file.
mysql> explain select * from item where i_data like '%wjf%' order by i_data;

+----+-------------+-------+------------+------+---------------+------+---------+------+---------+----------+-----------------------------+

| id | select_type | table | partitions | type | possible_keys | key  | key_len | ref | rows | filtered | Extra |

+----+-------------+-------+------------+------+---------------+------+---------+------+---------+----------+-----------------------------+

|  1 | SIMPLE      | item | NULL     | ALL | NULL   | NULL | NULL | NULL | 9758658 |    11.11 | Using where; Using filesort |

+----+-------------+-------+------------+------+---------------+------+---------+------+---------+----------+-----------------------------+

1 row in set, 1 warning (0.00 sec)
The long running queries (as shown above) were using a full table scan as the access method, you can see by checking the value of the column type, in this case it’s ALL. It means it will scan all the rows in the table to produce the data. The number of rows examined by the query is also quite large, around 9758658 rows, of course it will take more CPU time to spend on the query.
How ClusterControl Dashboards Identify is Running CPU High
ClusterControl helps with your daily routine and tasks and let’s you know if there’s something happening in your system, such as a high CPU. You can check the dashboard directly regarding CPU utilization.
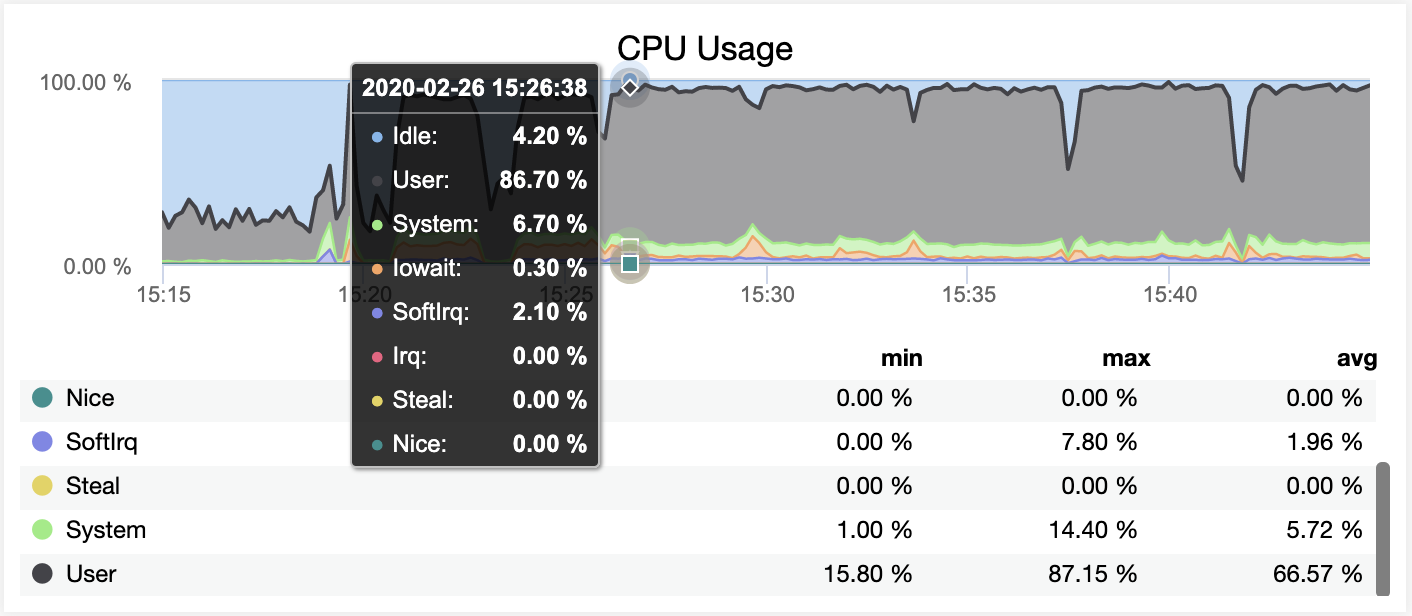
As you can see on the screenshot above, we can clearly tell that CPU utilisation is quite high and there are significant spikes even up to 87%. The graph do not tell more, but you can always check the ‘top’ command in the shell or you can dig up what are currently running processes in the server from Top dashboard, as shown below :
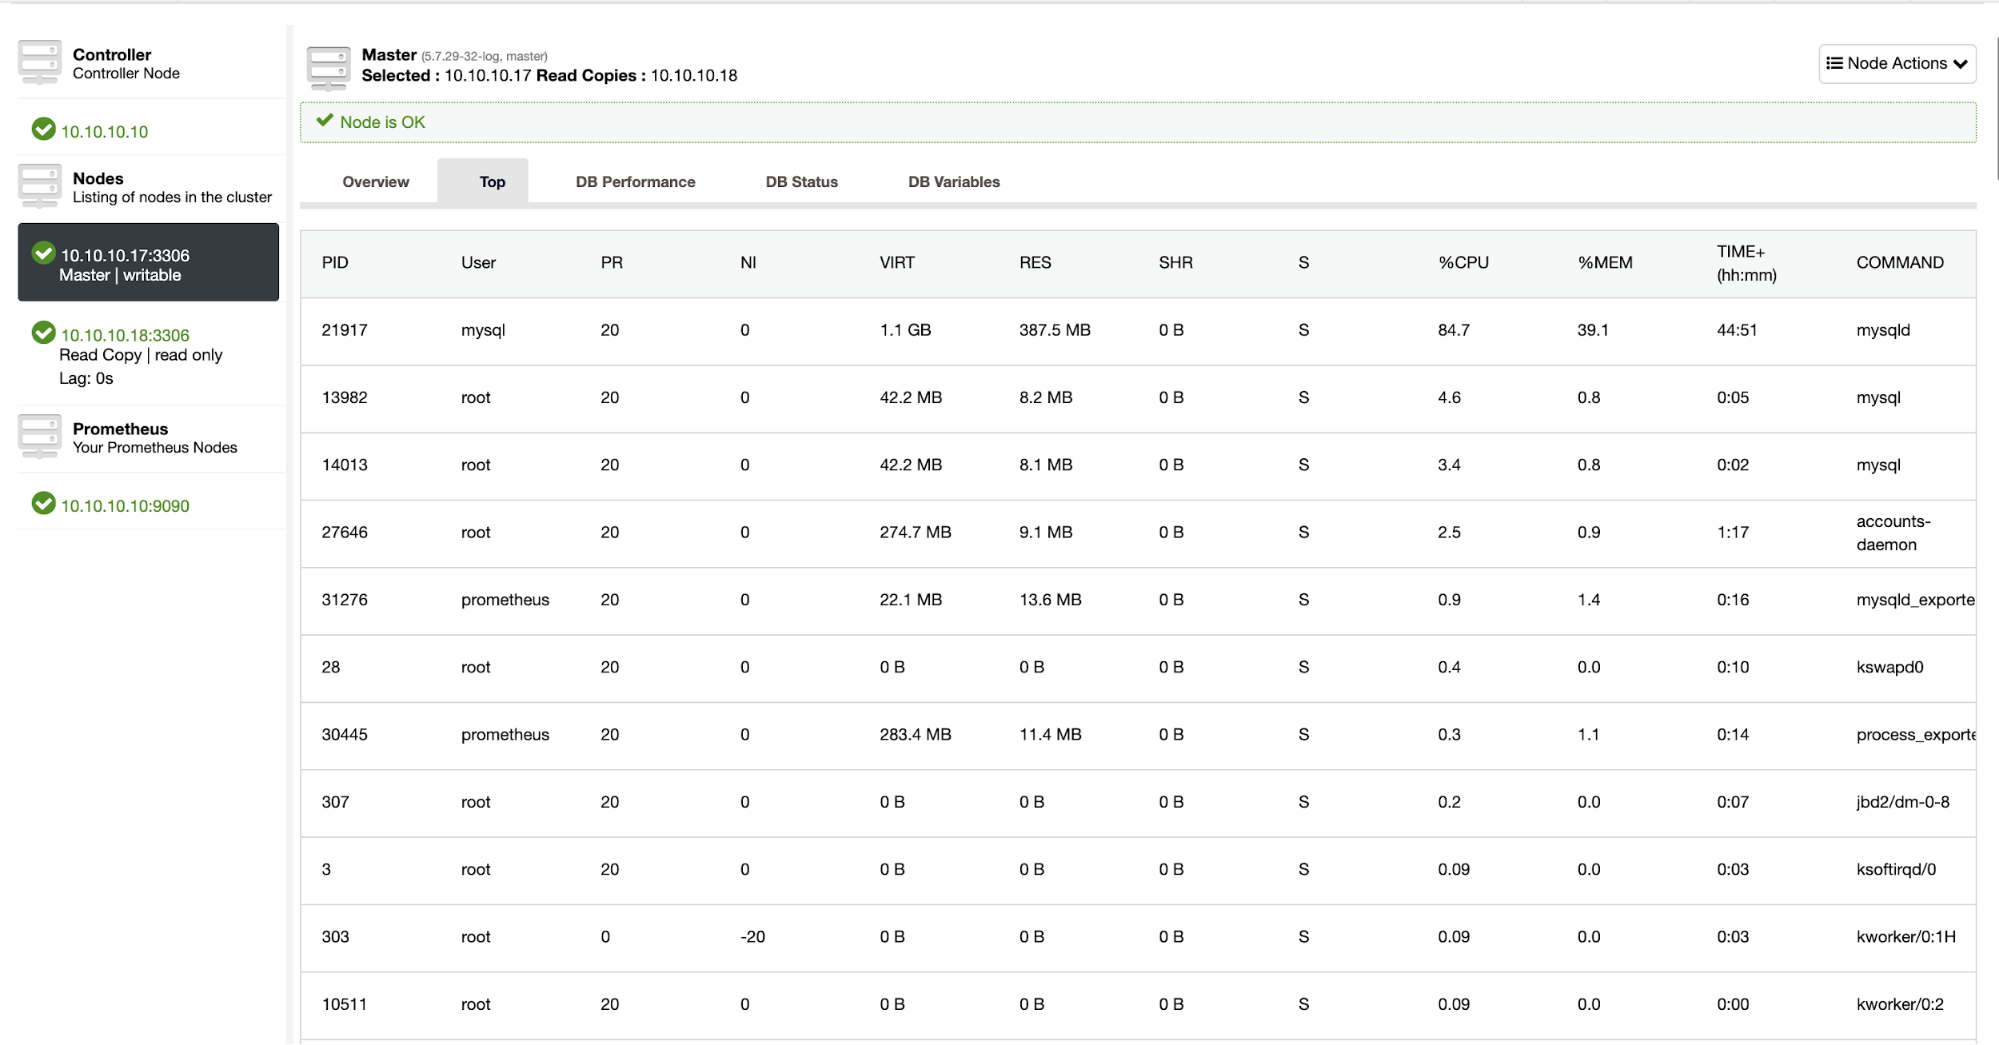
If you see from the top dashboard, most of the CPU resources are taken by the mysqld daemon process. This mysqld process is the suspect who consumes a lot of CPU resources. You can dig inside the database more to check what is running, you also can check the running queries and top queries in the database through dashboard as shown below
Running Queries Dashboard
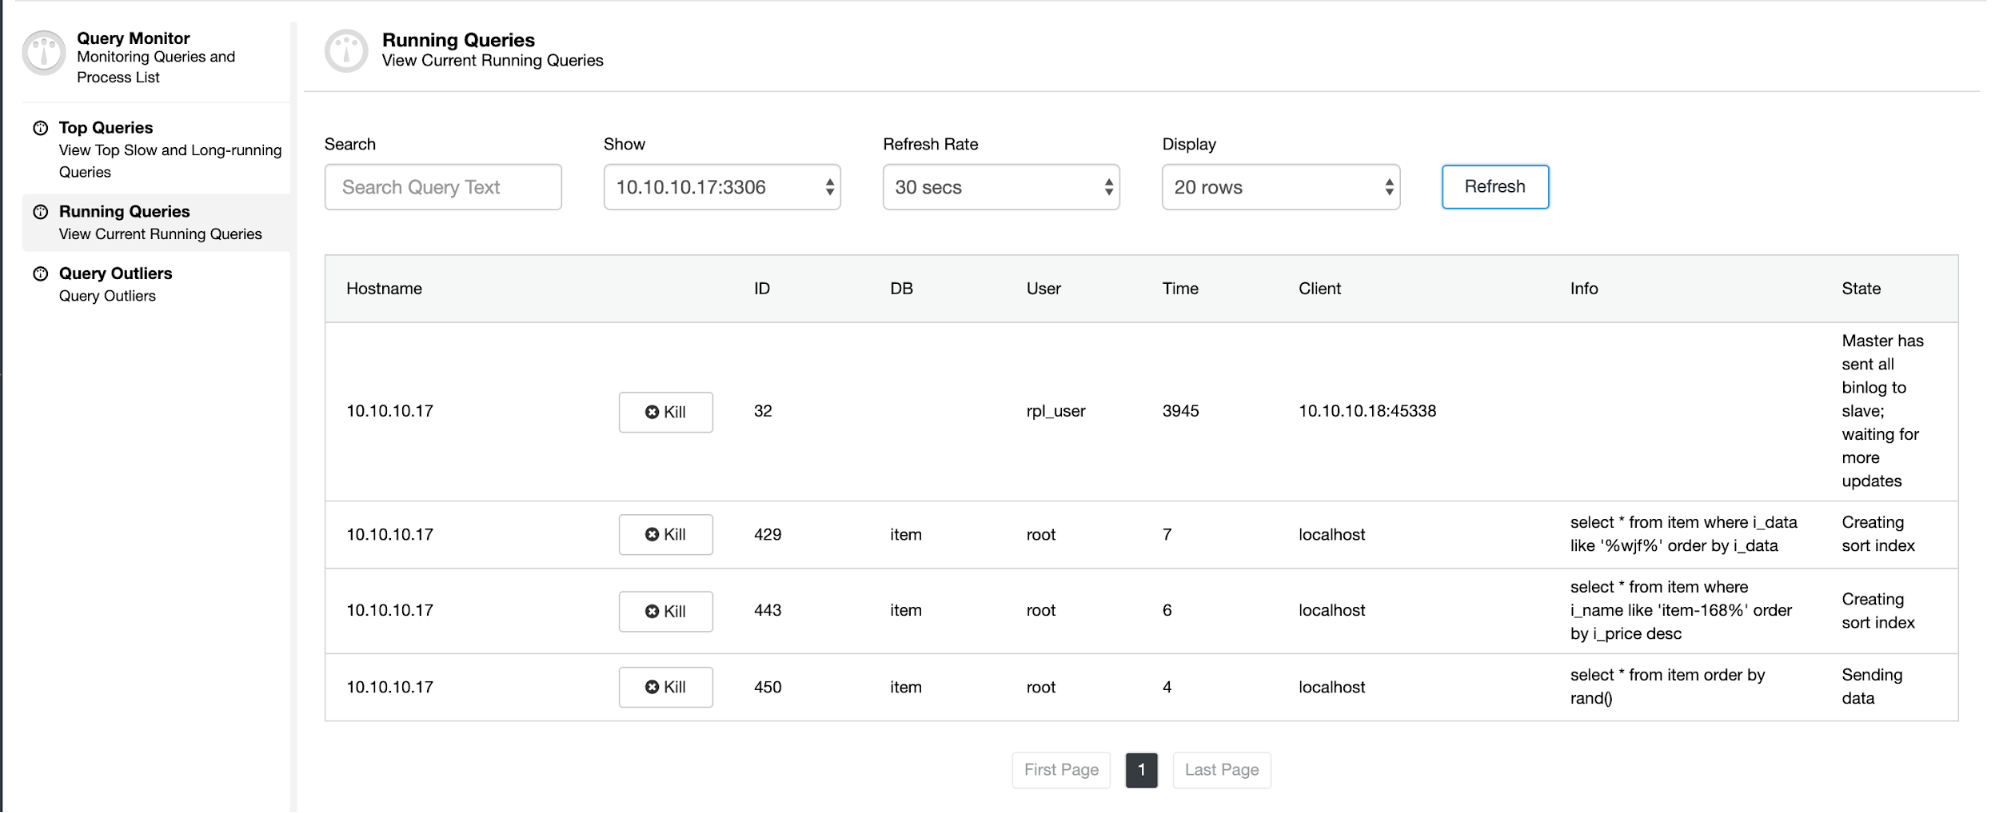
From the Running Queries dashboard, you can see the query executed, time spent of the query, state of the query itself. User and db info is related to the user who executed the query in which database.
Top Queries Dashboard
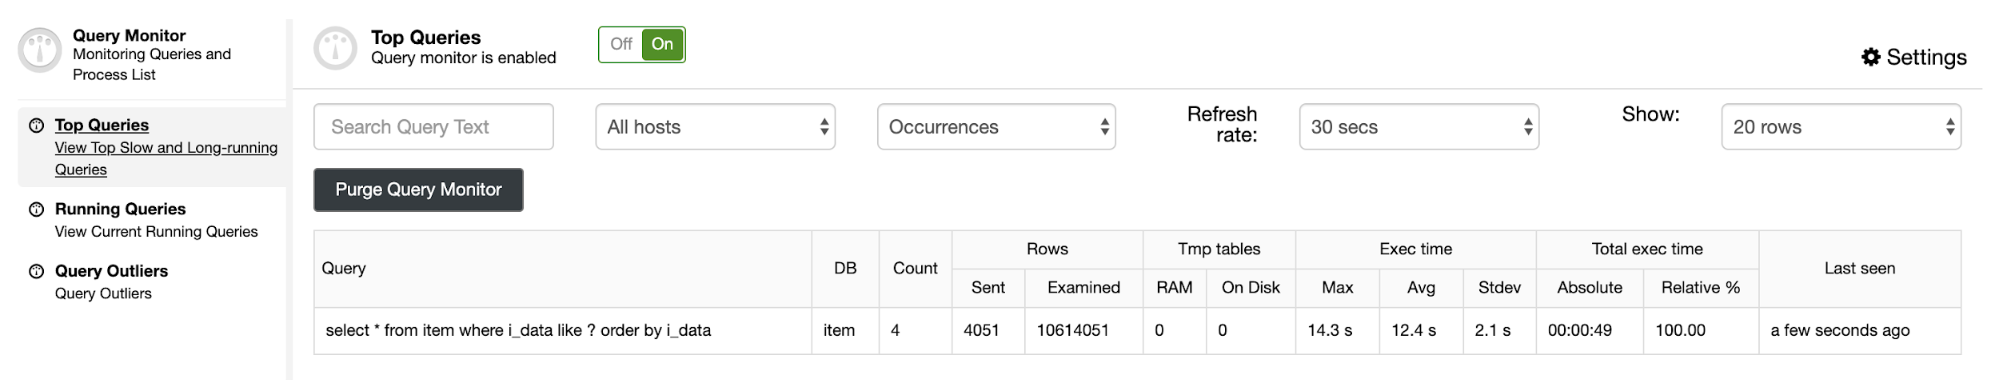
From the Top Queries dashboard, we can see the query that is causing the problem. The query scans 10614051 rows in the item table. The average execution time of the query is around 12.4 seconds, which is quite long for the query.
Conclusion
Troubleshooting CPU high is not so difficult, you just need to know what is currently running in the database server, with the help of the right tool, you can fix the problem immediately.