blog
Database Monitoring with ClusterControl

Data observability is a critical piece of the database operations puzzle – Data allows you visibility into the state and health of your critical systems. Ideally, this data should be available in one single location. When you have multiple applications, each handling separate pieces of data, you set yourself up for potentially serious issues. When issues arise, you need to be able to quickly assess the situation and determine what is going on rather than trying to analyze and merge reports from multiple sources.
ClusterControl, among other features, provides users with one single point from which to track the health of their databases. In this blog post, we will demonstrate some of the observability features available in ClusterControl.
Overview Tab
The Overview section is a consolidated place where users can easily track the state of one cluster, including all the cluster nodes and any load balancers.
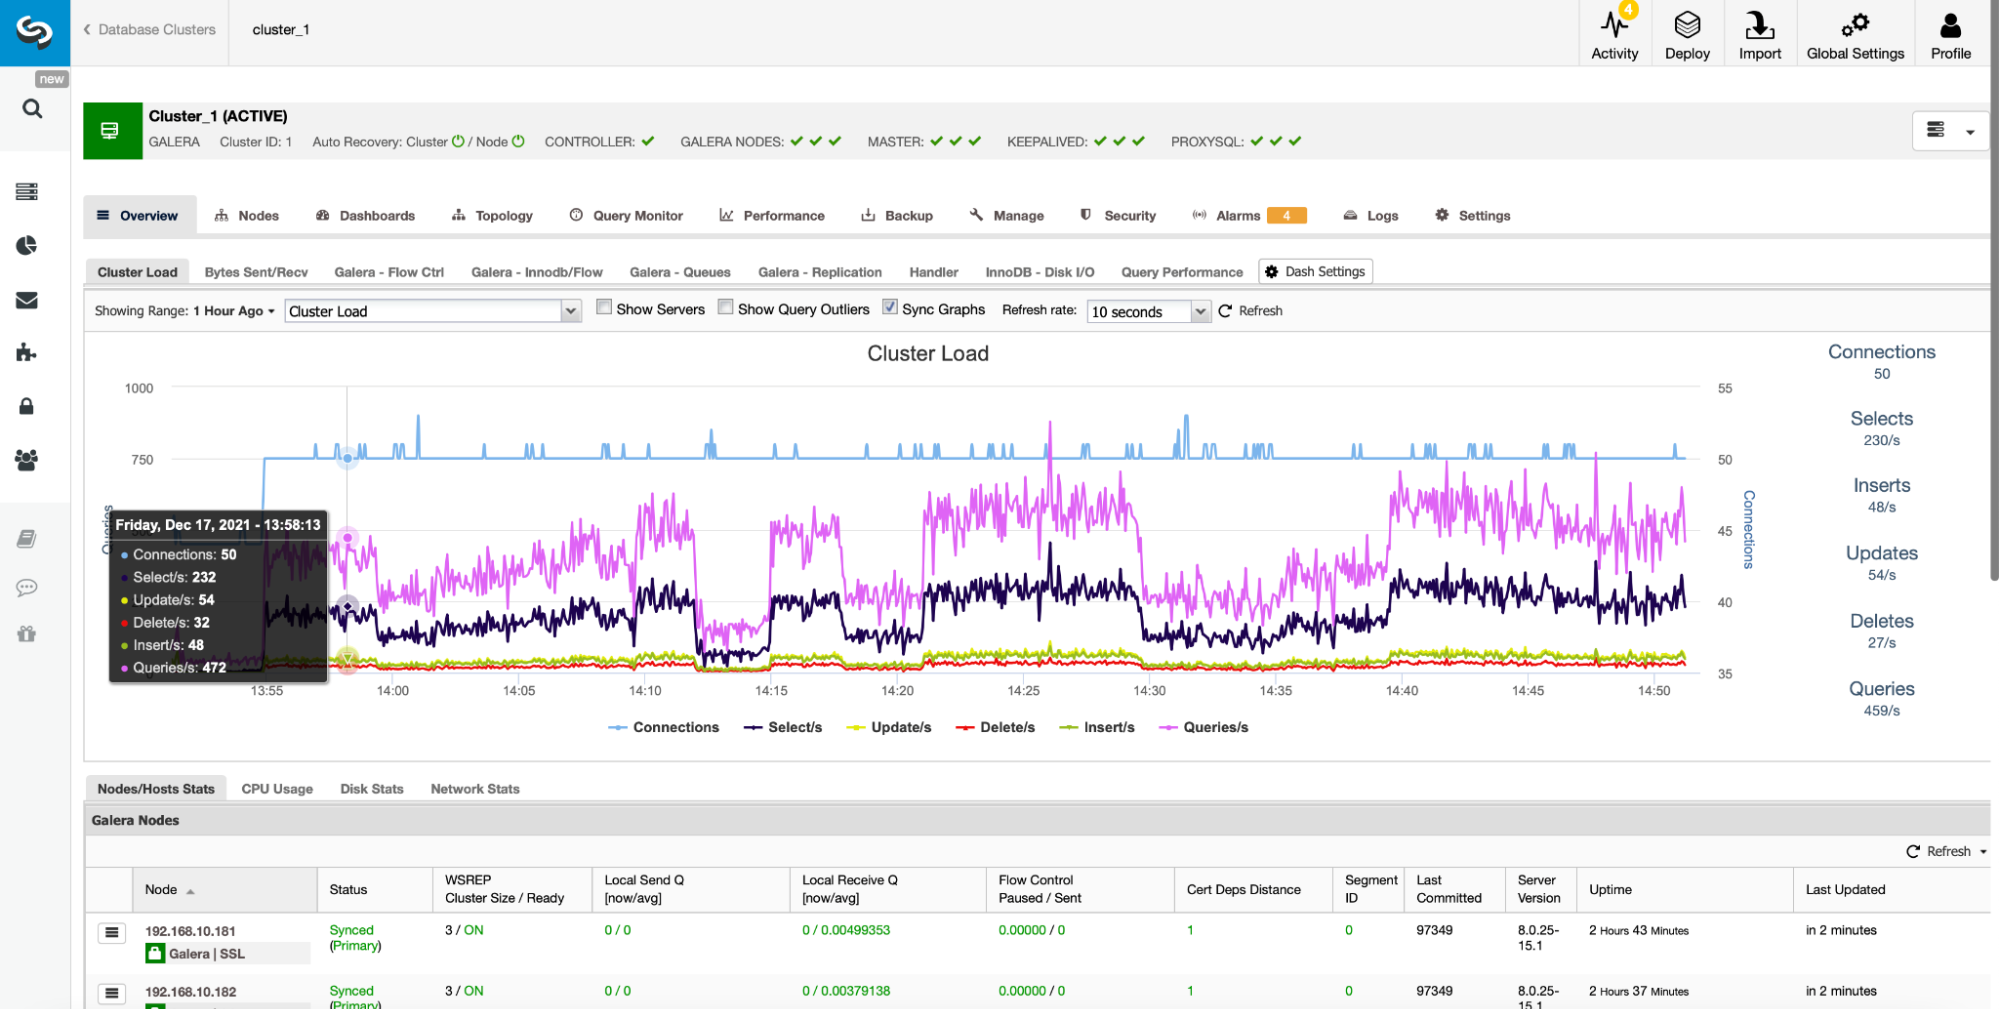
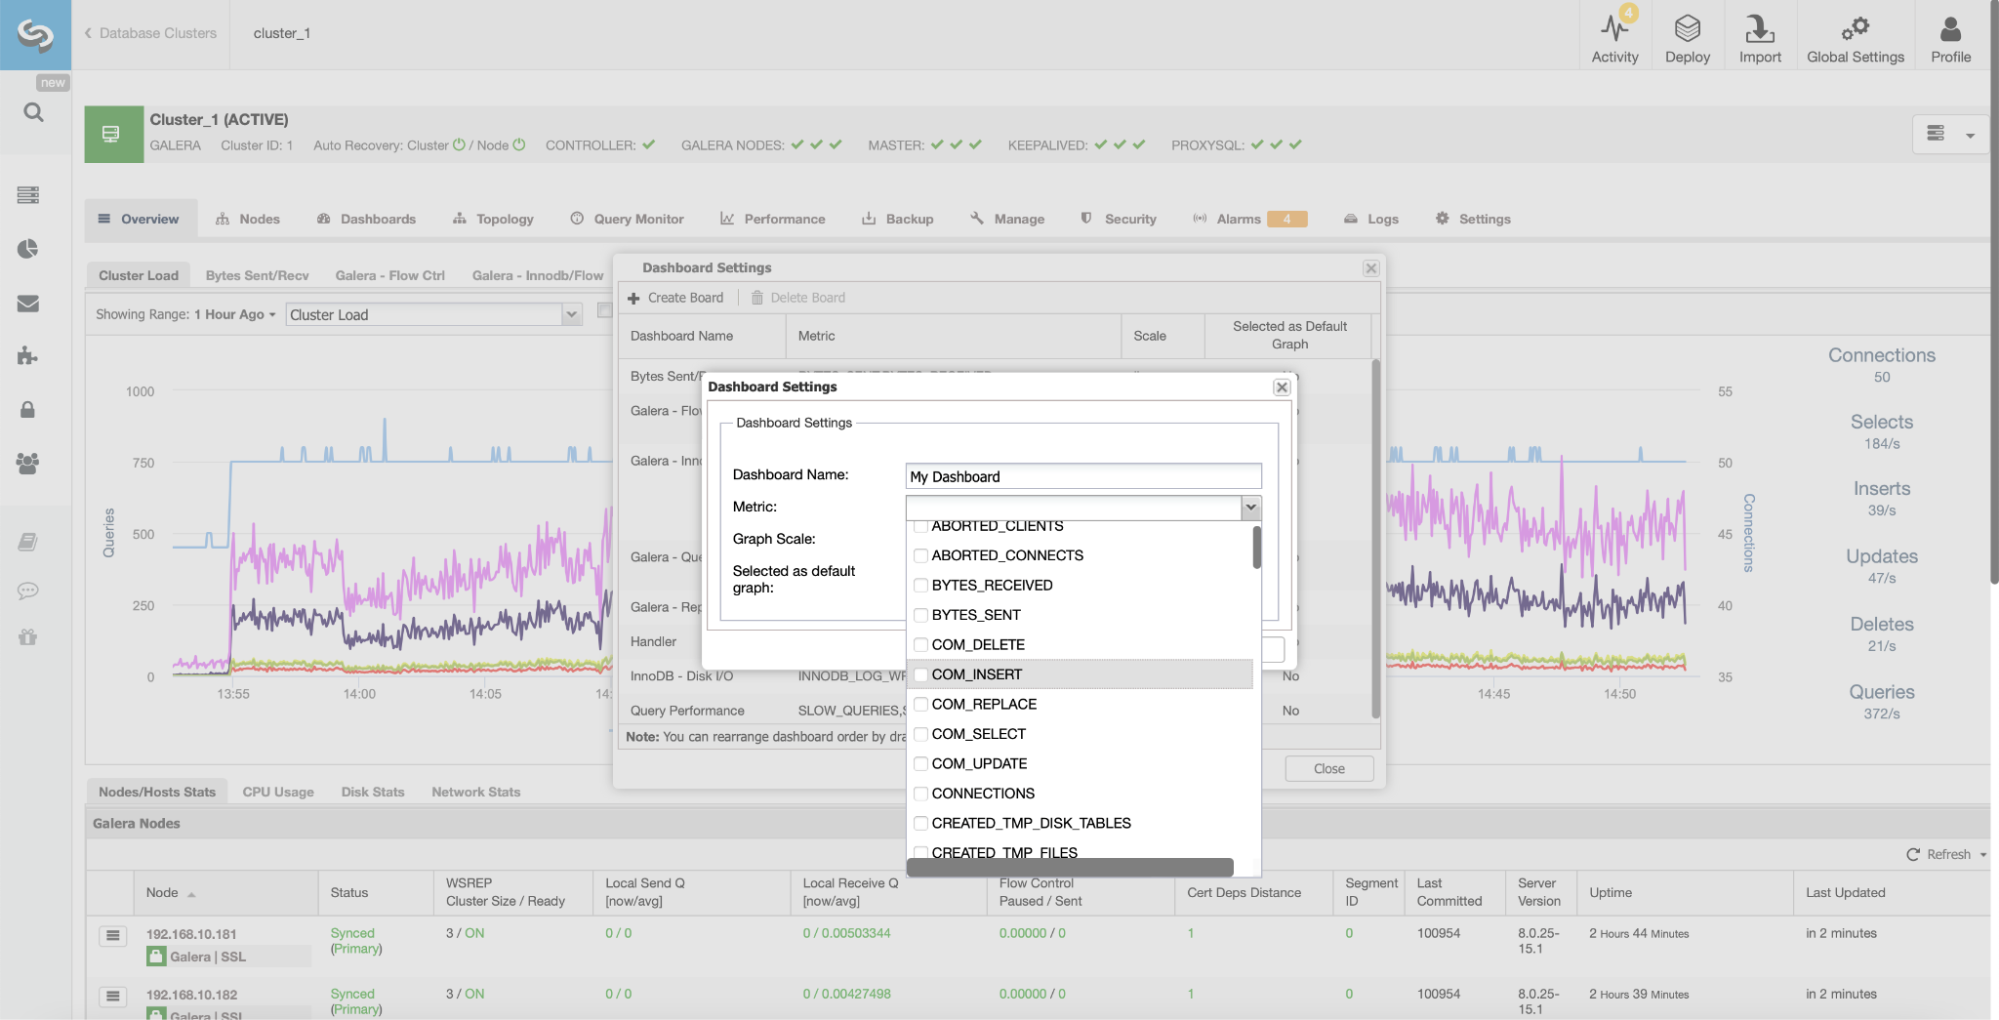
It provides easy access to multiple pre-defined dashboards which show the most important information for the given type of cluster. ClusterControl supports different open source datastores, and various graphs are displayed based on the vendor. ClusterControl also provides an option to create your own custom dashboards:
ClusterControl aggregates graphs across all cluster nodes. This key feature makes it easier to track the state of the whole cluster. If you want to check graphs from each node, you can easily do that as shown below:
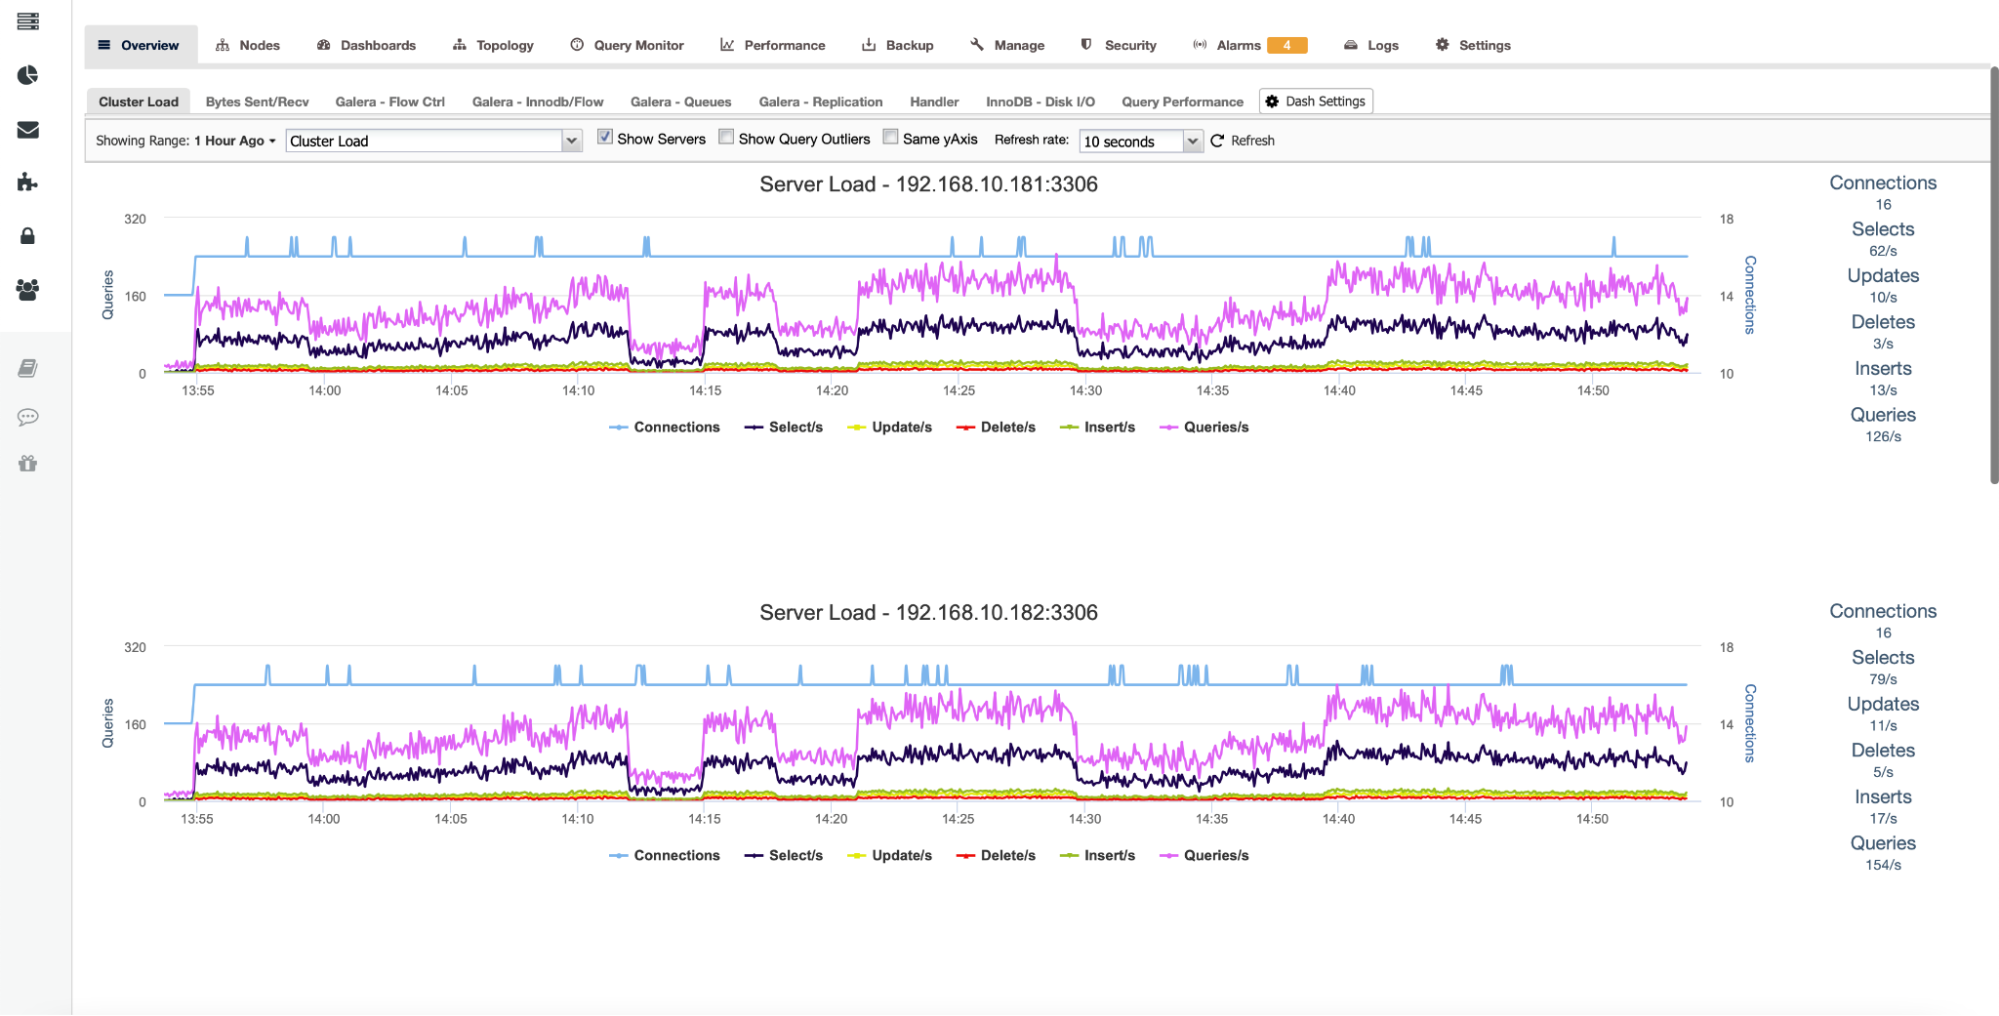
By ticking “Show Servers,” all nodes in the cluster will be shown separately, allowing you to drill down into each one.
Nodes Tab
If you would like to check a particular node in more detail, you can do so from the Nodes tab.
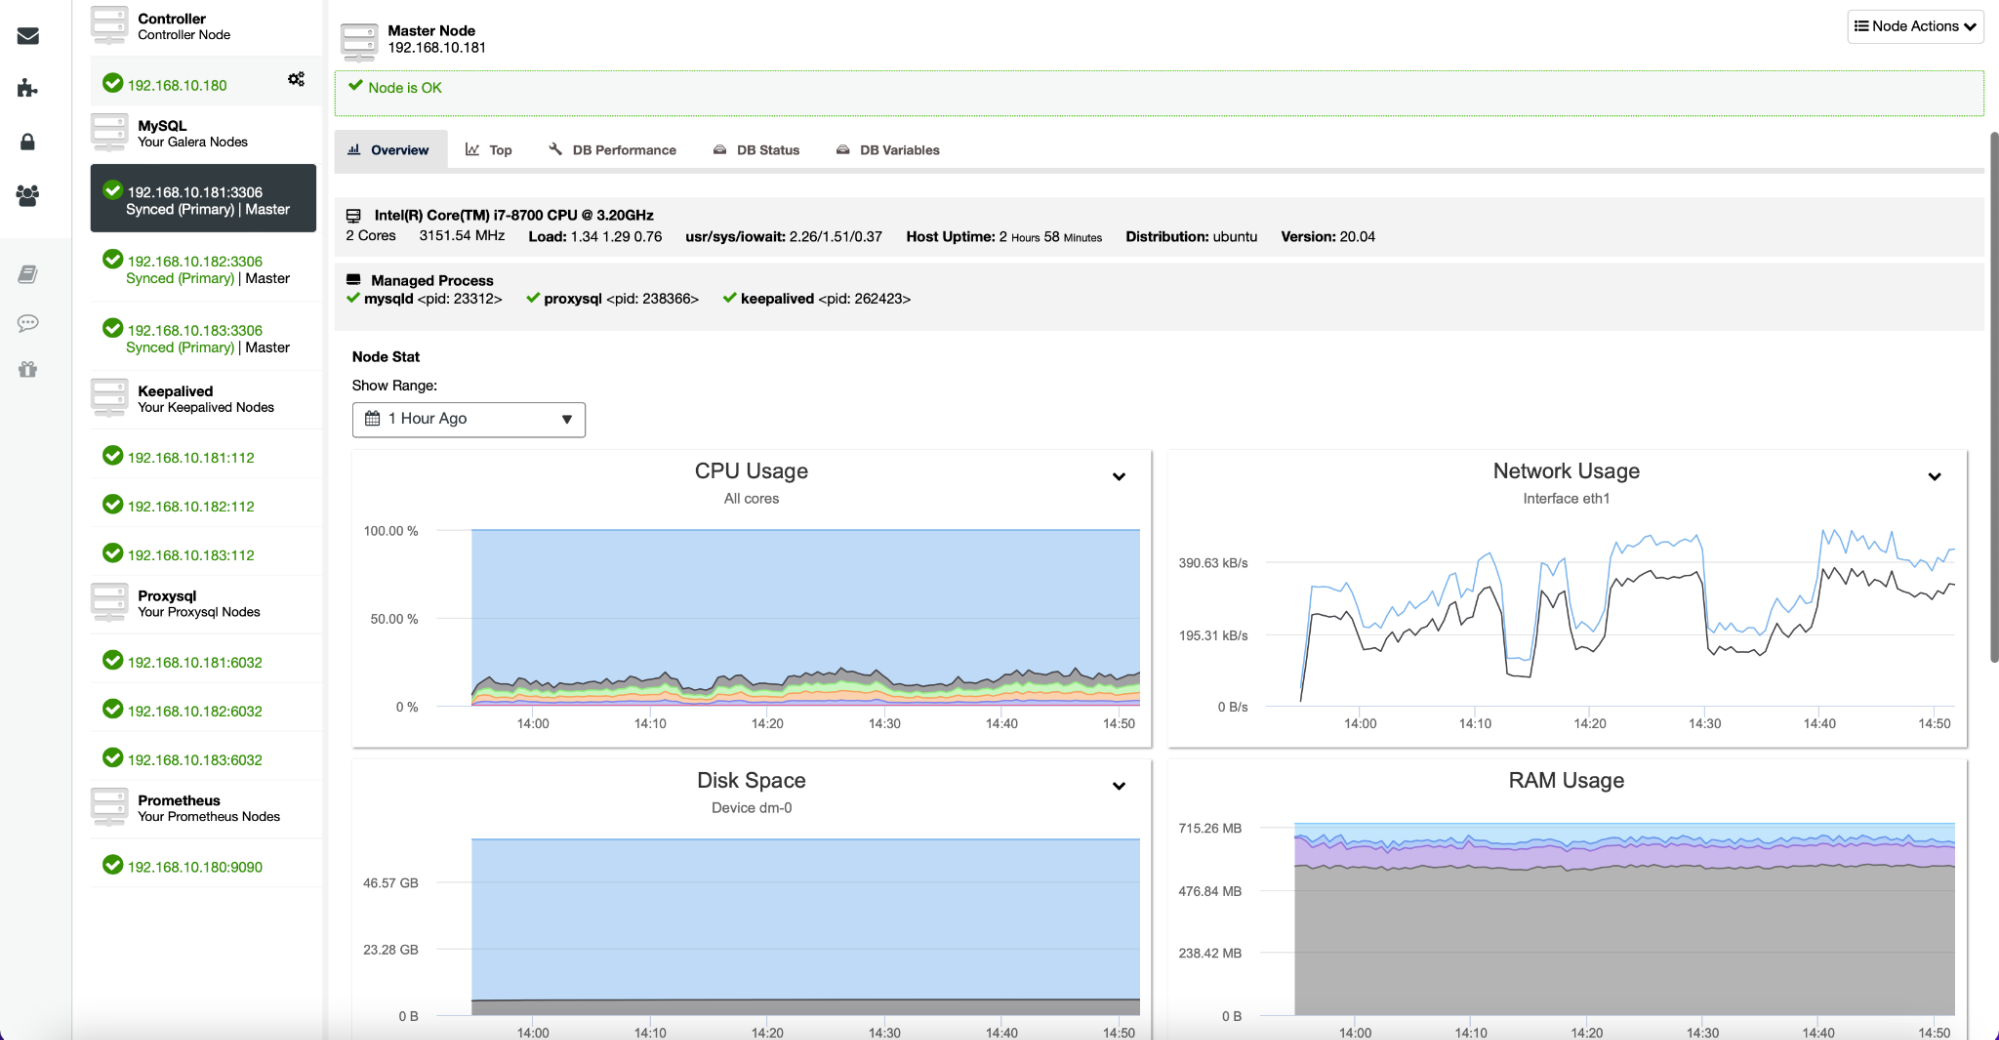
Here you can find metrics related to a given host – CPU, disk, network, and memory – all the important bits of data that define how a given server behaves and how loaded it is.
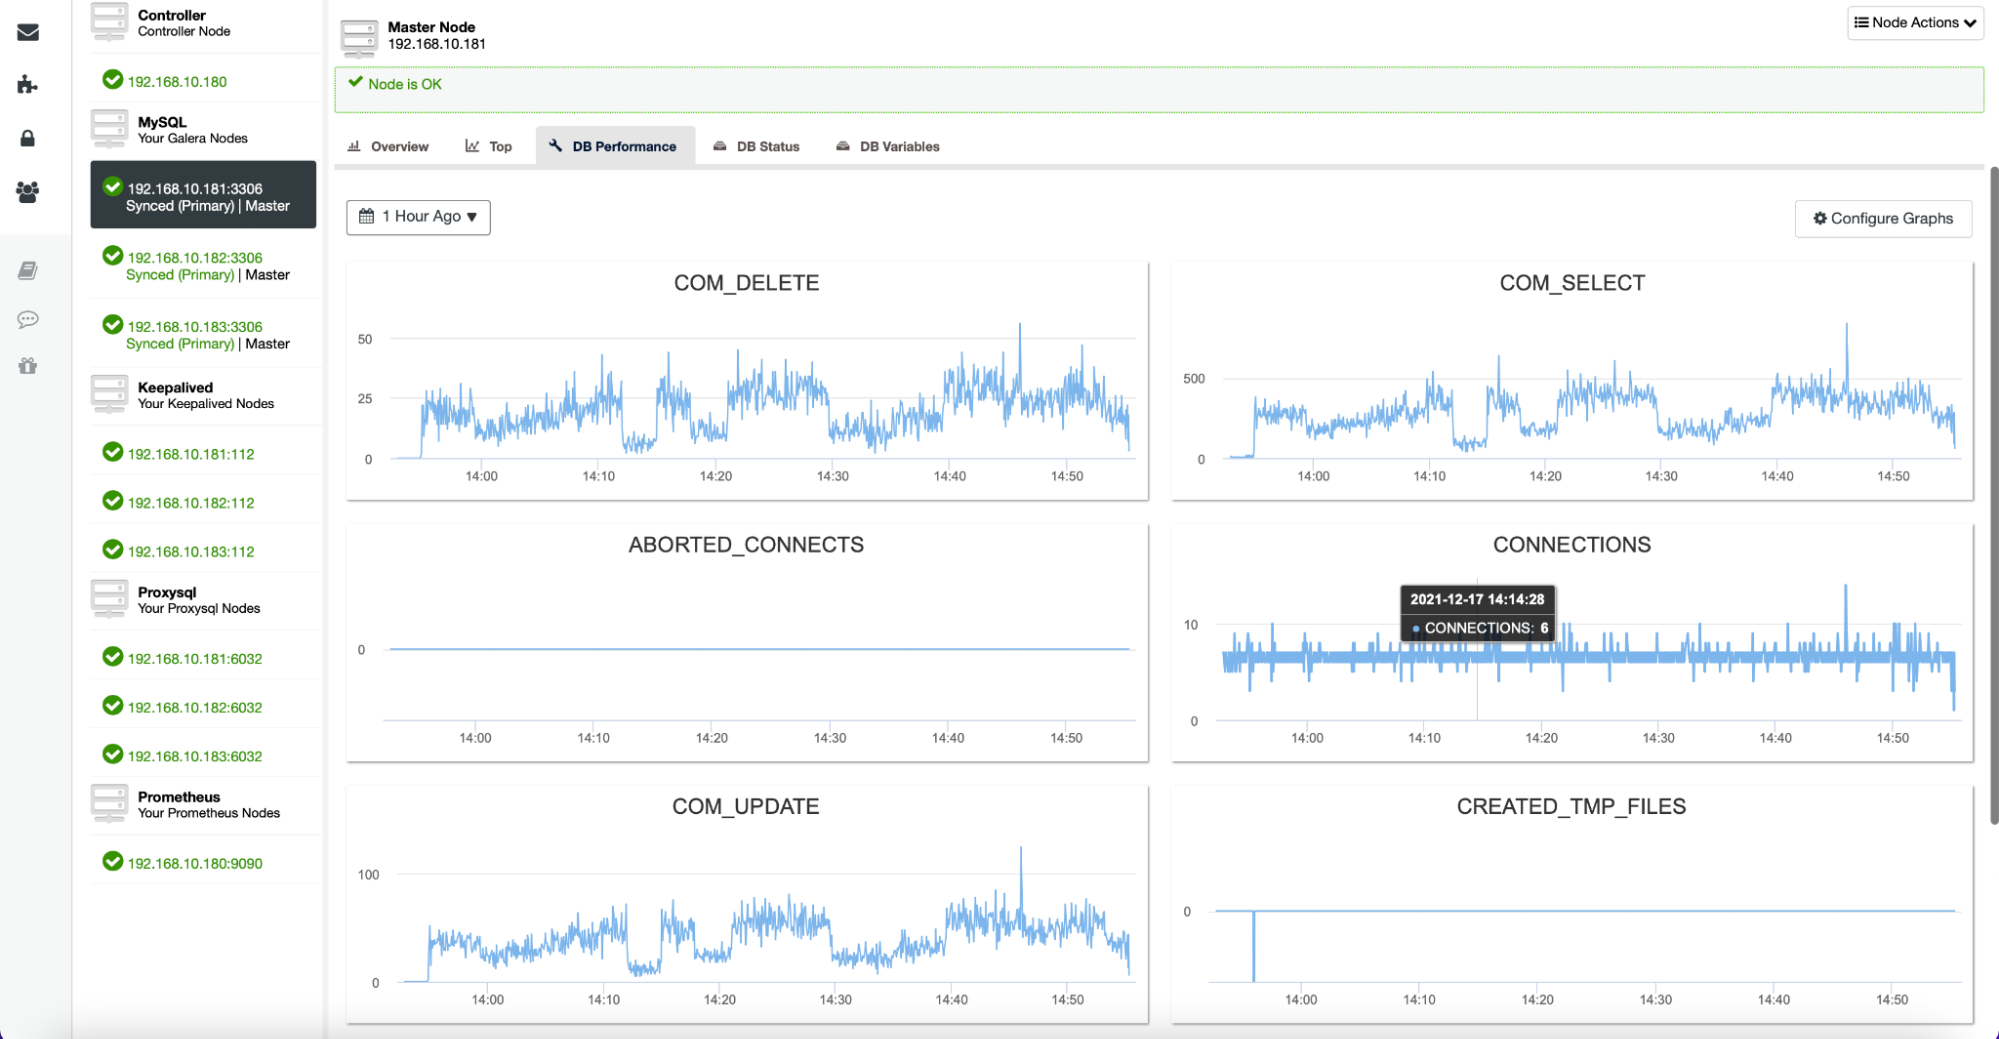
The Nodes tab also gives you an option to check the database metrics for a given node, as shown below:
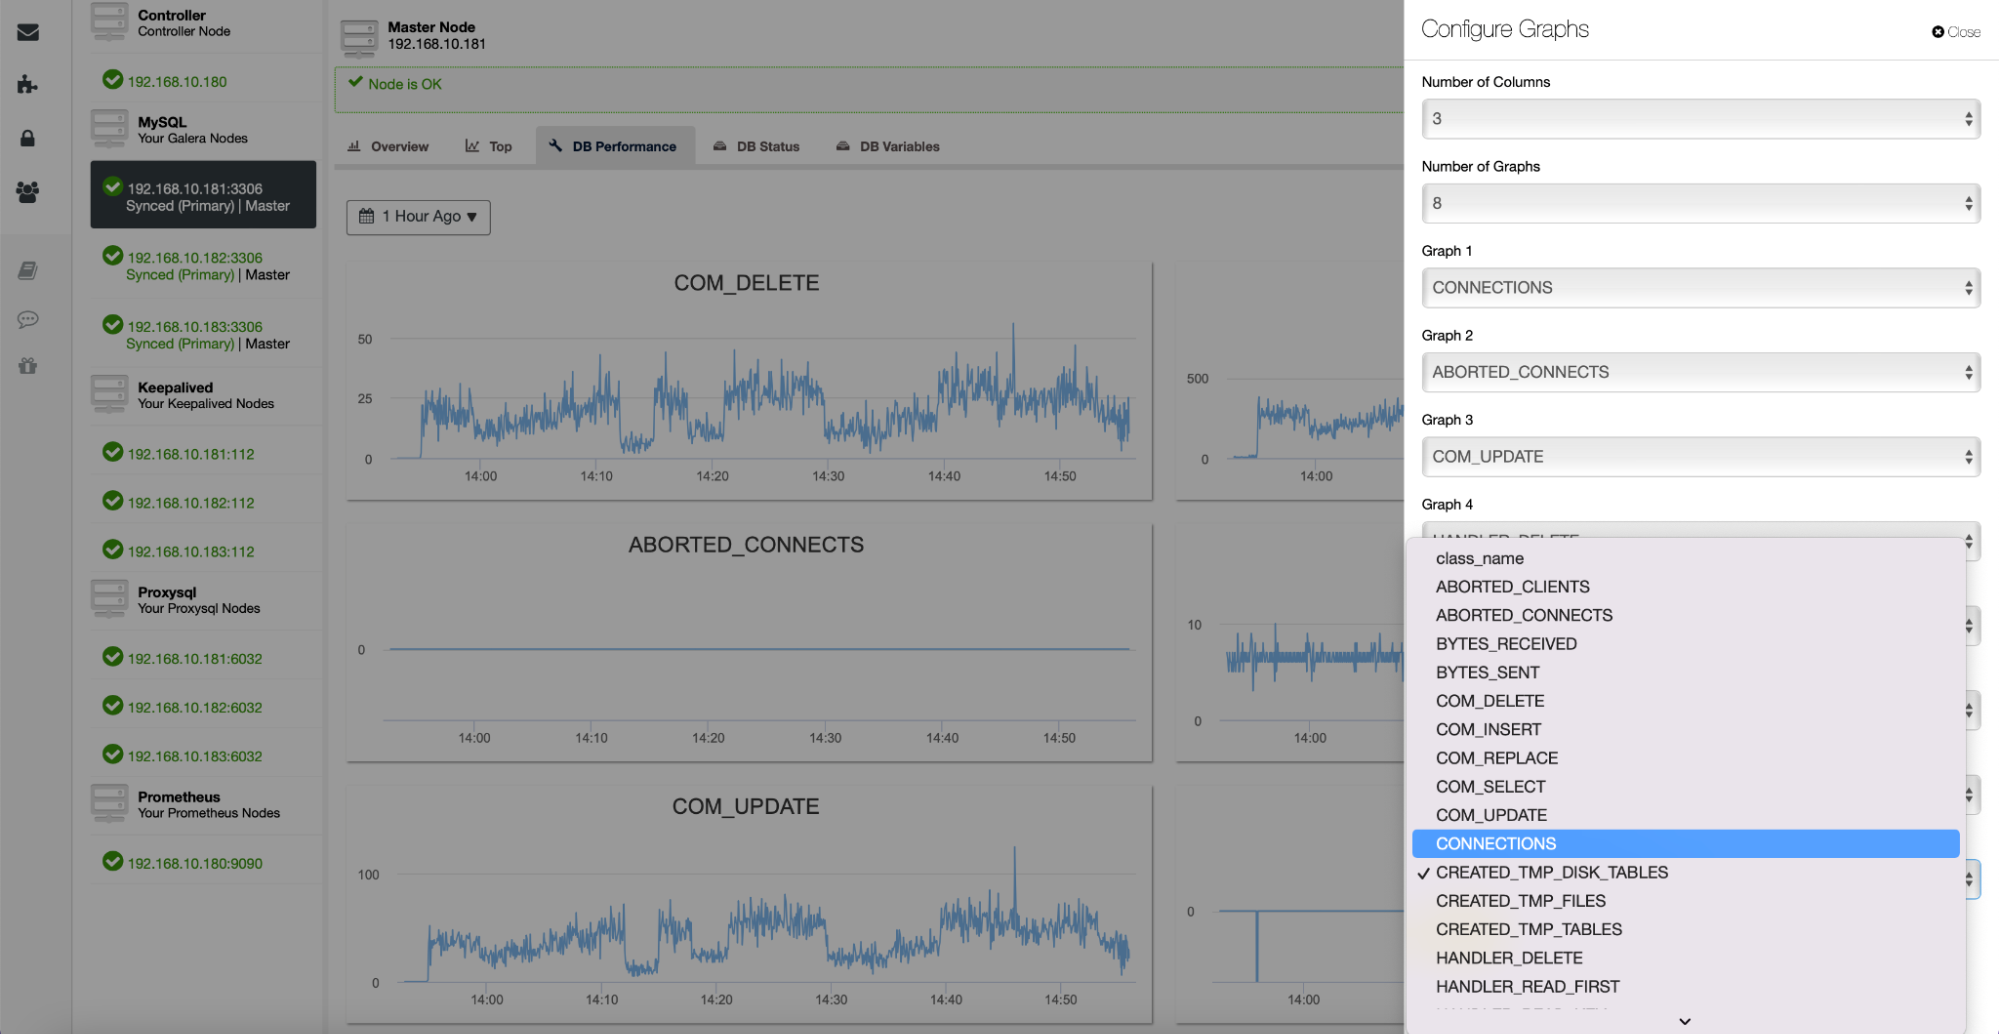
All of these graphs are customizable, and you can easily add more as desired:
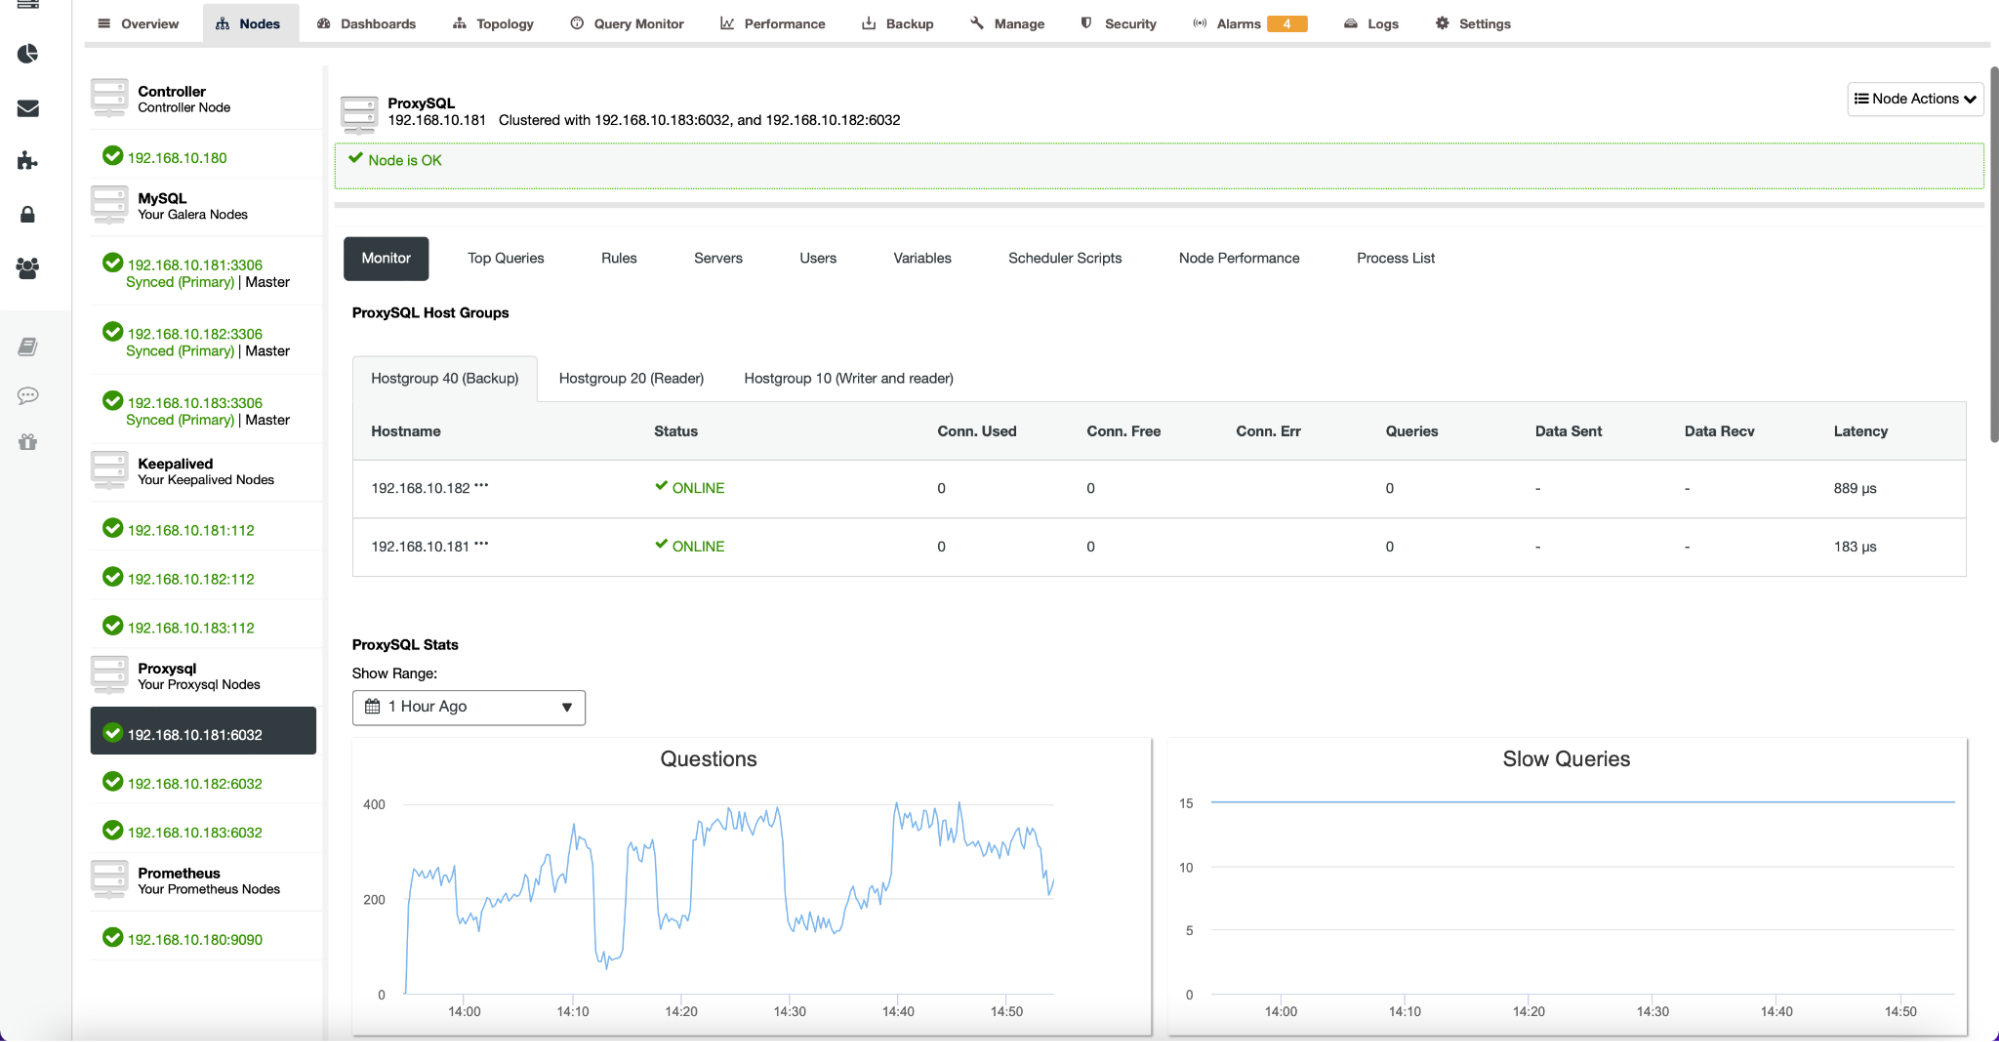
The Nodes tab also contains metrics related to nodes other than databases. For example, for ProxySQL, ClusterControl provides an extensive list of graphs to track the state of the most important metrics.
Dashboards
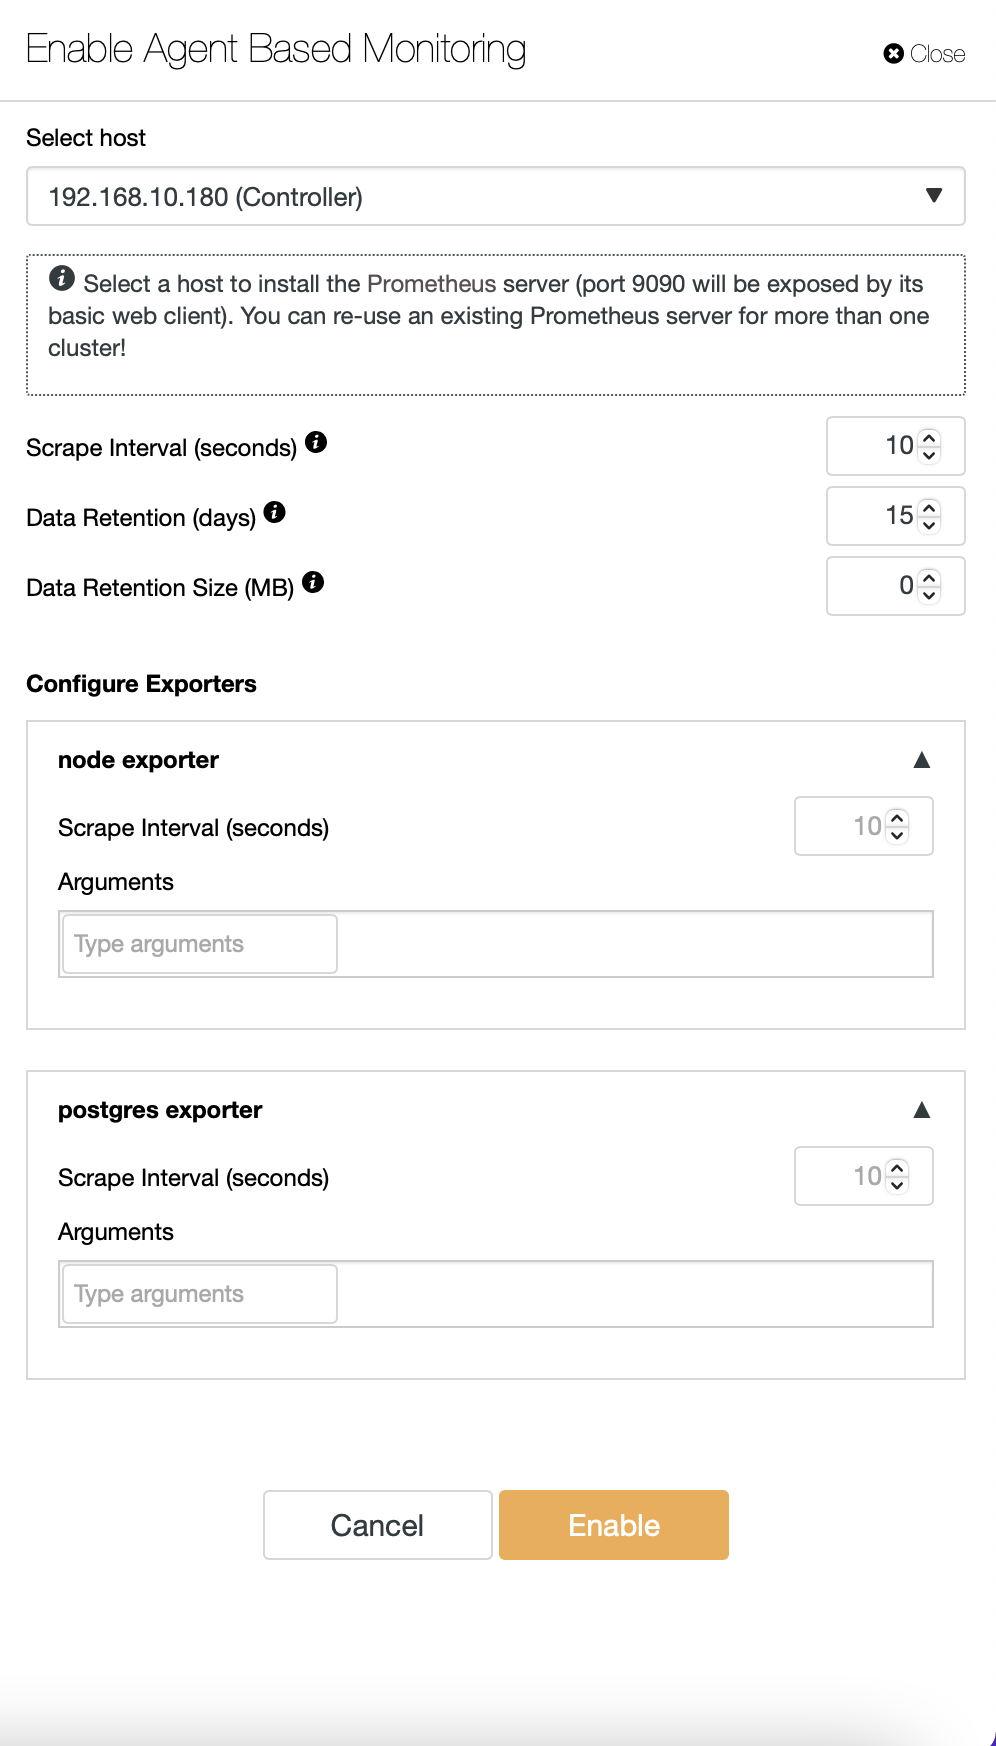
By default, ClusterControl uses an agentless approach to monitoring, and all data is collected directly from ClusterControl using either SSH or native connection to the database. It is possible, though, to enable an agent-based approach. You can do so with just one click.
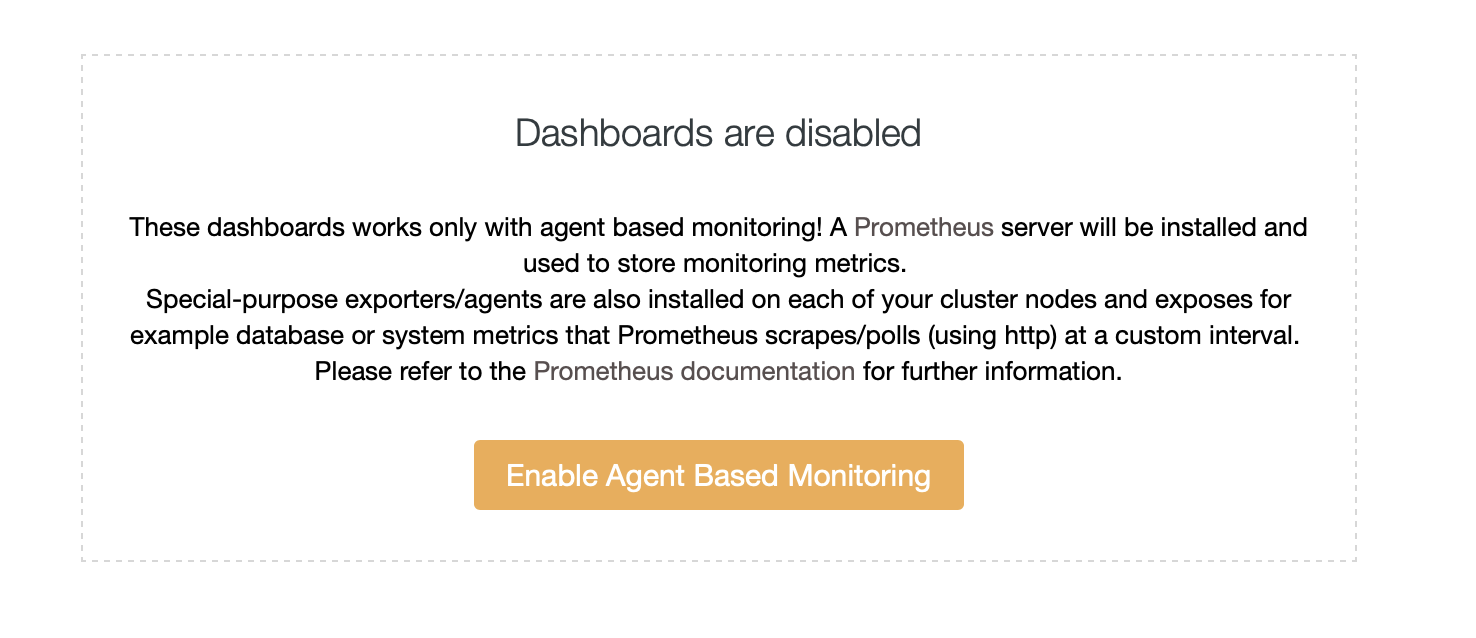
Once you enable agent-based monitoring, a job will start that will configure a Prometheus time-series database that will store the data, and different agents, which will collect the data and push it to Prometheus.
Once this is ready, a set of dashboards will be created according to the types of nodes available in the cluster.
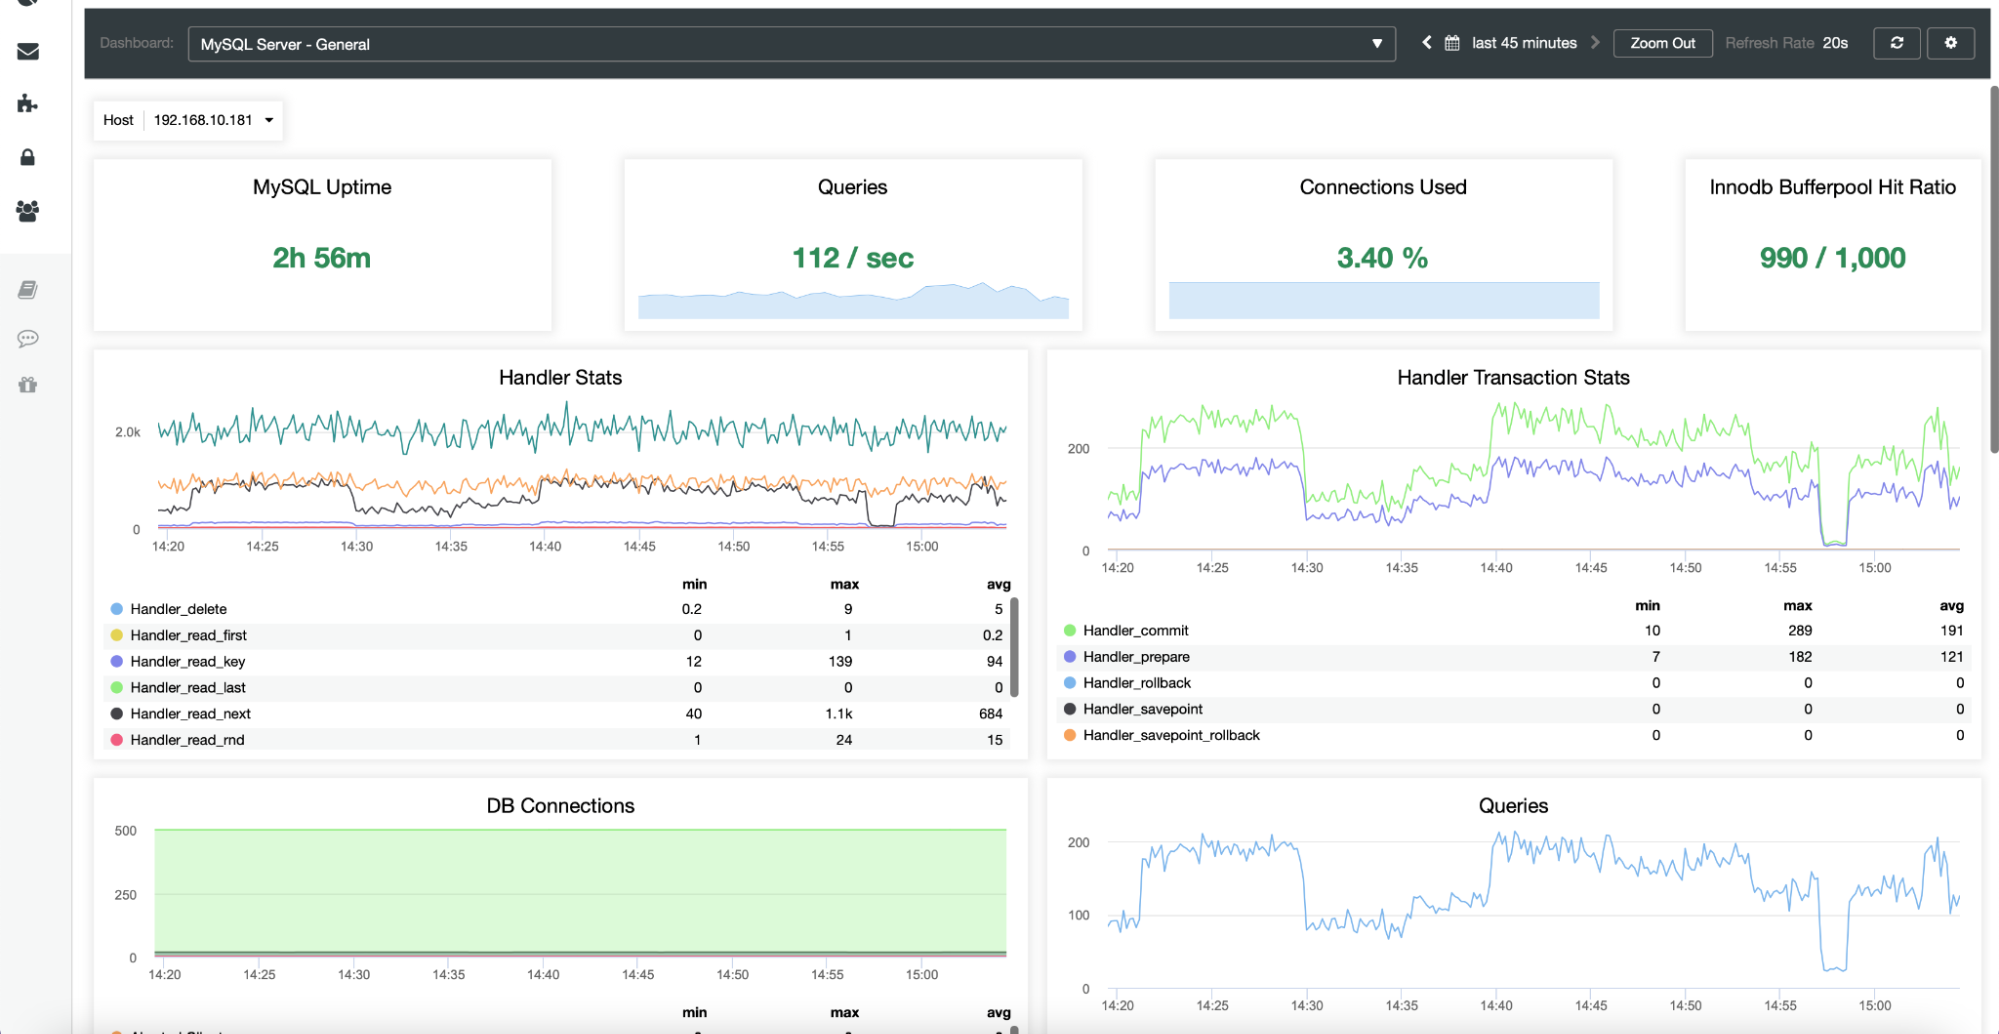
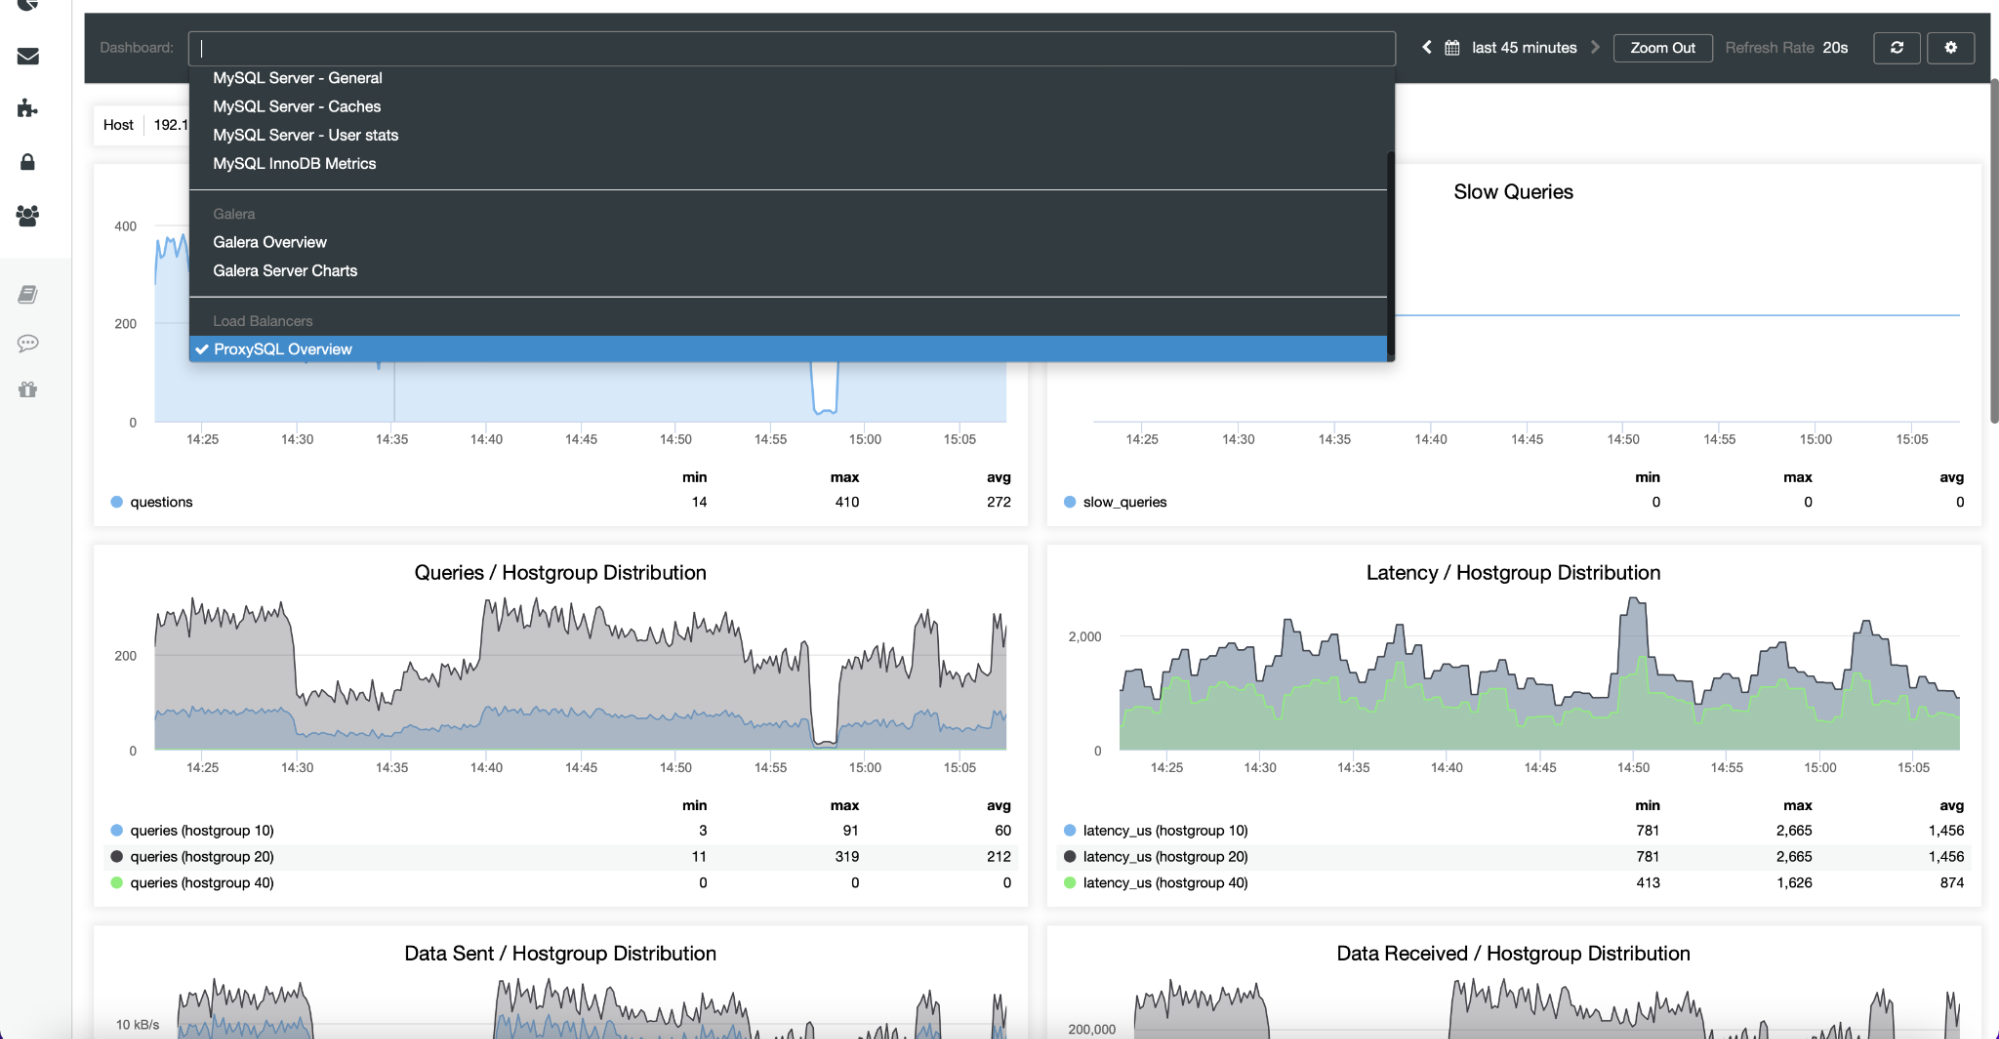
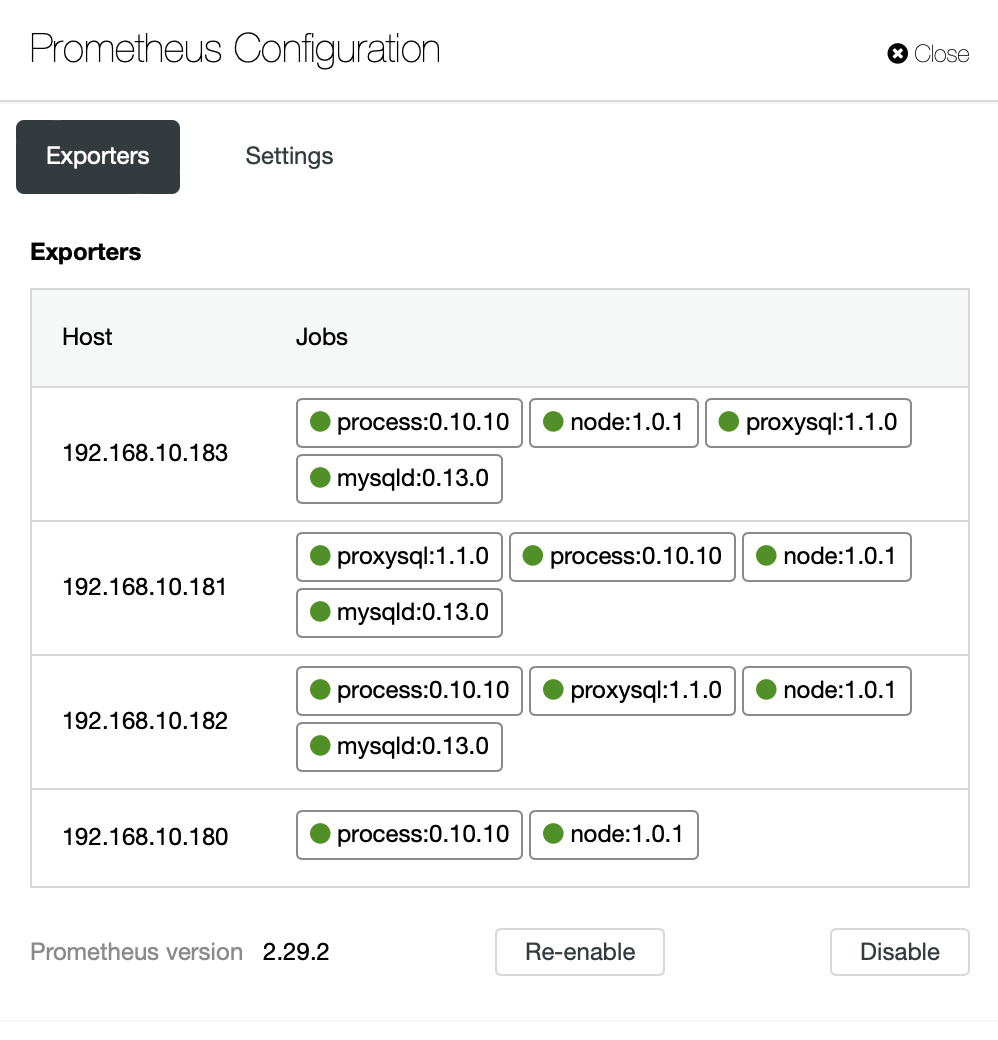
Dashboards also include load balancers that have been deployed in the cluster. If needed, it is possible to re-enable the agent-based monitoring, which includes reinstalling and reconfiguring the exporters:
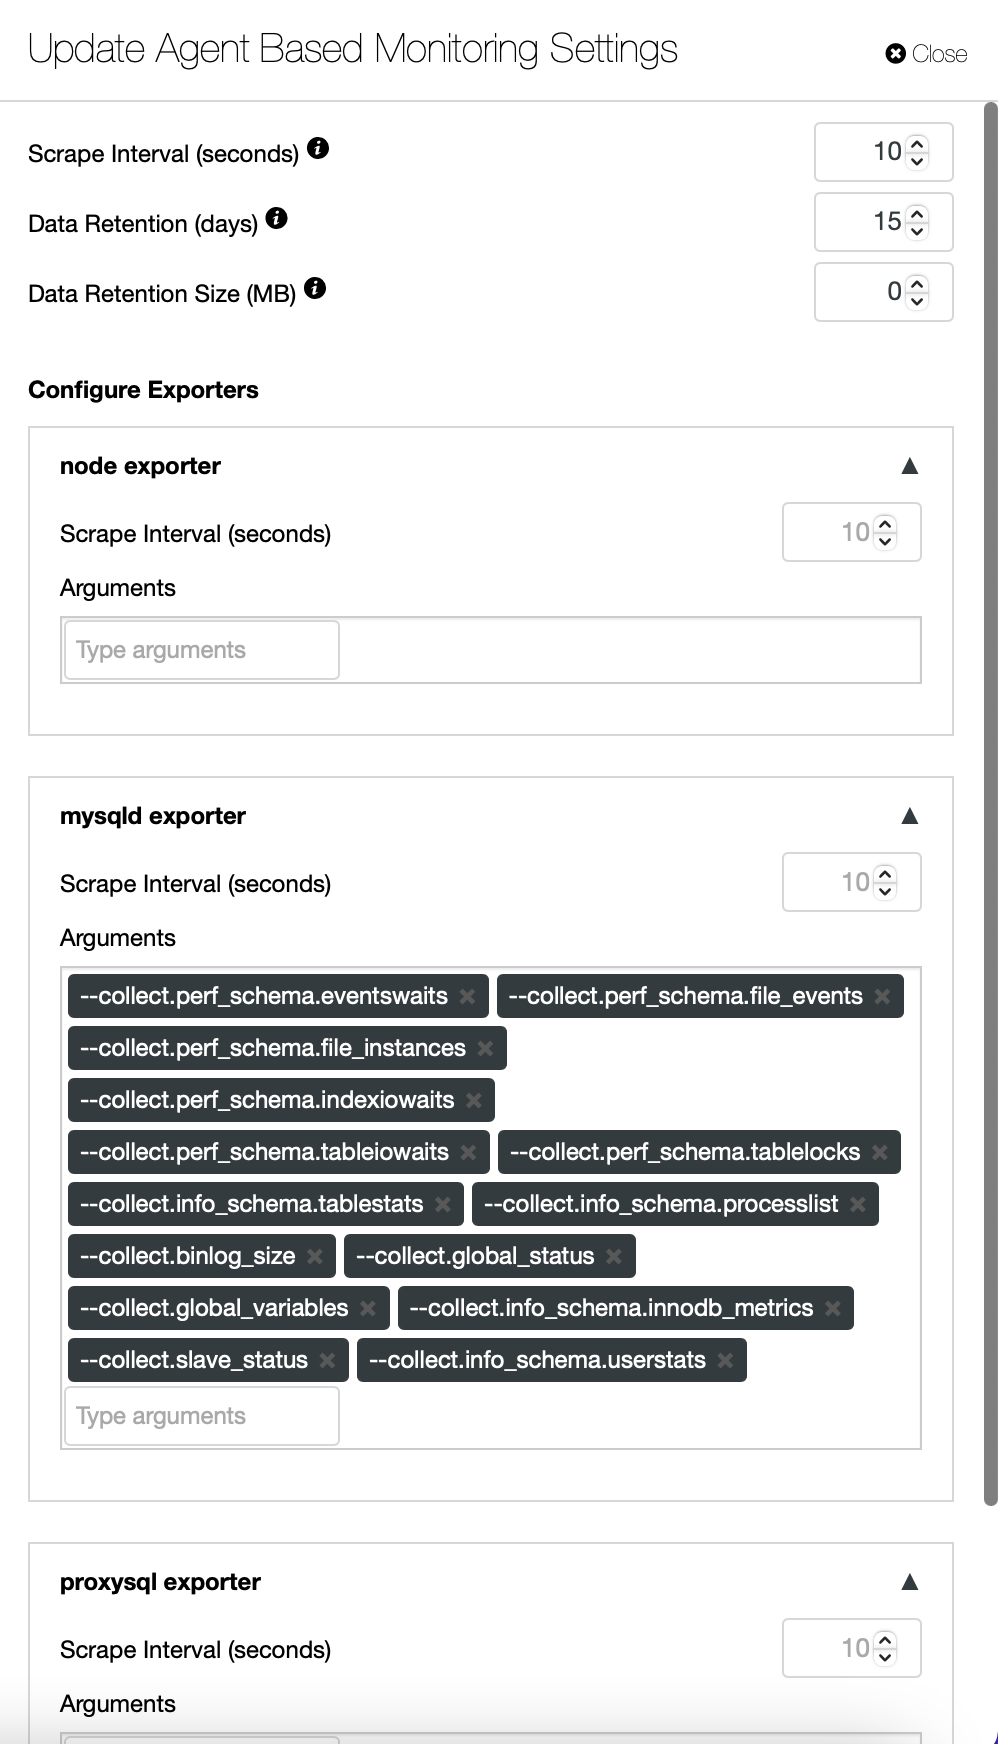
If you want, you can also change the configuration of the agents and Prometheus:
Advisors
Trending data is not enough on its own. Sure, it’s great for post mortem analysis or when working on capacity planning; historical data stored in the form of graphs can be of great use. But to have a full view of the cluster, you’ll need alerts. If there’s an issue occurring right now, the user must be alerted.

ClusterControl provides a list of pre-defined advisors that track the state of different metrics and the state of your databases. When needed, ClusterControl creates an alert.
As you can see in the screenshot above, it is not only about metrics. ClusterControl also runs sanity checks for important settings and provides some predictions. For example, regarding disk space utilization, ClusterControl attempts to alert the user in case disk utilization increases too fast. Of course, alerts are sent not only through advisors. Events like “node down” or “failed backup” will also result in a notification.
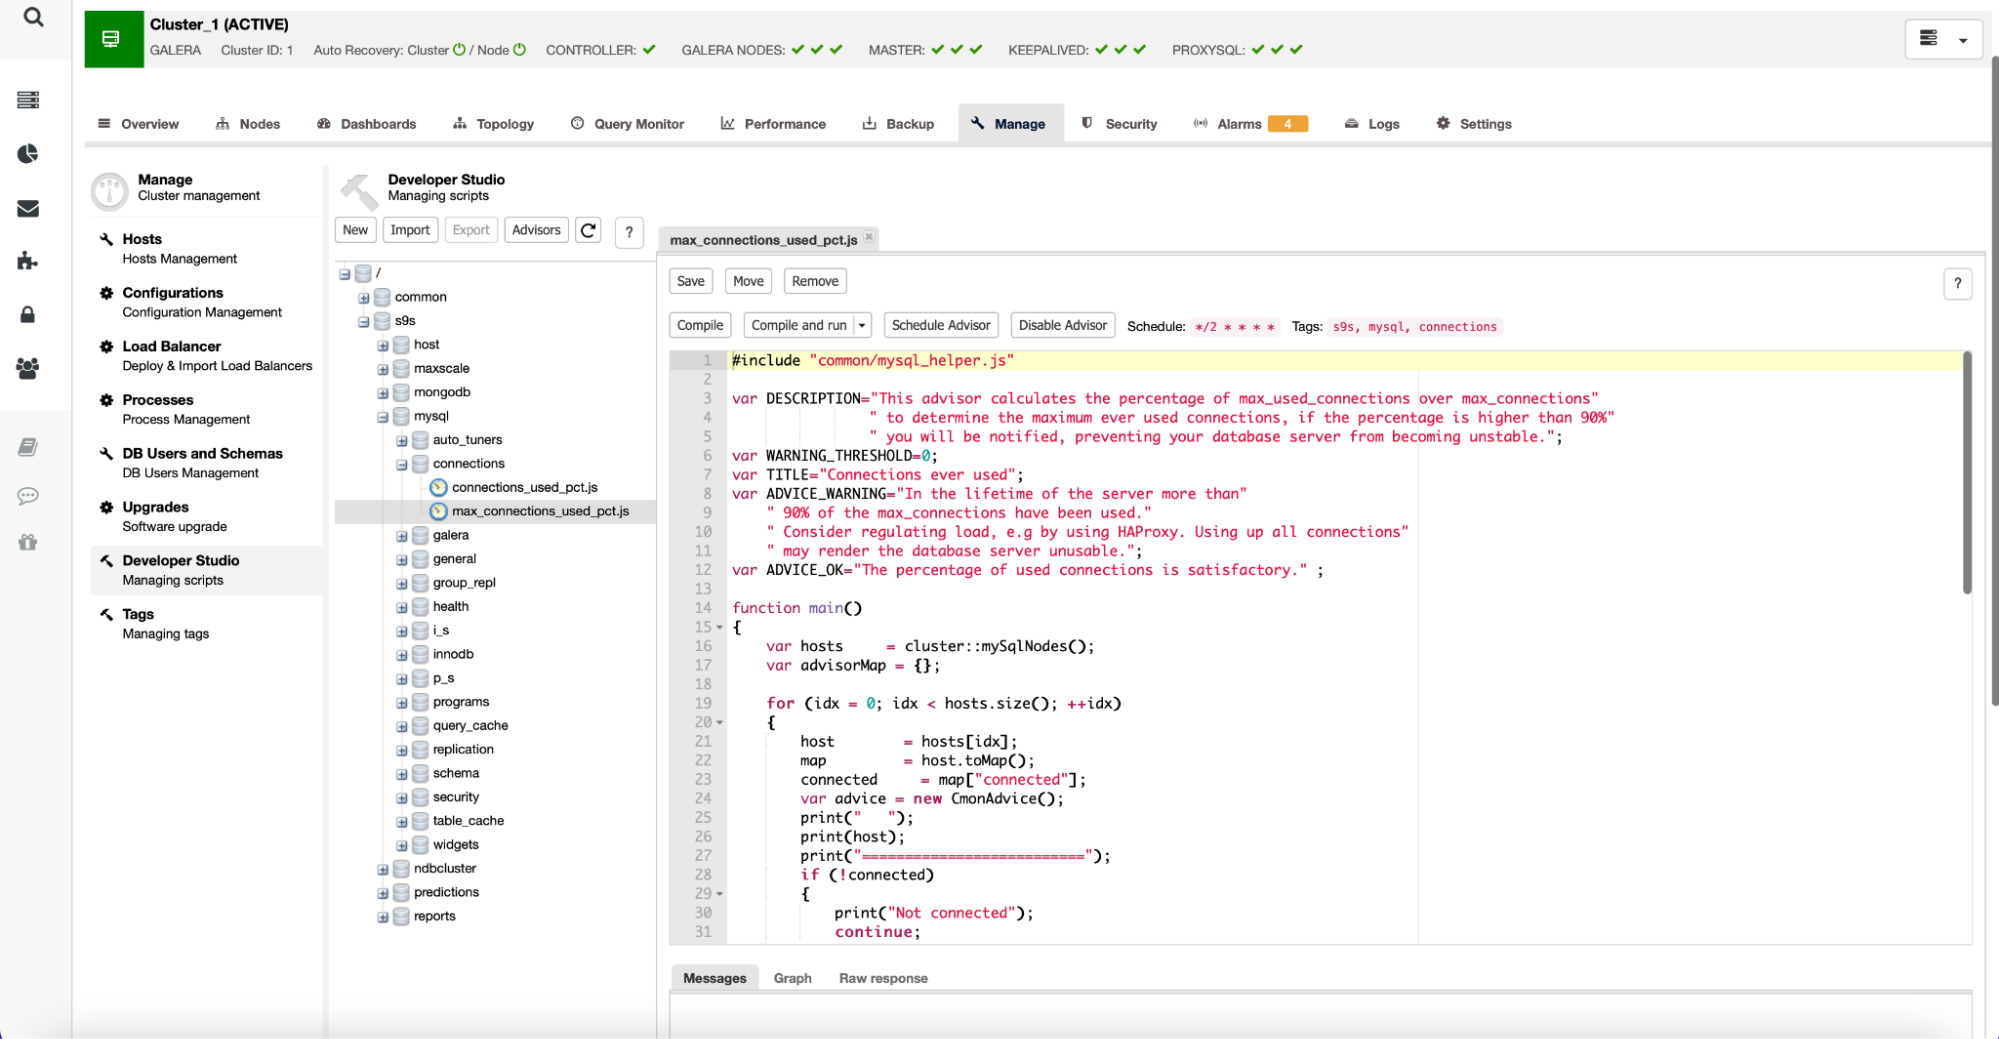
It is worth noting that advisors are written in a JavaScript-like language and can be edited using the Developer Studio within ClusterControl as seen below:
Users can also create new advisors and schedule them to be executed by ClusterControl.
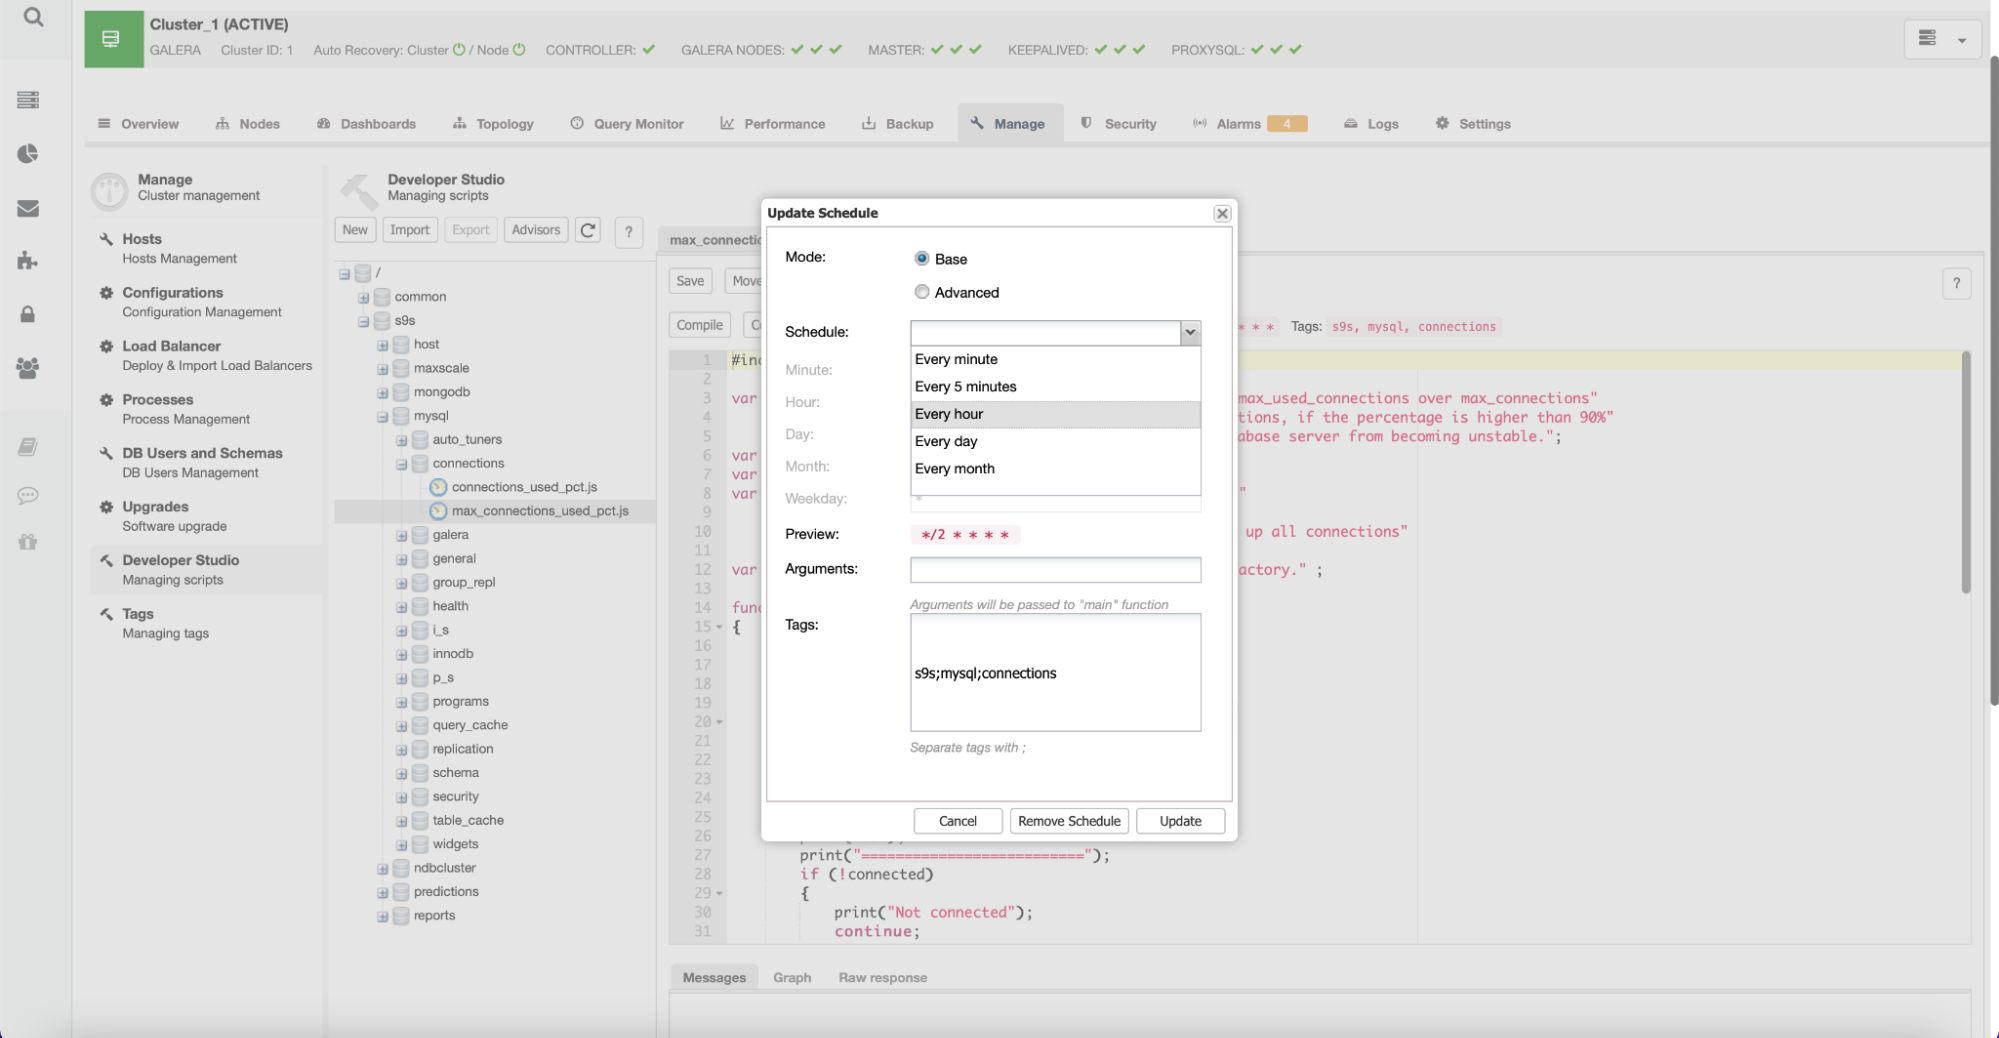
With this capability, users can develop their own scripts that check for important bits specific to the environment. Such scripts can also leverage other ClusterControl functionality, for example, if you’d like to implement automated scaling based on the growth of some metric.
Ready to Get Started with ClusterControl?
As you can see, ClusterControl’s ability to automate monitoring and alerting tasks while providing you with easy-to-understand and customizable dashboards makes it an essential tool for DevOps and system administrators. In fact, ClusterControl lets you quickly and easily automate all database operations from one single pane of glass. Want to see firsthand how ClusterControl can help you effectively monitor your databases? Download ClusterControl today to try free for 30-days.


