blog
Comparing the Features of Percona Monitoring & Management (PMM) to ClusterControl Database Monitoring

You may have heard about Percona Monitoring and Management (PMM), a solution from Percona that is focused on the monitoring of open source databases. It is a quite popular and free solution that provides access to the metrics that will give you a good insight on what is happening in the database.
ClusterControl, on the other hand, is a platform that is intended to both monitor and manage open source databases. You may be curious how those two solutions compare. This blog should give you some insight into what that looks like. Let’s focus on the monitoring first, and then we’ll talk about management.
Monitoring the Databases Using ClusterControl and PMM
Database Monitoring with ClusterControl
ClusterControl, by default, comes with basic monitoring capabilities where data is being collected over SSH and native database connections. There are several predefined dashboards that are intended to cover the most important aspects of the day-to-day operations.
There is also an option to deploy agent-based monitoring.
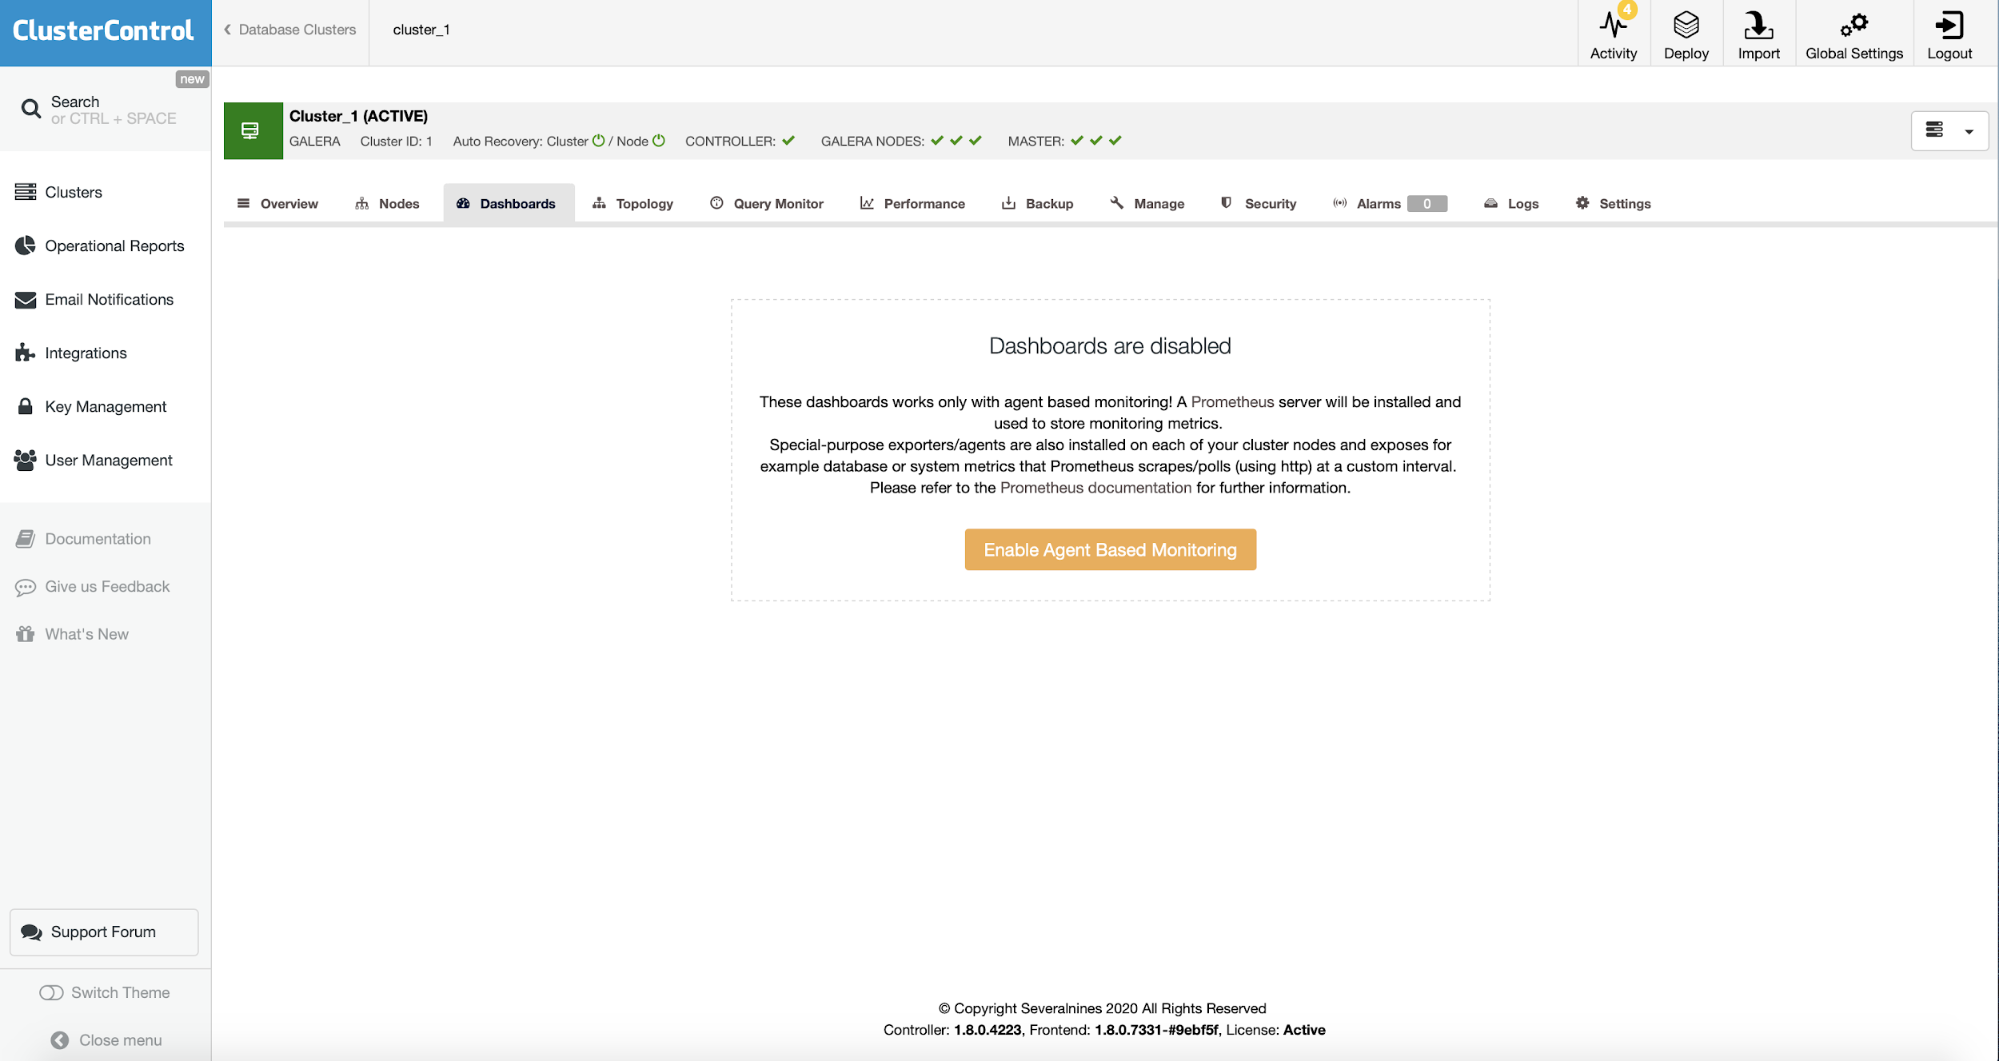
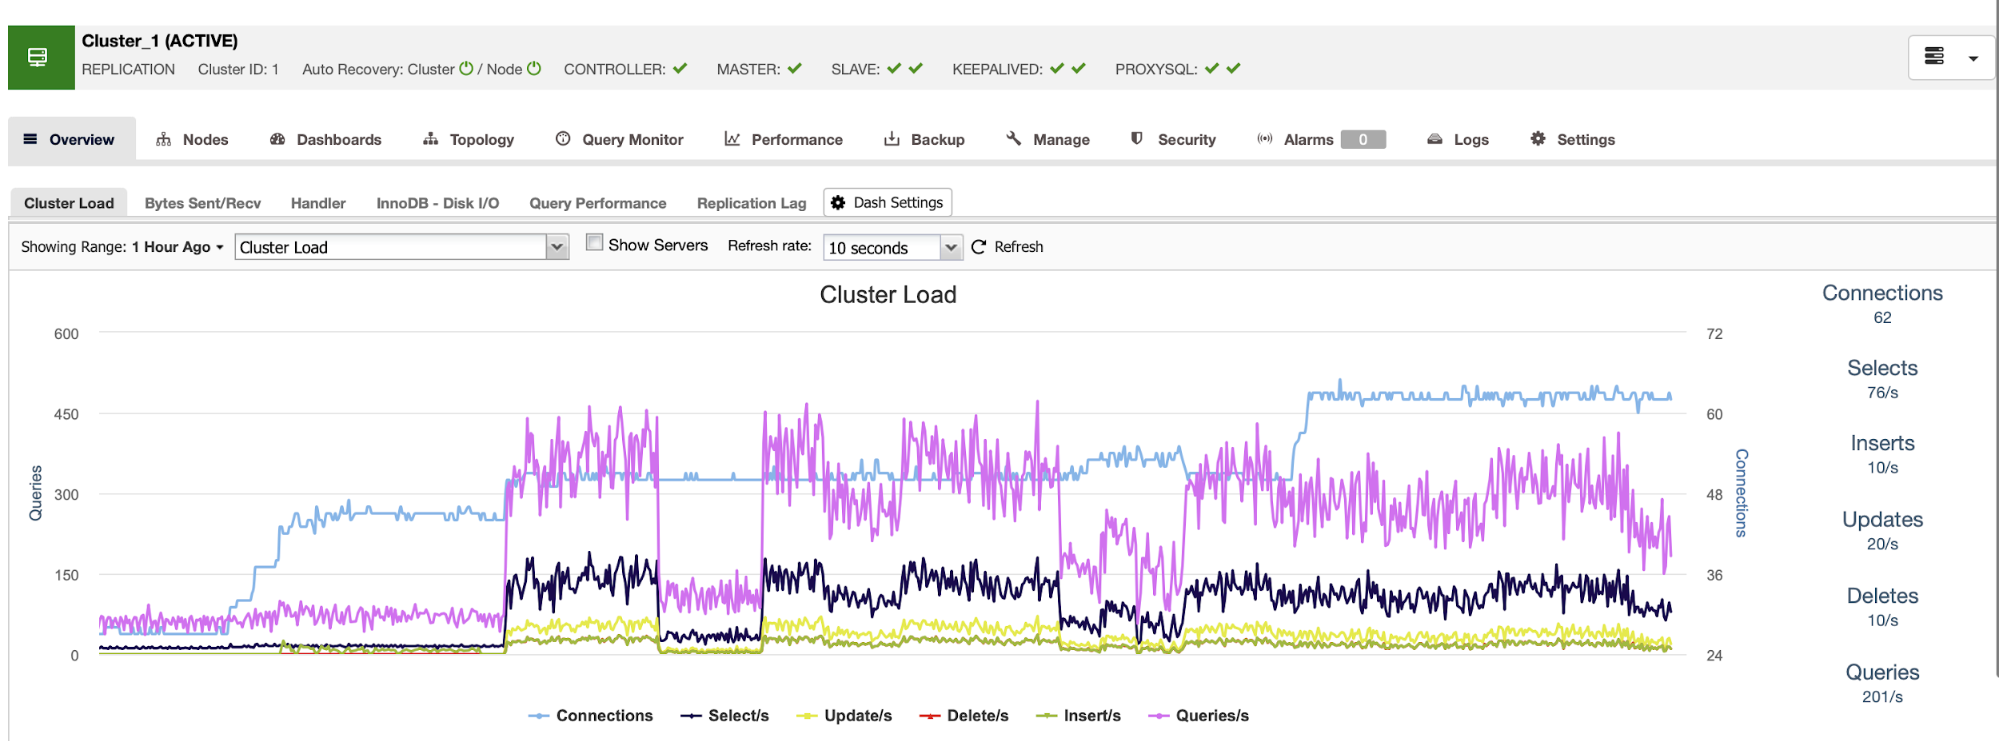
In the process ClusterControl will deploy a Prometheus which will be used to store metrics and it will be queried by ClusterControl to retrieve data and populate the graphs. On the backend databases ClusterControl will deploy exporters – agents that are intended to collect metrics from the database, operating system as well as with some of the supported load balancers. The data is pushed by exporters into Prometheus. The final outcome is a set of predefined dashboards that cover the most important aspects of the database operations:
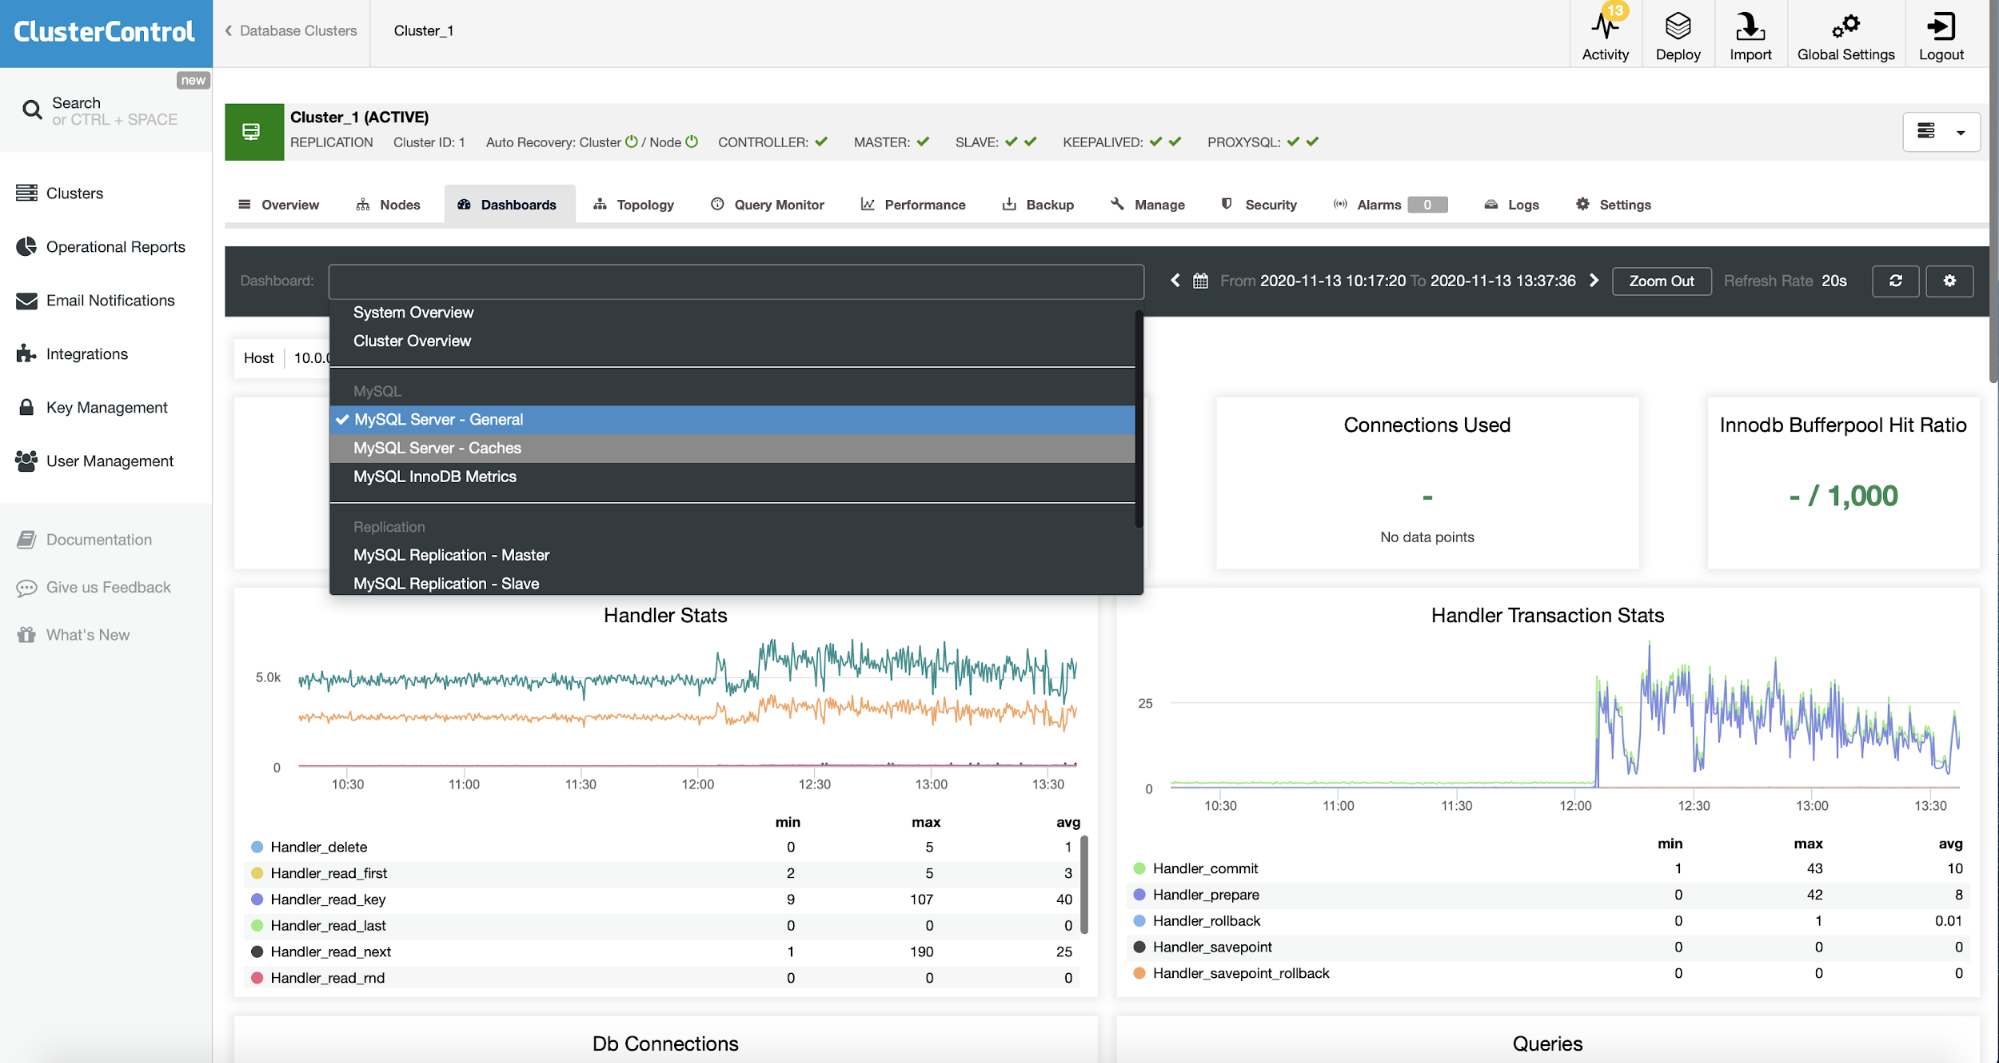
The main advantage of ClusterControl is that it comes with predefined dashboards that are intended to show the most important bits of the metrics while still being able to graph every single metric that is collected:
This is quite important as people without in-depth knowledge of the given database technology may not be able to figure out on their own what data is the most important for them and what is that they should be looking at. On the other hand, power users can still access all the bits of the information collected from the database.
Database Monitoring with PMM
PMM is a standalone product that can be deployed in many ways, the most common being probably the Docker image that Percona made available. PMM is designed as an agent-based solution. The server, where the data is stored, has multiple services running, among others Prometheus to store time-series and Graphana, which provides an UI to access the data.
The data itself, by default, is accessible through numerous dashboards that cover pretty much every aspect of the database metrics.
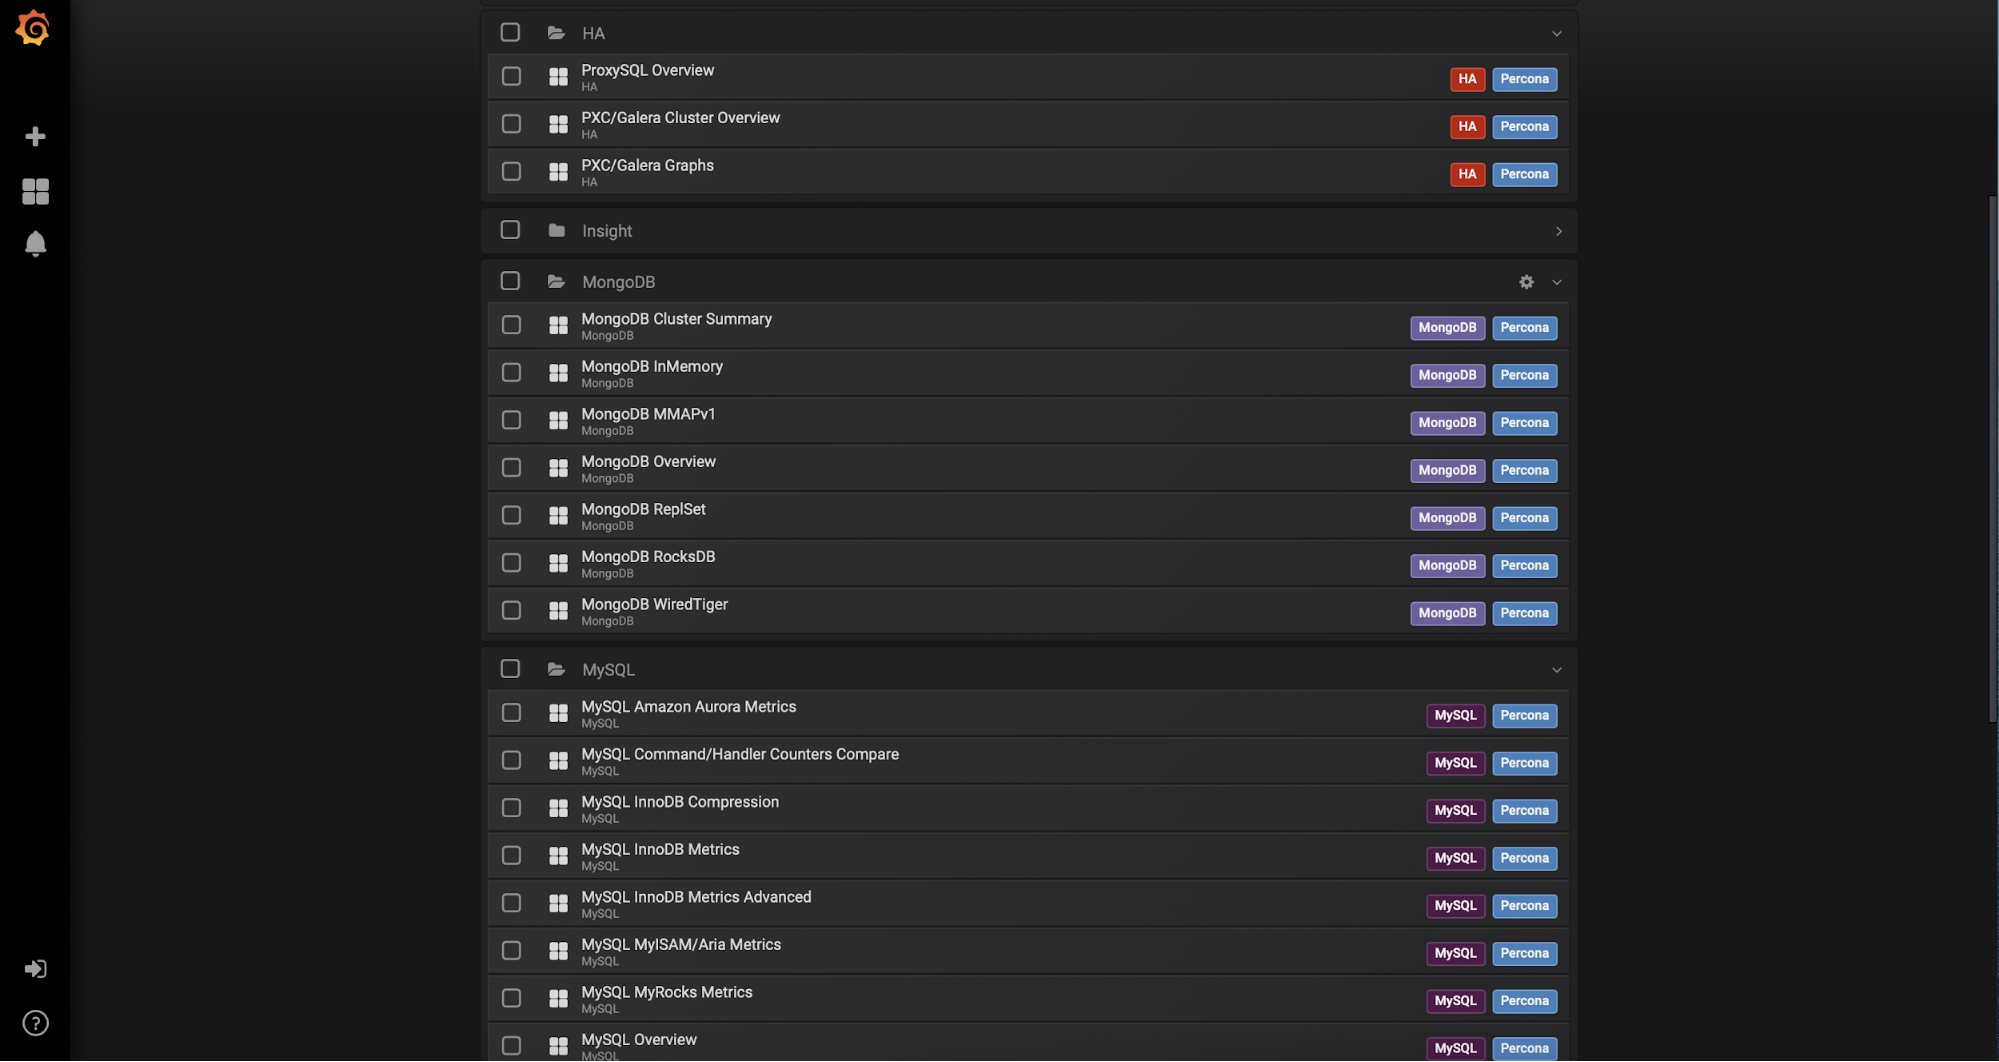
This makes it possible to access all of the data quite easily but for the casual user it might be tricky to understand what is the most important piece of data between all of the metrics and dashboards made available by Percona Monitoring and Management.
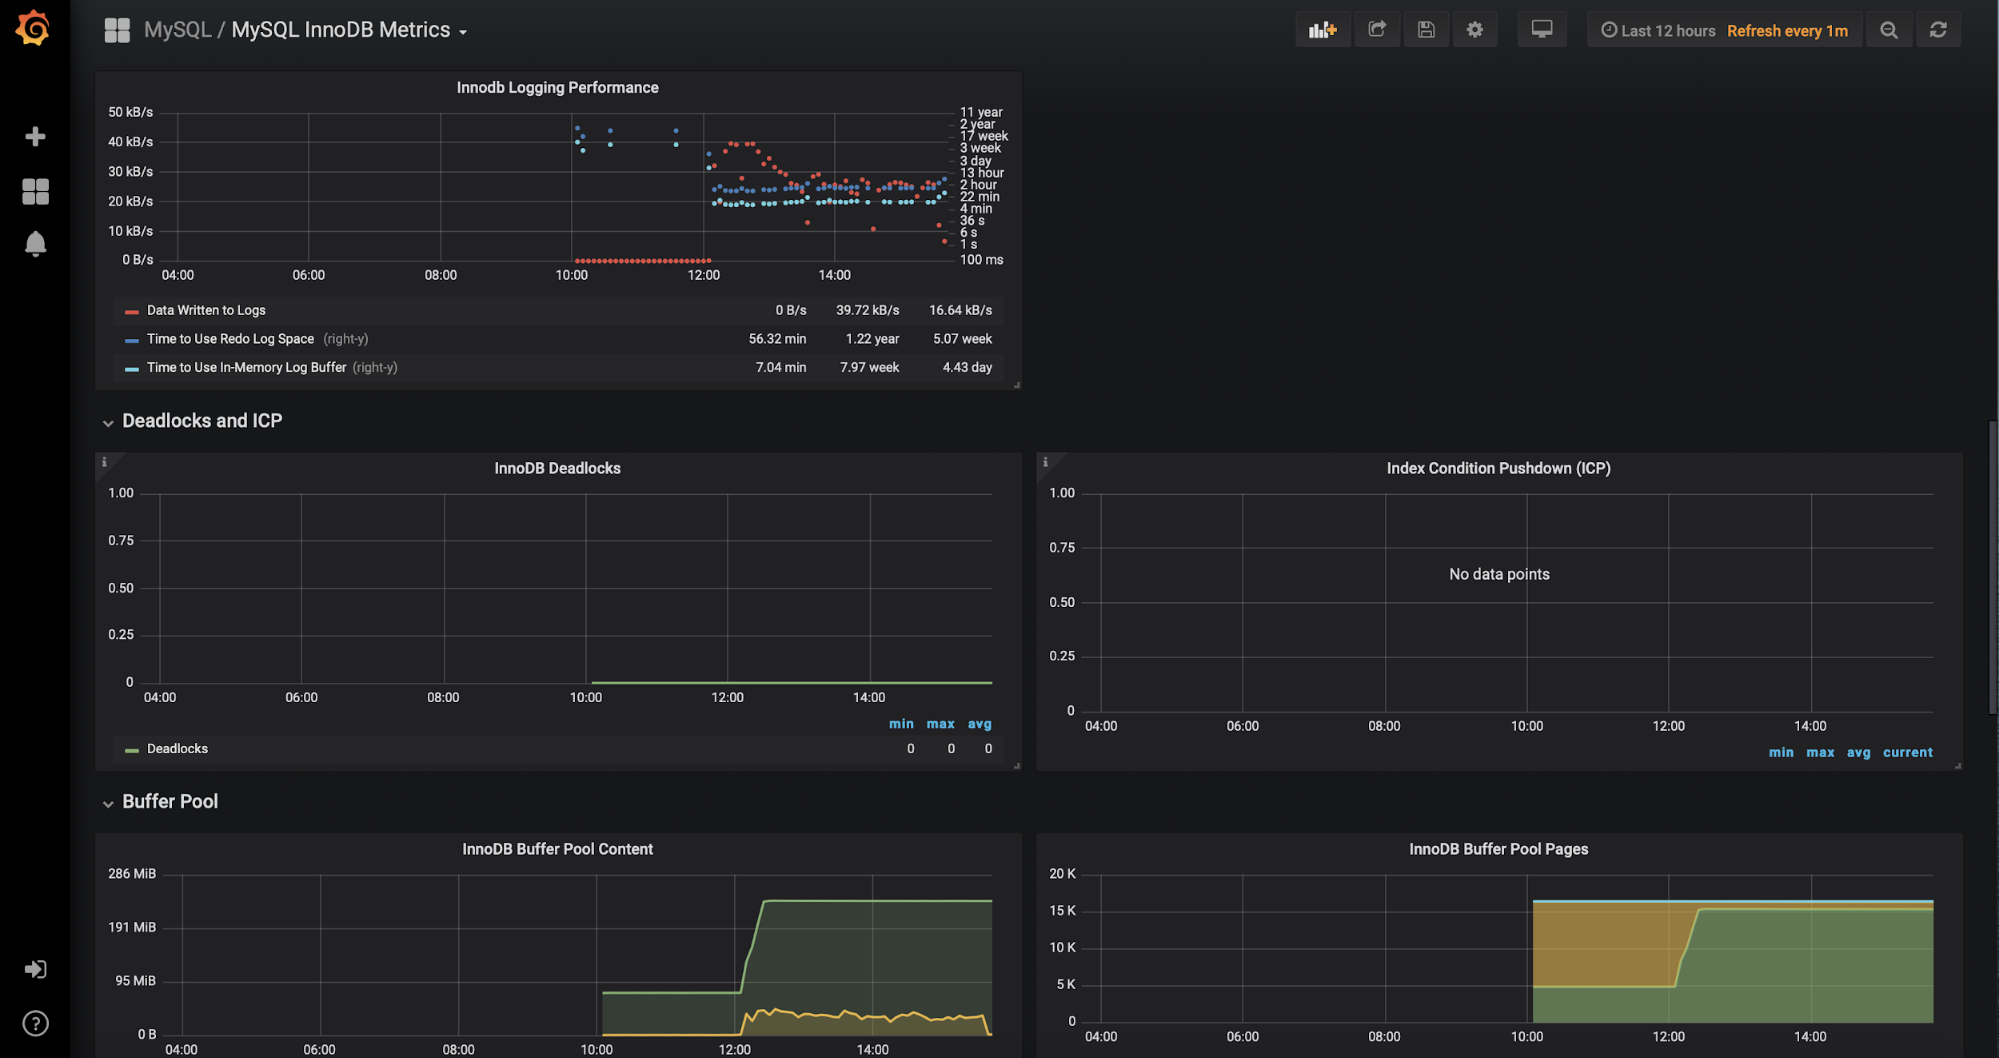
Obviously, there are pros and cons to everything. While casual users will initially struggle to find meaningful data, someone experienced will be able to pretty much dissect the database performance and analyze it from multiple angles. PMM is definitely a powerful tool if you know how to use it.
Query Monitoring
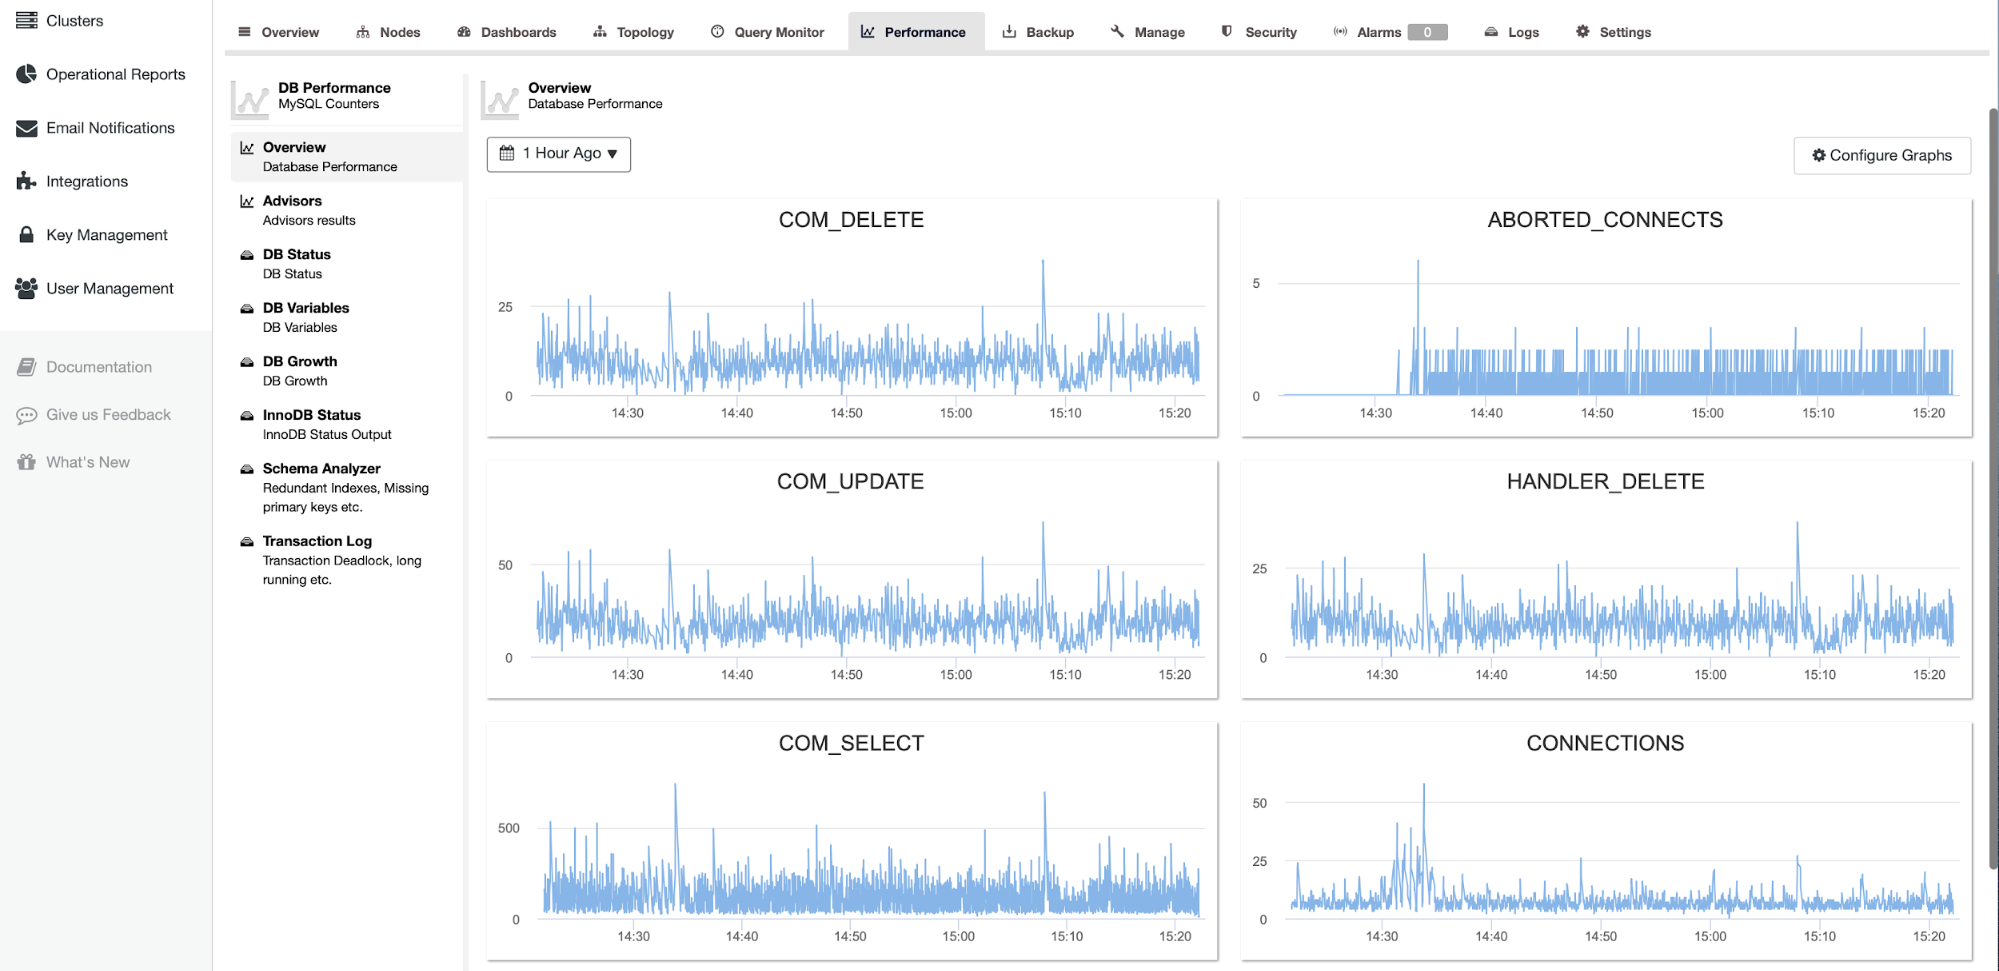
Both products provide an option to monitor query performance. Both collect the data in the similar fashion – through Performance Schema or slow query log. ClusterControl presents only the most important bits of the data: total execution time, some metrics like an average execution time or standard deviation for a given query type:
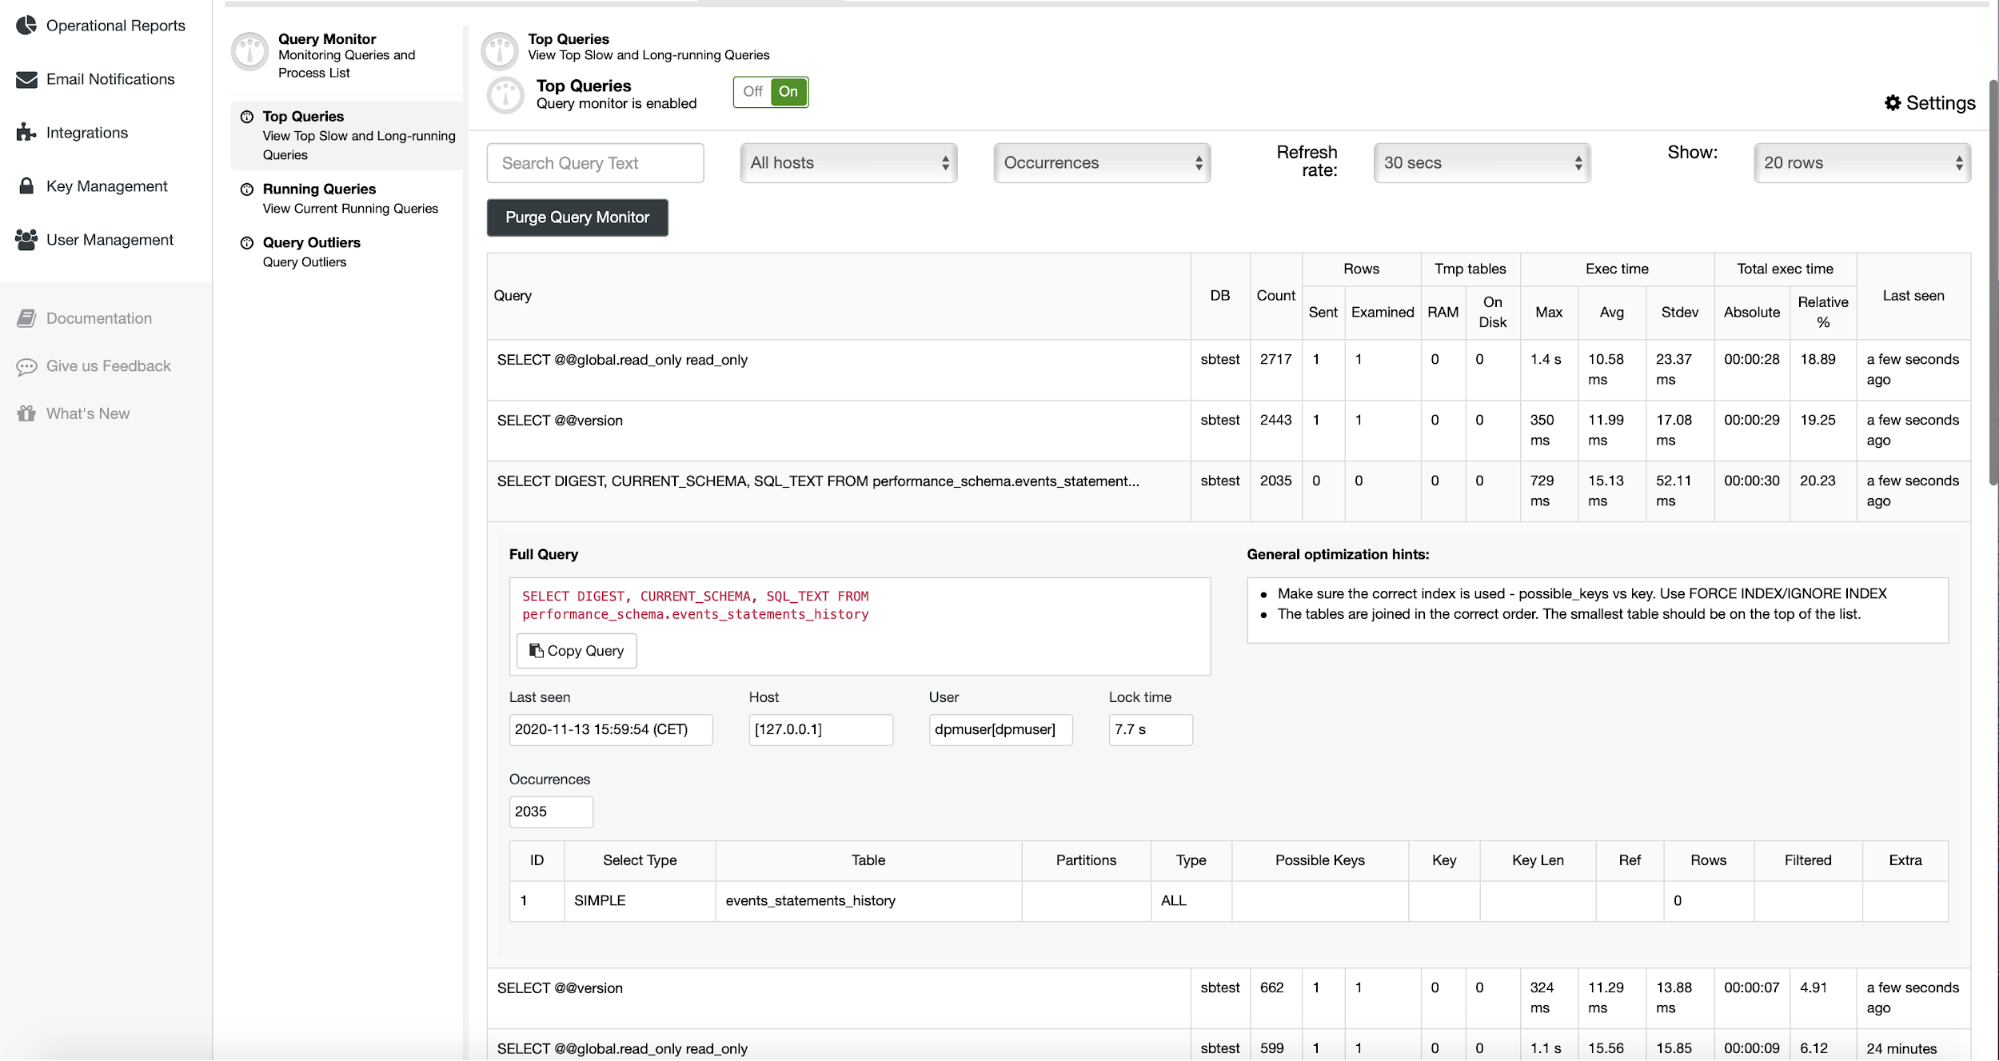
On the other hand, PMM makes available a very detailed overview of the query performance
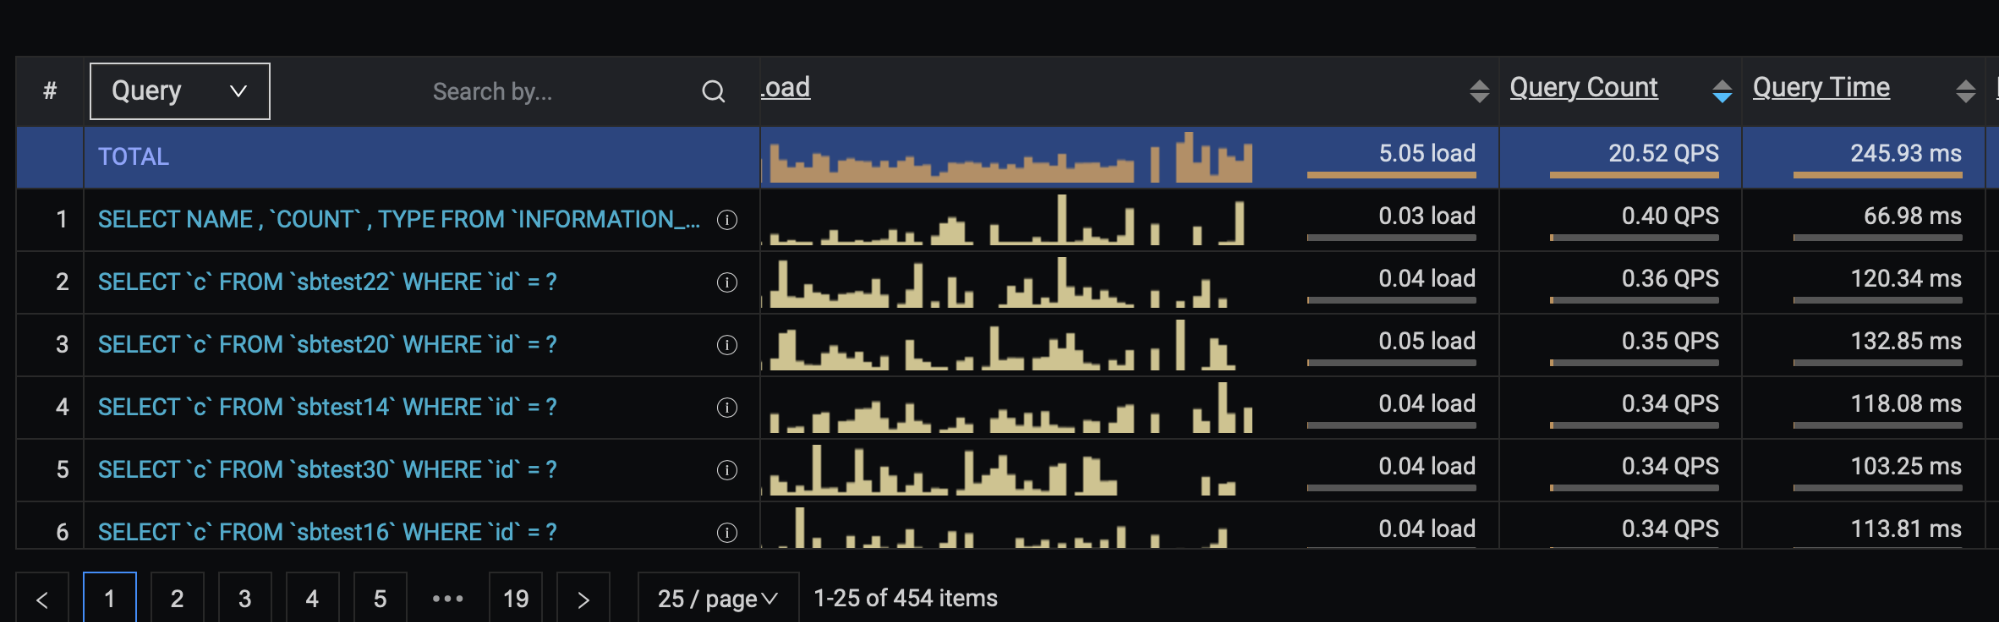
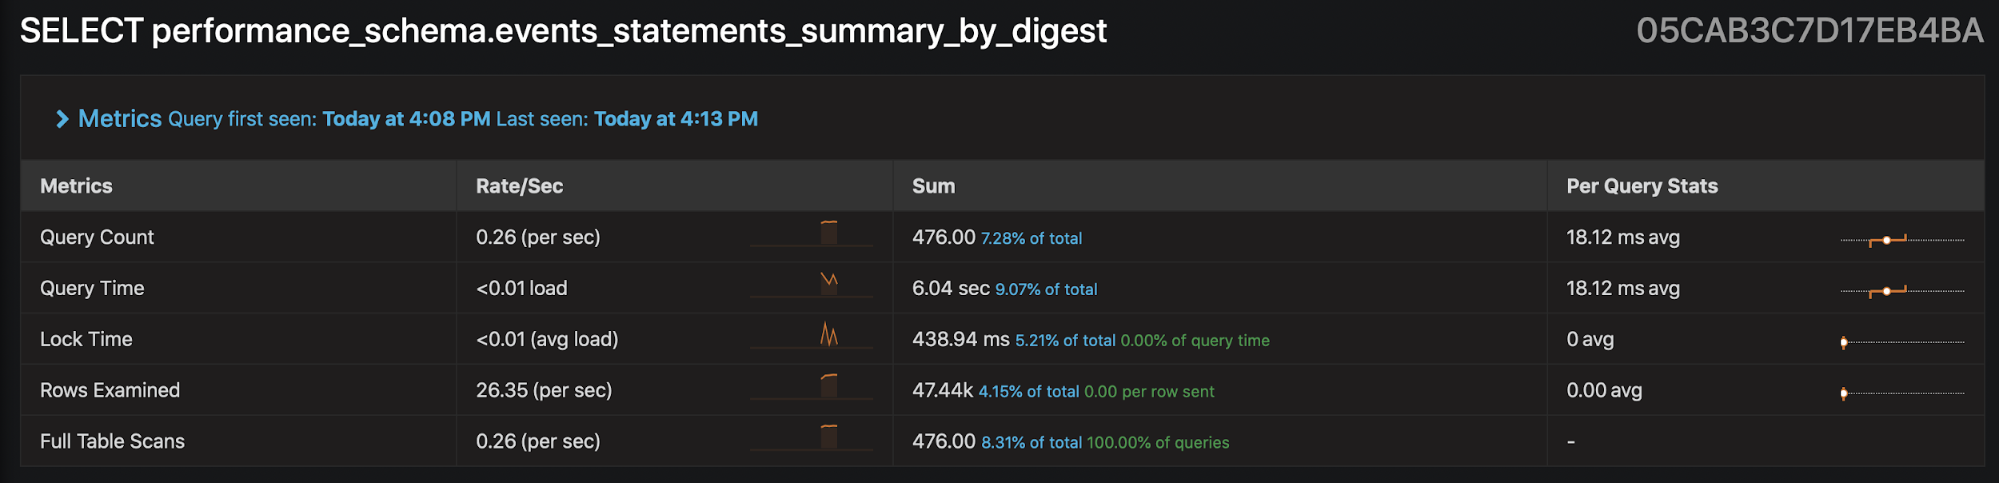
It allows to see the query performance change in time as well as detailed statistics about the particular query itself.
Management Features of ClusterControl and Percona Monitoring and Management
By default, PMM does not provide any kind of management features. The only optional feature is the automated failover handling and replication topology management implemented through Orchestrator, which can be enabled manually when you start a PMM docker container. This is the only piece of management functionality that comes with PMM. Percona provides multiple management options through Kubernetes operators for Percona-flavoured databases, we have covered them in our other blog posts.
On the other hand ClusterControl has an extensive set of management features that starts with automated failover but goes through node management, scaling (adding nodes to the cluster), backups, automation of creating DR sites and clones of production clusters. ClusterControl also helps during the upgrade process and it comes with a user interface for load balancers like ProxySQL. The best way to get yourself familiar with all the features that ClusterControl provides would be to register for a free trial and experience all of them for yourself.


