blog
Building a Monitoring Pipeline for InfluxDB with Sensu & Grafana

Metrics are at the heart of any good monitoring strategy — including how to collect them, where to send them, and how you visualize that data. In this post, I’ll walk you through building your own open-source monitoring pipeline with Sensu, InfluxDB, and Grafana to monitor performance metrics (specifically, check output metric extraction). While I won’t go into step-by-step installation instructions for each of these tools, I’ll make sure to link out to the proper guides so you can follow along.
Checking Output Metric Extraction with Sensu
Sensu is an open source monitoring solution that integrates with a wide ecosystem of complementary tooling (including InfluxDB and Grafana). Sensu Go is the latest and greatest version of Sensu — it’s designed to be more portable, faster to deploy, and (even more) friendly to containerized and ephemeral environments. To try it out (and get started quickly so you can follow along), download the Sensu sandbox. The Sensu sandbox comes pre-loaded with Sensu and related services up and running so you can skip the basic install steps and just focus on learning how to monitor performance metrics.
Here’s what we’ll be doing with our metrics:
- Collecting using Sensu check output metric extraction
- Transforming, with the Sensu InfluxDB handler
- Recording, in an InfluxDB time-series database
- Visualizing, on a Grafana dashboard
Getting the Sandbox Setup
First off, we’ll collect metrics using the aforementioned Sensu check output metric extraction. To get started, you’ll need to spin up your Sensu backend, agent, and CLI (sensuctl is our command-line tool for managing resources within Sensu — see this guide for more info). Below I’ll give the commands necessary to get things up and running inside the sandbox. If you aren’t using the sandbox you’ll be able to still follow along with some minor changes to your commands.
Start up the sandbox:
ENABLE_SENSU_SANDBOX_PORT_FORWARDING=1 vagrant upThis will enable port forwarding for services running inside the sandbox so you can access them from the host machine.
Enter the sandbox:
vagrant sshStart backend inside the sandbox:
sudo systemctl start sensu-backendStart agent inside the sandbox:
sudo systemctl start sensu-agentConfigure CLI (if you’re not using the sandbox):
sensuctl configureConfirm the Sensu agent is running
sensuctl entity listYou should see a listing for sensu-go-sandbox
Collecting Metrics
Now that you have Sensu running in the sandbox, it’s time to create a check and configure it to extract metrics. The script I’m using in our examples is system-profile-linux, which prints metrics in Graphite Plaintext Format, but Sensu supports several other formats. Another note worth calling out: the example command is only compatible with Linux, because that’s what the Sensu sandbox is using, but Sensu works with several operating systems (including OSX, Windows, and Docker). If you’re using another OS, you’ll have to adjust your check commands to make sure they’re compatible. The main thing we want is for the check command to print at least one metric in the specific output-metric-format.
First let’s add the system-profile-linux asset to our system by making use of sensuctl’s Bonsai integration (introduced in Sensu Go 5.14).
sensuctl asset add sensu/system-profile-linux We’ll be referencing that asset definition to ensure system-profile-linux asset is downloaded by the Sensu agent running the metrics collection check.
sensuctl check create collect-metrics --command system-profile-linux

--interval 10 --subscriptions entity:sensu-go-sandbox

--output-metric-format graphite_plaintext

--runtime-assets sensu/system-profile-linux
After the check executes, enter the following to make sure that the check passed with a 0 status. Since the metrics are not stored in Sensu, you can validate that the metrics have been extracted properly by using a debug handler — check out this guide for an example.
sensuctl event info sensu-go-sandbox collect-metrics --format jsonTransforming Metrics
Now it’s time to handle the events we’ve received from our checks and metrics! I wrote the sensu-influxdb-handler to transform any metrics in a Sensu event to send to InfluxDB and it’s available in the Bonsai asset index here. Instead of downloading it manually and installing it into the sandbox, you can add it to our Sensu assets with sensuctl:
sensuctl asset add sensu/sensu-influxdb-handler And then reference that new asset in an InfluxDB handler definition:
sensuctl handler create sensu-influxdb-handler --command

"sensu-influxdb-handler --addr http://localhost:8086 --username sensu

--password sandbox --db-name sensu --type pipe
--runtime-assets sensu/sensu-influxdb-handler"
Now assign the handler to the check we created earlier:
sensuctl check set-output-metric-handlers

collect-metrics sensu-influxdb-handler
Recording Metrics
In order to record all these metrics, you’ll want to have the InfluxDB daemon running on the configured address for the database and credentials recorded in your handler command (above).
Note: the handler above is using the addr, username, password, and db-name configuration appropriate for the InfluxDB setup and running locally in the Sensu sandbox. If you want to route the metrics to a different InfluxDB database, just edit the handler command definition accordingly. The sandbox also comes with the influxd tool, so that you can easily query InfluxDB to make sure that the metrics were handled and recorded.
Visualizing Metrics
It’s time to visualize the data you’ve collected. If you are running Grafana outside of the sandbox, make sure to check the Grafana configuration file you are using has no port collisions with Sensu (such as port 3000), then start your Grafana server. Sensu sandbox users should have access to a running Grafana service all ready, accessible from the sandbox host at http://localhost:4002 (if you have enabled port forwarding when creating the sandbox).
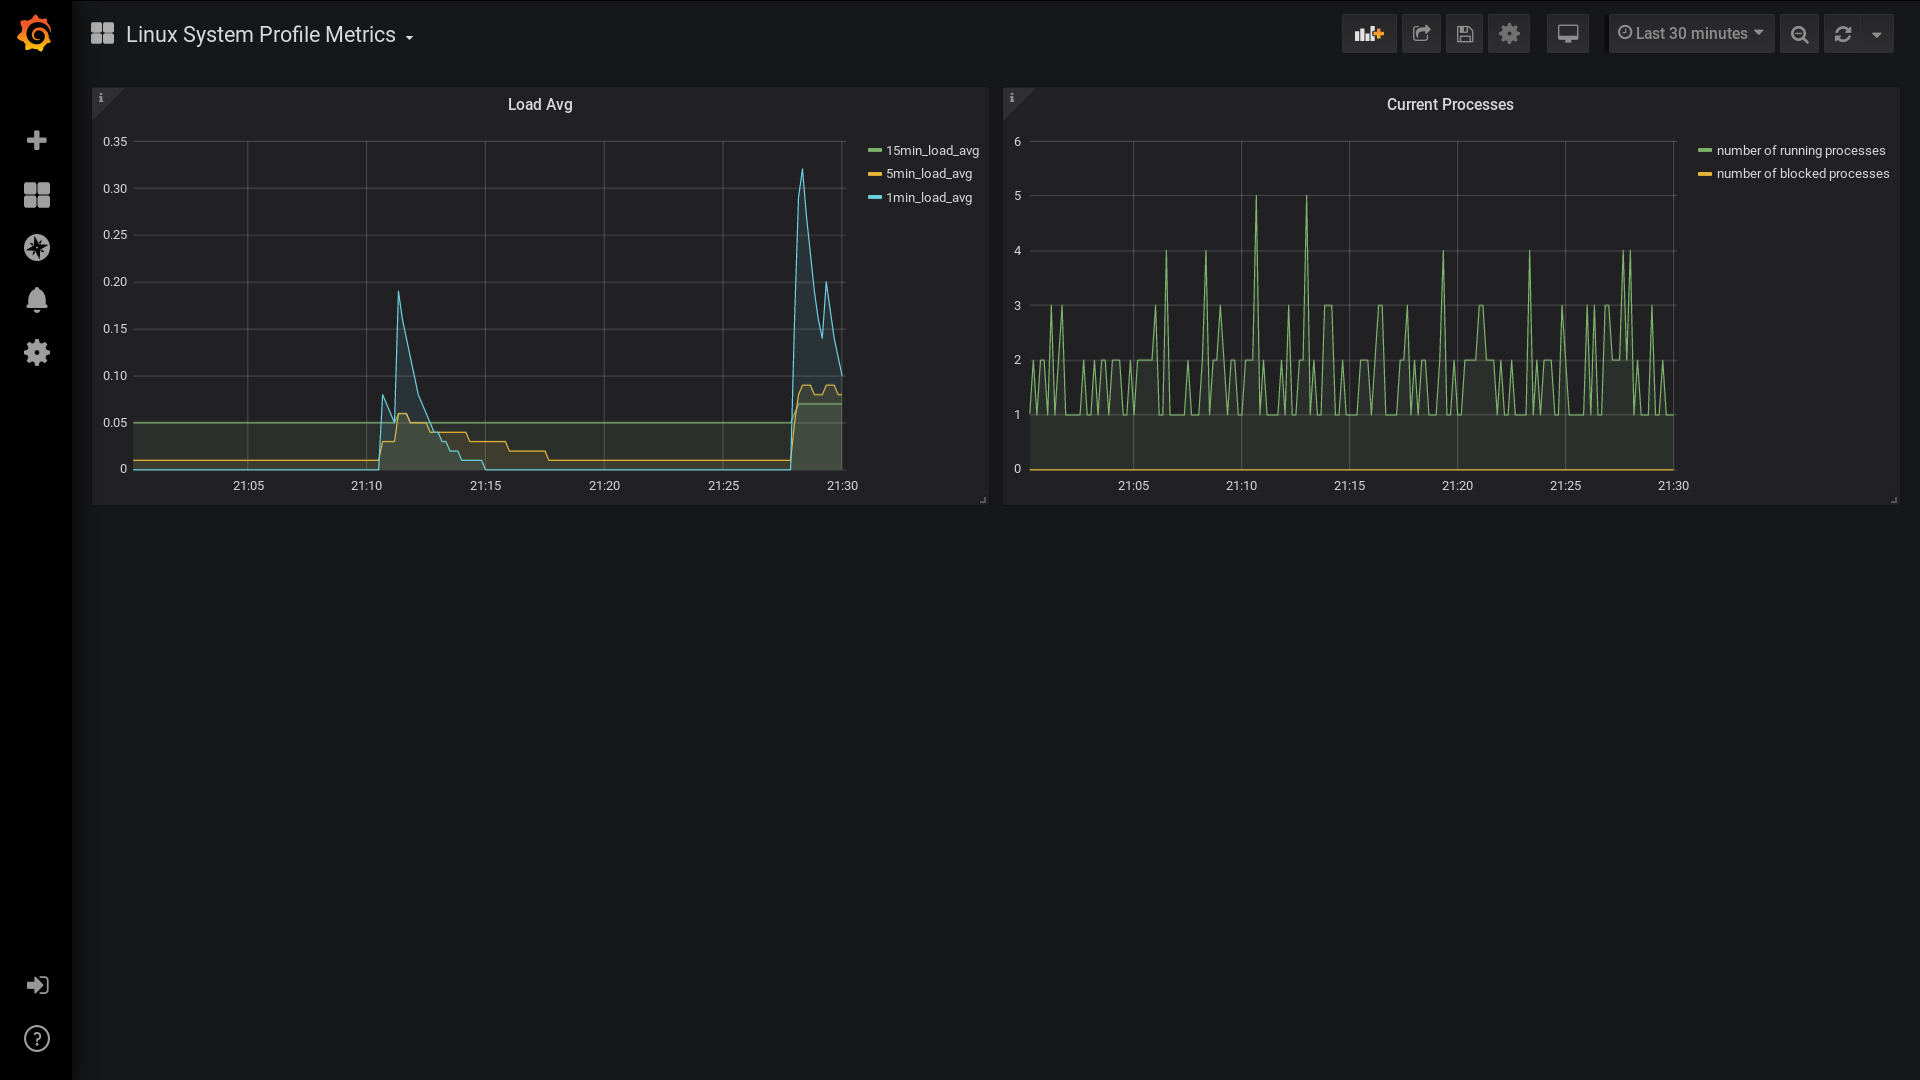
Don’t forget to customize your dashboard based on the output from your check. You can also use this dashboard configuration I created. You’ll also need to connect the InfluxDB data source in your Grafana dashboard — check out this guide to learn how. If all goes to plan, you should be able to see the metrics being collected, like in the example dashboards below.
I hope this was a helpful guide to getting started building your own open-source monitoring pipeline. Questions, comments, or feedback? Find me on Twitter or in the Sensu Community. Thanks for reading, and happy monitoring!