blog
Benchmarking databases 101 – part 1

Benchmarks are one of the activities that database administrators perform. You run them to see how your hardware behaves, you run them to see how your application and database work together under pressure. You run them in many different situations. Let’s talk a little bit about them, what are the challenges you are going to face, what are the issues you should avoid.
Types of benchmarks
Every benchmark is different. They serve different purposes and it has to be taken into account when you plan to run one. In general, you can define two main types of benchmark: synthetic benchmark and, let’s call it, a “real world” benchmark.
Synthetic benchmarks are typically tools that simulate some sort of a workload. It can be an OLTP workload like in the case of Sysbench, it can be some “standard” benchmark as in TPC-C or TPC-H. Usually the idea is that such a benchmark simulates some sort of a workload and it might be useful if your real-world workload is going to follow the same pattern. It can also be used to determine how your mix of hardware and database configuration works together under a given type of workload. The pros of synthetic benchmarks are quite clear. You can run them everywhere, they do not depend on some particular setup or schema design. Well, they do but they come up with tools to set everything up from the empty database server. The main downside is that this is not your workload. If you are going to run OLTP tests using Sysbench then you have to keep in mind that your application will never be Sysbench. It may also run OLTP workload but the query mix will be different. Never, under any circumstances synthetic benchmark will tell you exactly how your application will behave on a given hardware/configuration mix.
On the other end of the spectrum we have, what we called, “real world” benchmarks. What we mean here by that is a benchmark that uses a data set and queries related to your application. It doesn’t always have a full data set and full query mix. You may want to focus on some parts of your application, but the main idea behind it is that you want to understand the exact interactions between the application, hardware and database configuration, either in general or in some particular aspect.
As we mentioned above, we have two main, different types of benchmarks but, still, they have some common things you have to consider while attempting to run the benchmarks.
-
Decide what you want to test
First of all, benchmarking for the sake of running benchmarks is pointless. It has to be designed to actually accomplish something. What do you want to get out of the benchmark run? Do you want to tune the queries? Do you want to tweak the configuration? Do you want to assess the scalability of your stack? Do you want to prepare your stack for a higher load? Do you want to do a generic configuration tweeking for a new project? Do you want to determine the best settings for your hardware? Those are examples of objectives you may want to accomplish. Each of these will require a different approach and different benchmark setup.
-
Make one change at a time
Whatever you are testing and tweaking, it is of utmost importance that you will make only one configuration change at a time. This is really critical. The benchmark is intended to give you some idea about the performance. Queries per second, latency, 99 percentile, this all tells you how fast you can execute the queries and how stable and predictable the workload is. It is easy to tell if the change you made in the configuration, hardware or query mix changes anything: the metrics from the benchmark will look different. The thing is, if you make a couple of changes at the same time, there is no way to tell which one is responsible for the overall result. It can go even further than that. Let’s say you have changed two values in database configuration. Value A and B. The overall improvement is 20%, which is quite good for just a config change. Under the hood, though, change to value A brought improvement of 30% while additional change to value B set it back to 20%. With multiple changes at the same time you can only observe their common impact, this is not the way to properly determine the outcome of every single change you made. Sure, this significantly increases the time you will spend running the benchmark but that’s the way it is.
-
Make multiple benchmark runs
Computers are complex systems on their own. They have multiple components that interact with each other: memory, CPU, disk, networking. Then let’s add to this virtualization, containerization. Then software – operating system, application, database. Layer over layer over layer over layer of elements that interact somehow. It is not easy to predict its behavior. Well, you can say it is almost impossible to precisely predict the behavior of such complex systems. This is the reason why running one benchmark run is not enough to draw the conclusions. What if, unknowingly to you, some element, totally unrelated to what you want to test, impacts the overall performance? High load on another VM located on the same host. Some other server is streaming backup over the network. This may temporarily impact the performance and skew benchmark results. If you execute just one benchmark run, you will end up with incorrect results. This is why the best practice is to execute several passes of a benchmark and then remove the slowest and the fastest one, averaging the others.
-
A picture is worth thousands of words
Well, this is pretty much a very accurate description of benchmarking. If only possible, always generate graphs. Ideally, track the metrics during the benchmark as often as you can. One second granularity should be enough for most of the cases. To avoid writing thousands of words, we’ll include this example. What do you think is more useful? This set of benchmark outputs that represent average QPS for each of 10 passes, every pass taking 600 seconds
11650.52
11237.97
11550.16
11247.08
11177.78
11163.76
11131.47
11235.06
11235.59
11277.25
Or this plot:
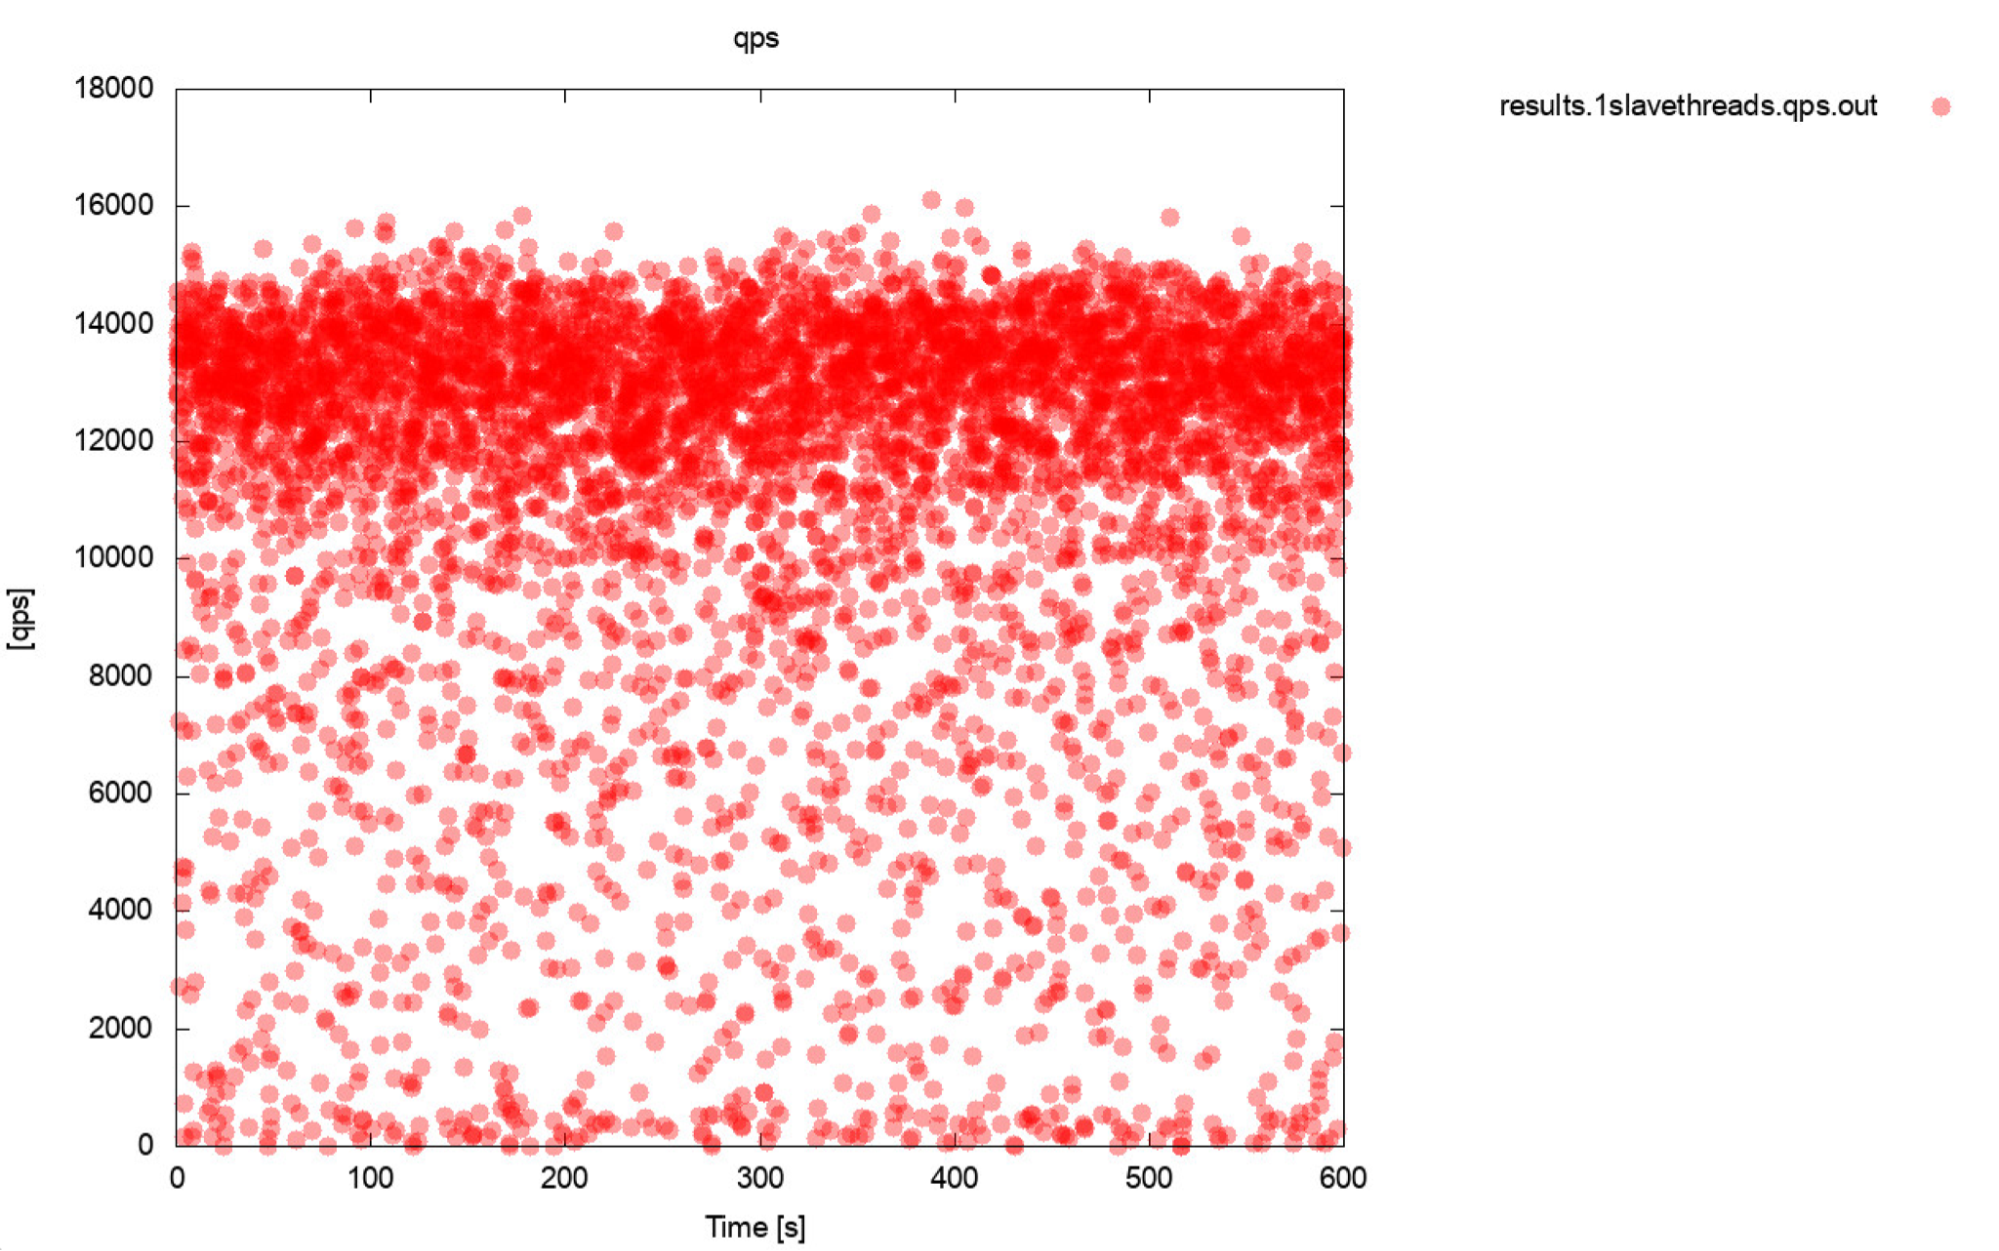
The average QPS is 11k but the reality is the performance is all over the place, including dips to 0 queries executed within a second, and it is definitely something you want to work and improve on the production systems.
-
Queries Per Second are not the most important metric
You may think that query per second is the holy grail of performance as it represents how many queries a database can execute within one second. The truth is, it is not the most important metric, especially if we are talking about averaged output from a benchmark. QPS represents the throughput but it ignores the latency. You can try to push a large volume of queries but then you end up waiting for them to return results. This is not what users expect from the application. Users expect stable performance. It doesn’t have to be blazing fast but when some action takes a second to complete, we tend to expect that performing that action will take that 1 second always. If, for some reason, it starts to take longer, humans tend to get anxious. This is the main reason why we tend to prefer latency, especially its P99 (99th percentile) as a more reliable metric. Latency tells us how long the application had to wait for the result from the database. P99 tells us latency that 99% of the queries have lower than. Let’s say we have a P99 of 100ms, it means that 99% of queries return results not slower than 100ms. If we see P99 latency low, it means that almost all queries are returning fast and perform in a stable, predictable manner. This is something our users want to see.
-
Understand what is happening before drawing conclusions
Last point that we have in this short blog but we would say it is the most important one. You will see different odd and unexpected results and behaviors during benchmarks. Even worse, you may see pretty standard, repetitive but still flawed results. Most of them can be tracked to the behavior of the database or hardware. This is really crucial – before you take the result for granted, you should be able to explain the behavior and describe what happened. We know it is not easy and we know it really requires database-specific knowledge, especially knowledge related to the database internals. We know that in the real world people typically don’t bother with this, they just want to get some results. The thing is, especially for cases where you are attempting to improve the performance through configuration or hardware tweaks, understanding what happened under the hood allows you to pick the proper way in which your tuning should proceed. It also makes it possible to tell if the benchmark that has been executed may have any sense. Are we actually testing the correct element? An example would be a test executed over the network (because you would not want to use local CPU cores of the database node for benchmark tool). It is quite likely that the network itself and softirq CPU load will be the limiting factor, way earlier than you would hit “expected” bottlenecks like CPU saturation. If you are not aware of your environment and its behavior, you will measure your network performance to transfer large volumes of data, not the CPU performance.
As you can see, benchmarking is not the easiest thing to do, you have to have a level of awareness of what is going on, you should have a proper plan for what you are going to do and what do you want to test? In the next part of this blog we are going to go through some of the real-world test cases. What can go wrong, what issues we will encounter and how to deal with them.