blog
Understanding the HAProxy Statistics for MySQL & PostgreSQL

Having a Load Balancer is always a good option to improve your database environment. It can help you on redirect applications to available database nodes, distribute the traffic across multiple servers to improve performance, or even failover when required. In order to know what is happening with your traffic/system, you need to have a good monitoring system in place to monitor not only your database nodes but also your Load Balancers, to take proactive or reactive actions to mitigate any current or future issue. To be able to find an issue, you need to understand what each value that you are seeing means.
In this blog, we will explain what the HAProxy statistics mean and how to monitor it in a friendly way using graphs and ClusterControl.
What is HAProxy?
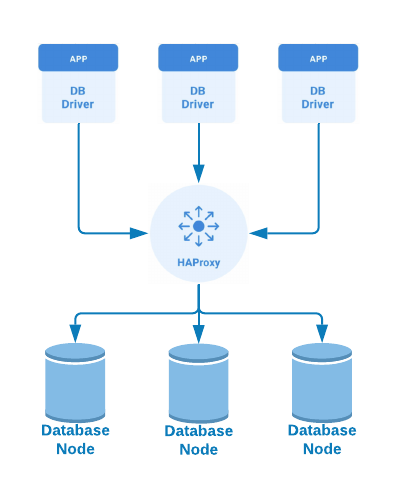
HAProxy is an open-source proxy that can be used to implement high availability, load balancing, and proxying for TCP and HTTP based applications.
As a load balancer, HAProxy distributes traffic from one origin to one or more destinations and can define specific rules and/or protocols for this task. If any of the destinations stops responding, it is marked as offline, and the traffic is sent to the rest of the available destinations.
HAProxy Node Types
When you configure your HAProxy Load Balancer, there are different node types to configure depending on the functionality you want. The options are Frontend, Backend, and Listen.
Frontend Nodes
When you place HAProxy as a reverse proxy in front of your backend servers, a frontend section in the configuration file defines the IP addresses and ports that clients can connect to. The requests enter the load balancer, and the responses are returned to the client. They pass through the frontend.
frontend site1.com

     bind 10.10.10.150:80

     use_backend api_servers if { path_beg /api/ }

     default_backend web_servers
Backend Nodes
It defines a group of servers that will be load balanced and assigned to handle requests, depending on the policy selected. HAProxy sends requests to a backend and then receives a response from one of the active servers.
backend web_servers

     balance roundrobin

     cookie SERVERUSED insert indirect nocache

     option httpchk HEAD /

     default-server check maxconn 20

     server server1 10.10.10.151:80 cookie server1

     server server2 10.10.10.152:80 cookie server2
Listen Nodes
It combines the two HAProxy node types that we mentioned above. You may prefer the readability gained by having separate frontend and backend sections, or maybe you want to have a more concise configuration, using the listen approach.
listen  haproxy_10.10.10.143_3307_rw

        bind *:3307

        mode tcp

        tcp-check connect port 9200

        timeout client  10800s

        timeout server  10800s

        balance leastconn

        option httpchk

        default-server port 9200 inter 2s downinter 5s rise 3 fall 2 slowstart 60s maxconn 64 maxqueue 128 weight 100

        server 10.10.10.139 10.10.10.139:3306 check

        server 10.10.10.140 10.10.10.140:3306 check backup

        server 10.10.10.141 10.10.10.141:3306 check backup
HAProxy Stats Page
HAProxy allows you to enable a stats page with real-time information to see what is happening in your Load Balancer. To enable the statistics page, you just need to use the “stats enable” directive in your HAProxy configuration file (/etc/haproxy/haproxy.cfg). Let’s see an example:
userlist STATSUSERS

        group admin users admin

        user admin insecure-password admin

        user stats insecure-password admin


listen admin_page

        bind *:9600

        mode http

        stats enable

        stats refresh 60s

        stats uri /

        acl AuthOkay_ReadOnly http_auth(STATSUSERS)

        acl AuthOkay_Admin http_auth_group(STATSUSERS) admin

        stats http-request auth realm admin_page unless AuthOkay_ReadOnly
The bind line sets which IP address and port you will use to access the stats page. You can also configure authentication and a refresh period. If you access your HAProxy node using the specified port (9600 in the example), admin/admin credentials, you will see something like this:
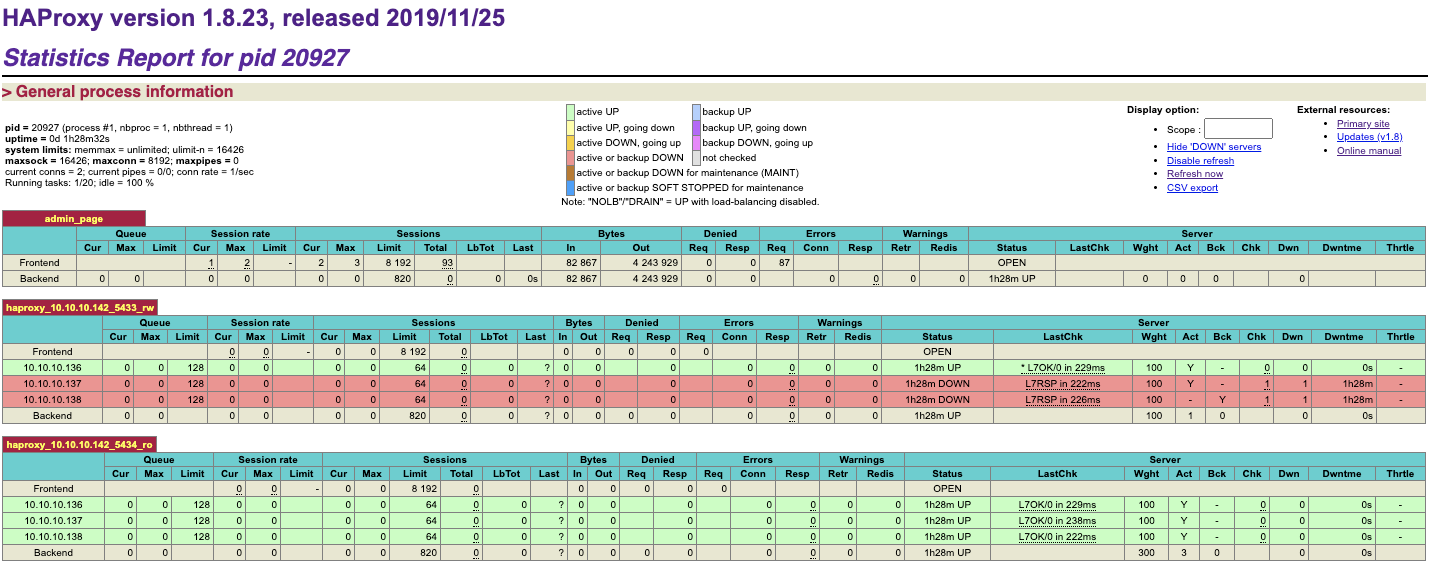
Here, you will find different useful metrics to monitor your HAProxy node.
HAProxy Statistics
Now, let’s see what these metrics are. As the meaning depends on the context, we will split it into Frontend and Backend.
Queue
Backend
This section applies only to backends and shows how long clients are waiting for a server to become available. HAProxy is able to queue connections when you use the maxconn setting.
The “Cur” column shows the number of client connections that are currently queued and not yet assigned to a server. The “Max” column shows the most connections that have ever been queued at once. The “Limit” column shows the maximum number of connections that are allowed to be queued, as defined by the maxqueue setting on each server line in the configuration file.
Session Rate
Frontend
Describes the rate at which clients are connecting to HAProxy.
The “Cur” column shows the current rate at which client sessions, or fully established connections between client and server, are being created. If you hover your mouse over this field, the page displays the following metrics:
- Current connection rate: The rate at which clients are connecting to HAProxy.
- Current session rate: The rate at which sessions, which are entities that hold the state of an end-to-end connection, are being created.
- Current request rate: The rate at which HTTP requests are being received over established connections.
The “Max” column shows the most sessions that have ever been in use simultaneously. If you hover your mouse over this field, the page displays the following metrics:
- Max connection rate: The highest rate at which clients have connected to HAProxy.
- Max session rate: The highest rate at which clients have established sessions, which are entities that hold the state of an end-to-end connection.
- Max request rate: The highest rate at which HTTP requests have been received over established connections.
The “Limit” column shows the maximum number of sessions per second that the frontend will accept, as set by the rate-limit sessions setting. If this limit is exceeded, additional connections are kept pending in the socket’s backlog.
Backend
These statistics show the rate at which connections are being made to a server.
The “Cur” column shows the current rate, per second, at which connections are being established to the server. The “Max” column shows the highest rate at which connections have ever been established to the given server. The “Limit” column is not used here.
Sessions
Frontend
This section counts the number of sessions, or full client-to-server connections, in use on the load balancer.
The “Cur” column shows the current number of established sessions. The “Max” column shows the most sessions that have ever been simultaneously established. The “Limit” column shows the most simultaneous sessions that are allowed, as defined by the maxconn setting in the frontend. That particular frontend will stop accepting new connections when this limit is reached. If maxconn is not set, then “Limit” is the same as the maxconn value in the global section of your configuration. If that isn’t set, the value is based on your system. When you hover over the “Total” column, the page displays the following metrics:
- Cum. connections: Cumulative number of connections established since HAProxy was last reloaded.
- Cum. sessions: Cumulative number of sessions (end-to-end connections) established since the last reload.
- Cum. HTTP requests: Cumulative number of HTTP requests since the last reload.
- HTTP xxx responses: Total number of HTTP requests that received an xxx response.
- Compressed 2xx: Total number of 2xx responses that were compressed, if compression has been enabled. It also shows the percentage of requests that were compressed.
- Other responses: Total number of HTTP requests that received a response not covered by the other metrics.
- Intercepted requests: Total number of requests intercepted and redirected to the HAProxy Stats page.
The “LbTot” and “Last” columns are not used in this section.
Backend
This section shows the number of current connections to any of the active servers.
The “Cur” column lists the number of active connections to a server. The “Max” column shows the most connections that have ever been simultaneously established to the given server. The “Limit” column shows the maximum number of connections allowed for a server, as set by the maxconn parameter on a server line.
The backend row shows the value of fullconn for “Limit” or, if not set, it uses the following formula: Sum of the Sessions Limit values for frontends that route to this backend, divided by 10. The “Total” column shows the cumulative number of connections that have used the given server. When you hover over this field, the page displays the following metrics:
- Cum. sessions: Cumulative number of connections established to this server.
- Cum. HTTP responses: Cumulative number of HTTP responses received from this server.
- HTTP xxx responses: Total number of HTTP xxx responses from this server.
- Other responses: Total number of HTTP responses not covered by the other metrics.
- Queue time: The amount of time in milliseconds that a connection stayed queued while waiting for a connection slot to the server, averaged over the last 1024 successful connections.
- Connect time: The amount of time in milliseconds it took to successfully connect to the server, averaged over the last 1024 successful connections.
- Response time: The server response time in milliseconds, averaged over the last 1024 successful connections.
- Total time: The total session time in milliseconds, averaged over the last 1024 successful connections.
The “LbTot” column shows the total number of times the given server was selected to serve a request. This can be due to normal load balancing or because of a redispatch from a failed server. The “Last” column shows the time since the last connection was received.
Bytes
Frontend
This section displays the cumulative amount of data sent and received between HAProxy and clients. The “In” column shows the total number of bytes received and the “Out” column shows the total number of bytes sent.
Backend
This section displays the amount of data sent and received between HAProxy and the server. The “In” column shows the number of bytes sent to the server. The “Out” column shows the number of bytes received back.
Denied
It shows the number of requests and responses that were rejected because of security concerns in both the Frontend and the Backend sections.
Frontend
The “Req” column shows the number of requests that were denied due to configuration directives (http-request deny, http-request reject, etc) placed in the Frontend or Listen section.
The “Resp” column shows the number of responses that were denied by an http-response deny directive that was placed in a frontend or listen.
Backend
The “Req” column only applies to the backend as a whole. It shows the number of requests that were rejected by configuration directives (http-request deny, http-request reject, etc) in a backend.
The “Resp” column shows the number of responses that were rejected for any given server due to http-response deny or tcp-response content reject configuration directives in a backend.
Errors
Frontend
Only the “Req” column is used here. It shows the number of requests that encountered an error.
Possible causes include:
- Early termination from the client
- A read error from the client
- The client timed out
- The client closed the connection
- The client sent a malformed request
- The request was tarpitted
Backend
It shows the number of errors related to communicating with a backend server.
The “Req” column is not used. The “Conn” column shows the number of requests that encountered an error while trying to connect to the server. The “Resp” column shows errors encountered while getting the response.
Warnings
Backend
Only for backends. This section displays the number of retries and redispatches. If you’ve added a retries directive to your backend, then the “Retr” column shows the total number of times that a connection was retried. The “Redis” column shows the number of times that HAProxy failed to establish a connection to a server and redispatched it to another server. This requires that you’ve added an option redispatch directive.
Server
Frontend
The only field from this section that applies to a frontend is the Status field. When Status is OPEN, the frontend is operating normally and ready to receive traffic.
Backend
This section shows details about the status, health, and weight of each server. The “Status” column displays if the server is currently up and for how long. It can display any of the following statuses:
- UP: The server is reporting as healthy.
- DOWN: The server is reporting as unhealthy and unable to receive requests.
- NOLB: You’ve added http-check disable-on-404 to the backend and the health checked URL has returned an HTTP 404 response.
- MAINT: The server has been disabled or put into maintenance mode.
- DRAIN: The server has been put into drain mode.
- no check: Health checks are not enabled for this server.
The “LastChk” column shows a value like L7OK/200 in Xms. That value means that a Layer 7 health check was performed; it returned an HTTP 200 OK response and it did so within X millisecond.
The “Wght” column shows the proportion of traffic it will accept, as set by the weight parameter on the server line. The “Act” column shows if the server is active (marked with a Y) or a backup (marked with a -). The “Bck” column shows if the server is a backup (marked with a Y) or active (marked with a -).
The “Chk” column shows the number of failed health checks. The “Dwn” column shows the number of transitions from UP to DOWN. The “Dwntme” column shows how long the server has been down.
If you’ve added a slowstart parameter to a server line, then when you disable and later enable that server, the “Thrtle” column shows the percentage of traffic the server will accept. The percentage will gradually rise to 100% over the period you’ve set.
This information is based on a HAProxy blog post that you can refer for more detailed information.
HAProxy on ClusterControl
Other than deployment and management, ClusterControl also provides insight into HAProxy statistics and Real-Time Dashboards from the UI. From ClusterControl, you can access the statistics page at ClusterControl -> Select Cluster -> Nodes -> choose the HAProxy node similar to screenshot below:
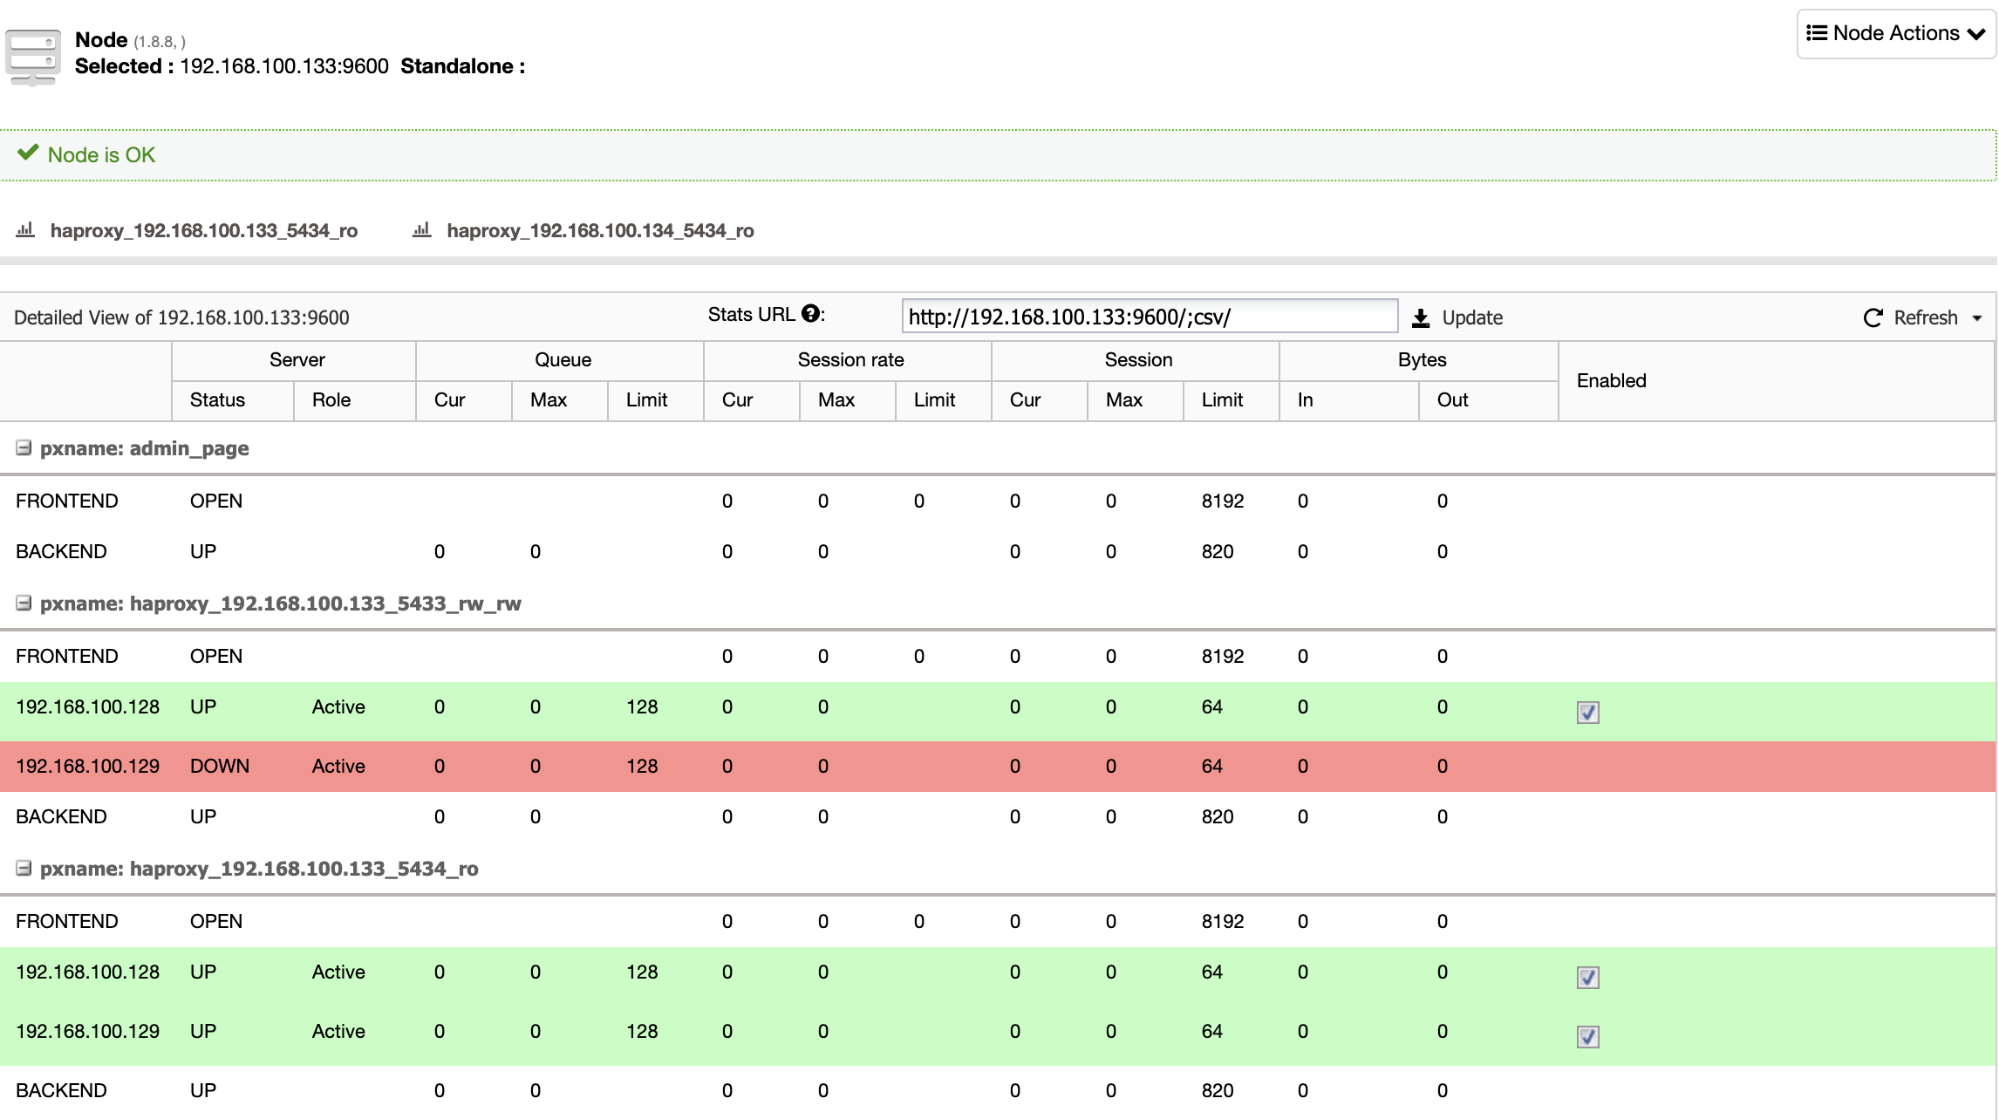
You can enable/disable a server from the load balancing by ticking/unticking the checkbox button under “Enabled” column. This is very useful when you want your application to intentionally skip connecting to a server e.g., for maintenance or for testing and validating new configuration parameters or optimized queries.
You can also monitor your HAProxy servers from ClusterControl by checking the Dashboard section.
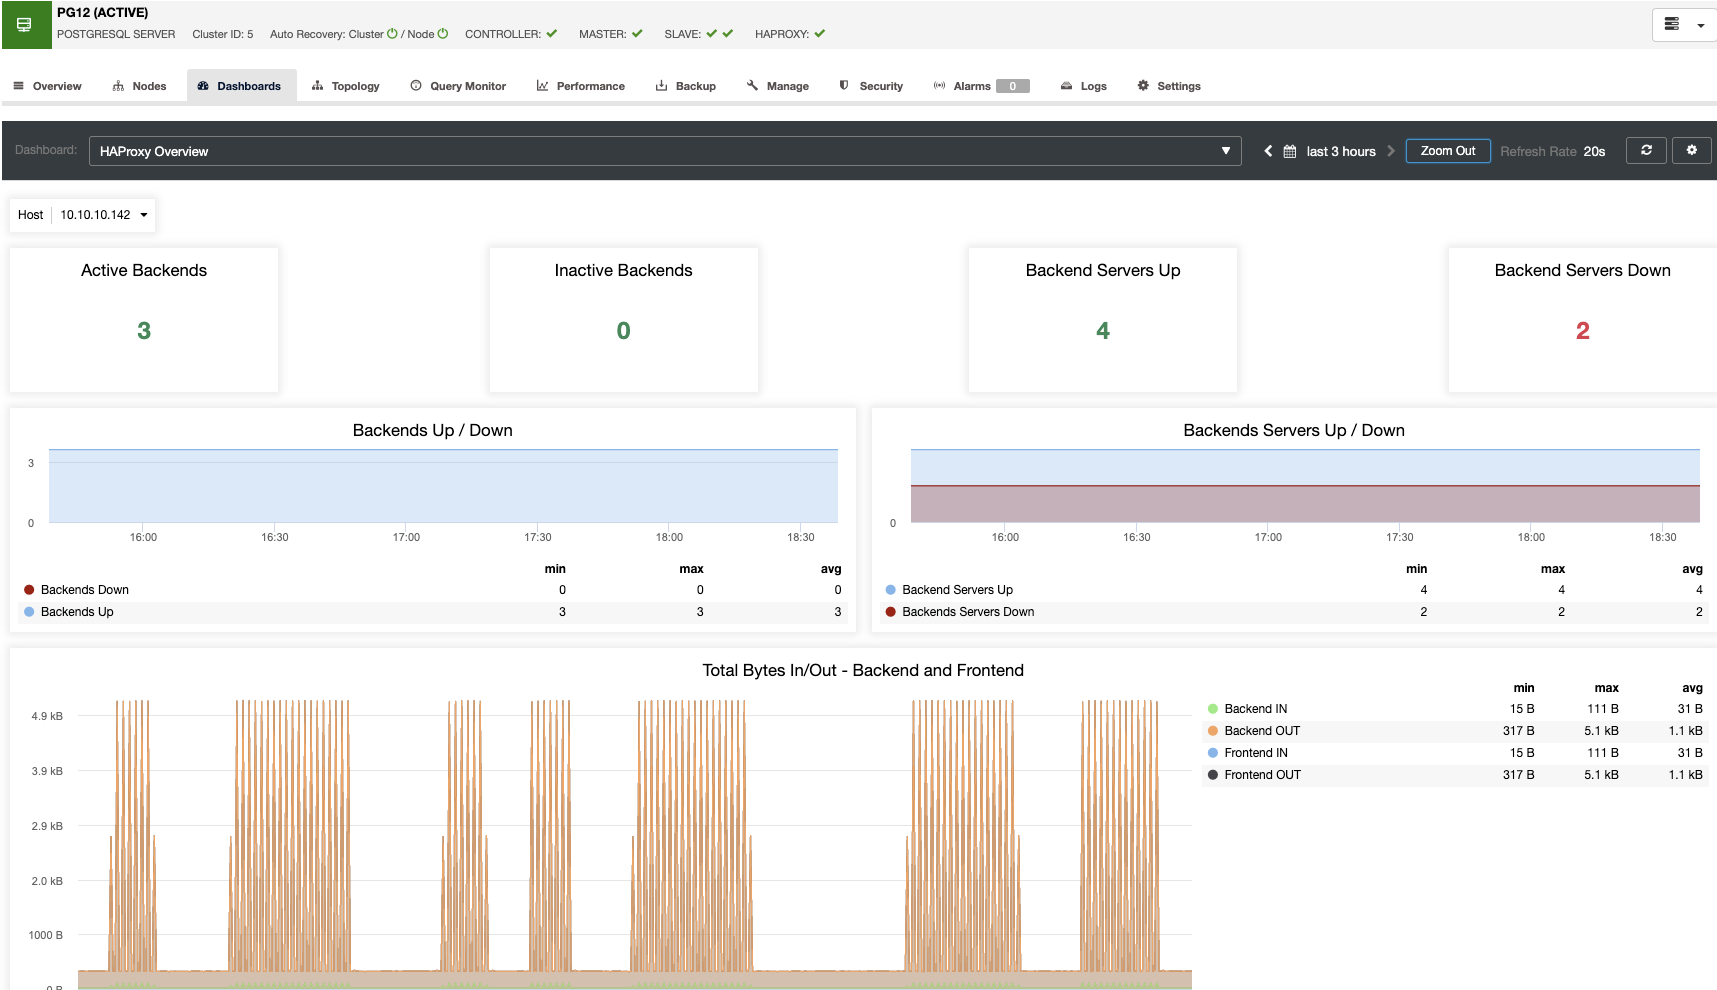
To enable it, you just need to go to ClusterControl -> Select Cluster -> Dashboards -> Enable Agent Based Monitoring. This will deploy an agent on each node to get all the information to generate the corresponding graphs.
Here, you won’t only see all the necessary metrics to monitor the HAProxy node, but also to monitor all the environment using the different Dashboards.
Conclusion
HAProxy is a good and powerful tool to improve your database and application performance. It is also useful to add High Availability and Failover to your environment. To know what is happening in your HAProxy node, you need to understand the metrics that are being monitored in the stats page, or even improve this monitoring by adding a dashboard to make it more friendly.
In this blog, we have explained each metric mentioned in the HAProxy stats page, and we also showed how it looks on ClusterControl, where you can access both statistics and dashboards HAProxy sections from the same system.