blog
Proactive MongoDB Monitoring (Developer Studio/Advisors angle)

ClusterControl has many metrics related to the database, replication, and also operating system. You can also monitor the process that runs inside the database through the opscounter in the Overview.
If you enable Agent Based Monitoring in ClusterControl, it will automatically install a prometheus database for time series database and also exporter (both mongo and node exporter) on the monitored node. After all has been setup, the Dashboard will be available for you with Cluster Overview, System Overview and also MongoDB (MongoDB Server and Replication) metrics that you can use to monitor the MongoDB database.
There is also an Ops Monitor in ClusterControl which can be used to monitor sessions inside the database.
Apart from the above mentioned, ClusterControl has capabilities to create custom Advisors through Developer Studio. In this blog, we will review Developer Studio and Advisors related to MongoDB.
Utilize Developer Studio
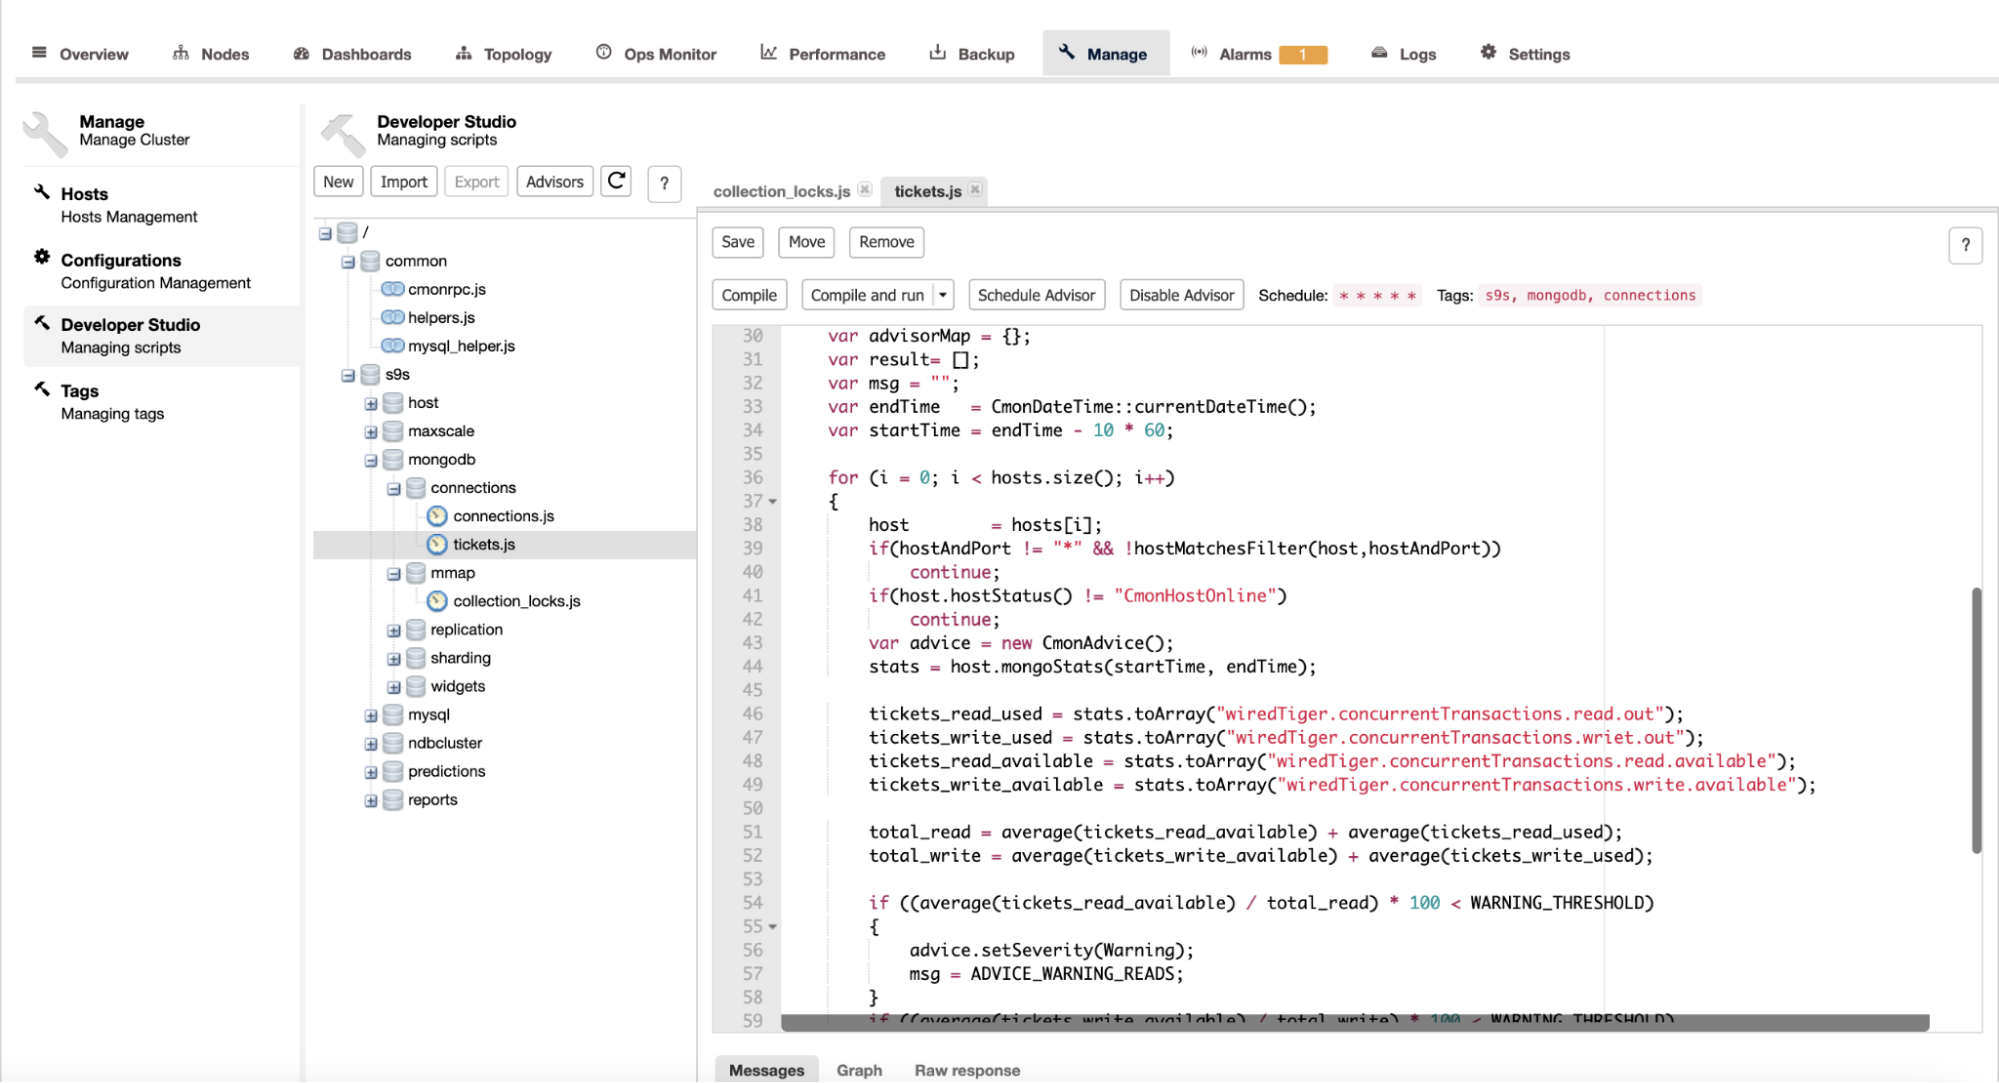
ClusterControl provides Developer Studio, so you can create custom Advisors related to the topic in MongoDB that you want to have advisory based on the best practices of database performance. Creating a script for custom advisors in MongoDB requires you to have knowledge in the javascript programming language, because all the advisors are written in javascript.You can access the Developer Studio through Manage -> Developer Studio, and you will be able to see the page as shown below:
We can create new advisor script by clicking on the New button, after that it will display a dialogue to fill the filename as shown below:
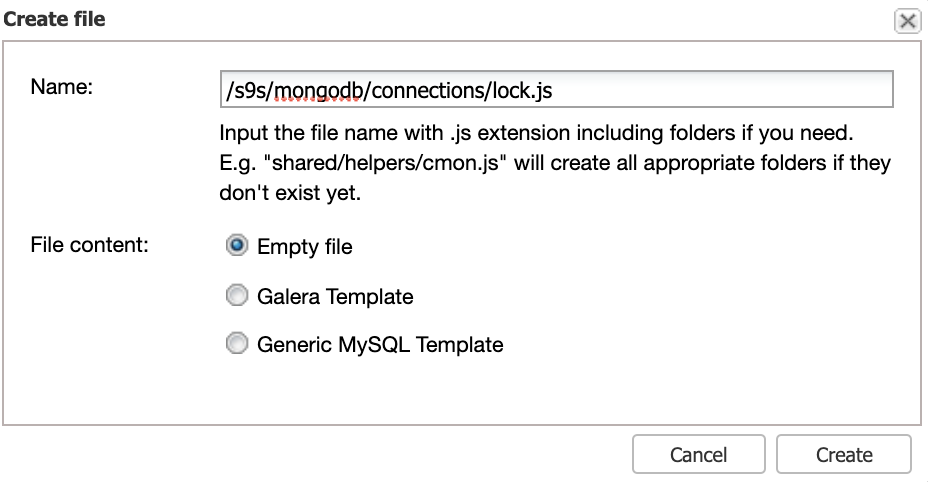
We will create a simple lock.js script that will be stored in the path s9s/mongodb/connections. The script collects information related to the global lock in the MongoDB. The number of high global locks will be a problem in MongoDB, because the lock is still on hold / not released yet. Below is the sample of global lock in javascript:
#include "common/helpers.js"
#include "cmon/io.h"
#include "cmon/alarms.h"

var DESCRIPTION="This advisor collects the number of global locks every minute and"
                " notifies you if the number of locks exceeds 90%."
                " This number can indicate a possible concurrency issue if it’s consistently high."
                " This can happen if a lot of requests are waiting for a lock to be released..";
var WARNING_THRESHOLD=10;
var TITLE="Global lock used";
var ADVICE_WARNINGS="In the past 5 minutes more than 90% of "
    " there could be concurrently issue in the database.";
var ADVICE_OK="The percentage of global lock is satisfactory." ;

function main(hostAndPort) {
    if (hostAndPort == #N/A)
        hostAndPort = "*";
    var hosts   = cluster::mongoNodes();
    var advisorMap = {};
    var result= [];
    var msg = "";
    var endTime   = CmonDateTime::currentDateTime();
    var startTime = endTime - 10 * 60;

    for (i = 0; i < hosts.size(); i++)
    {
        host        = hosts[i];
        if(hostAndPort != "*" && !hostMatchesFilter(host,hostAndPort))
            continue;
        if(host.hostStatus() != "CmonHostOnline")
            continue;
        var advice = new CmonAdvice();
        stats = host.mongoStats(startTime, endTime);
        total_global_lock = stats.toArray("globalLock.currentQueue.total");


        if (total_global_lock * 100 < WARNING_THRESHOLD)
        {
            advice.setSeverity(Warning);
            msg = ADVICE_WARNING;
        }
        if (advice.severity() <= 0) {
            advice.setSeverity(Ok);
        }
        advice.setHost(host);
        advice.setTitle(TITLE);
        advice.setAdvice(msg);
        advisorMap[i]= advice;
    }
    return advisorMap;
}
You can save the script, compile and run. You can schedule the script in Developer Studio based on the every minute, hour the script will run.
Advisors
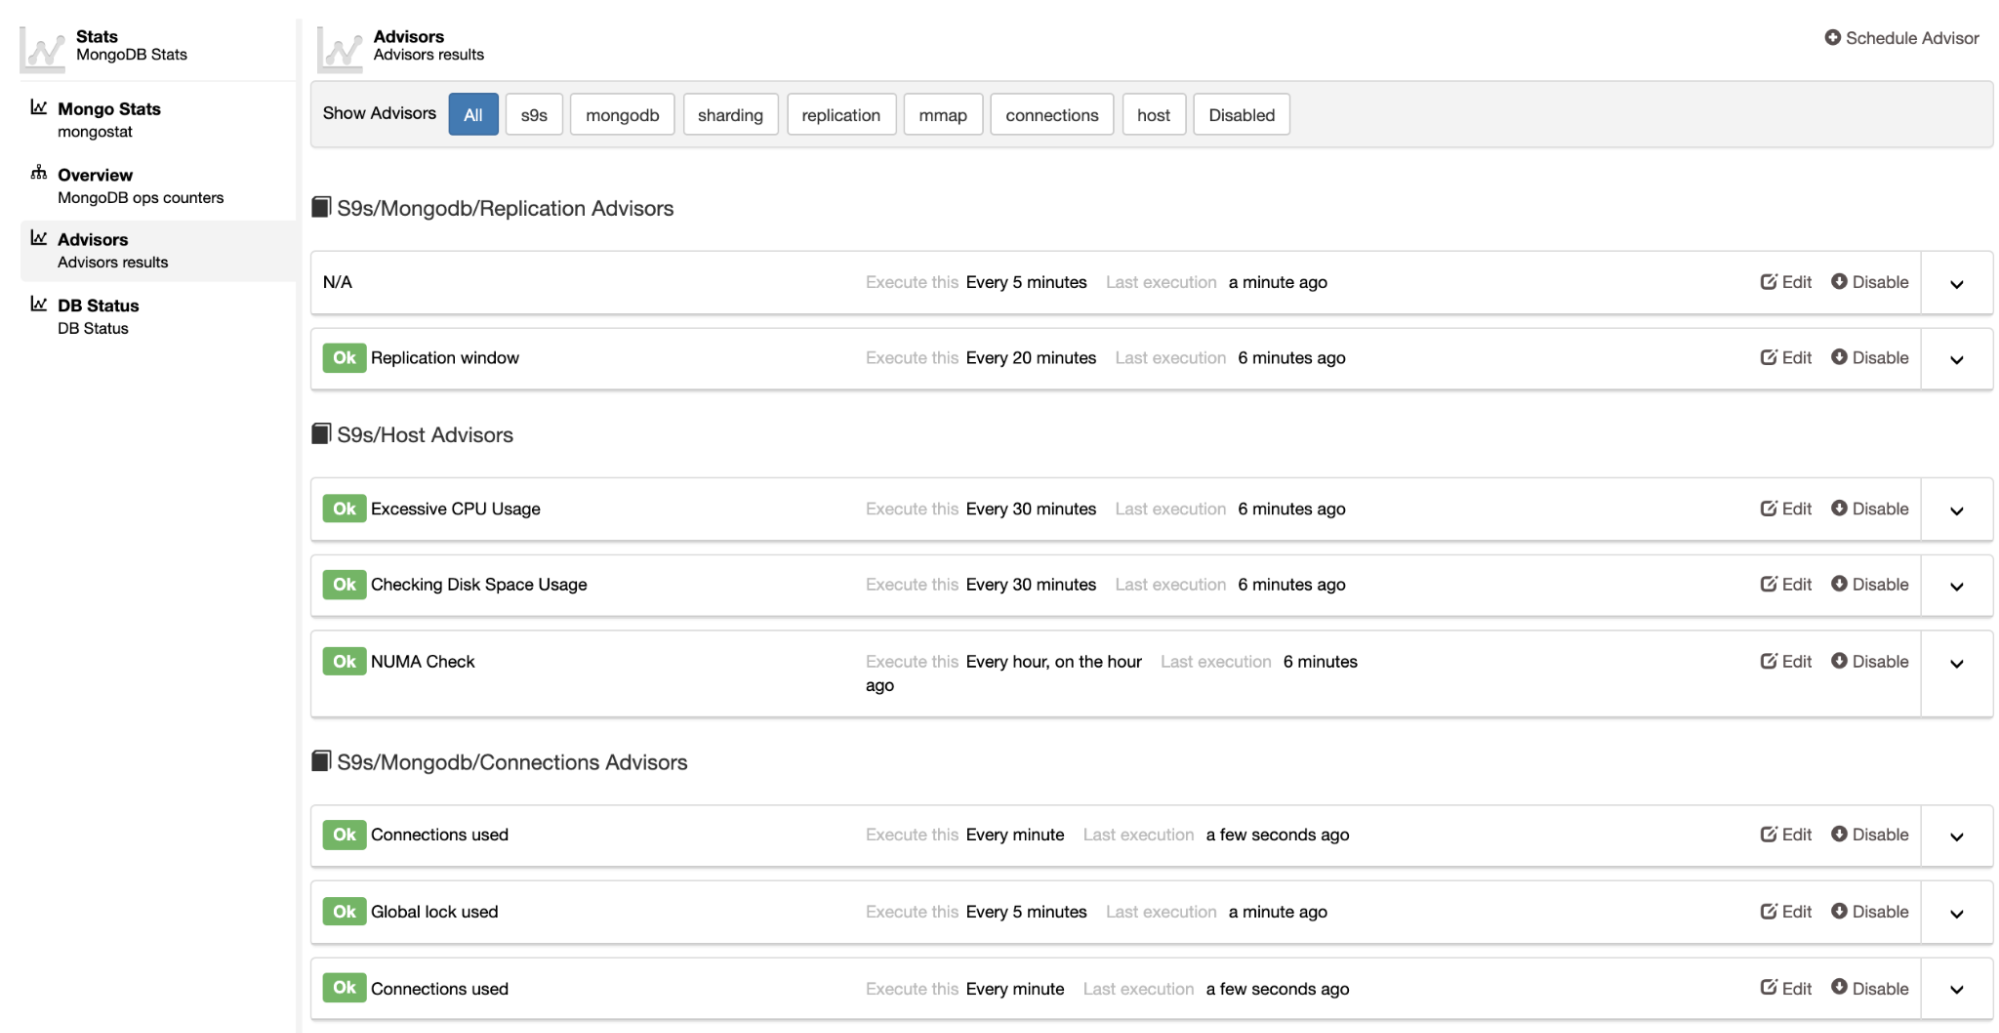
The Advisors give us visibility about the state of the script that we had created in the Developer Studio, the script will run and regularly check the current of global lock. If the state is below the threshold that we define, the output becomes OK, but it will appear warning if the current global lock is above the threshold. We can see on the below screenshot that the Global lock used is appear in the Advisors and the state is OK currently.
Conclusion
Developer Studio and Advisors can give you benefit to make custom Advisors based on your requirements and displayed in the ClusterControl dashboard, and ofcourse the alert too.
That’s all for today!


