blog
PostgreSQL Log Analysis With pgBadger

Sometimes logs are the last things checked when things are going wrong, but they are usually the first things screaming for help when something happens. Manually looking through the logs for problems helps, but why not use log analyzers to automatically generate reports to provide insight on the database before something goes wrong?
The PostgreSQL log analyzer “pgBadger” is an open source “fast PostgreSQL log analysis report” program written in Perl that takes the log output from a running PostgreSQL instance and processes it into an HTML file. The report it generates shows all information found in a nice and easy to read report format. These reports can help shed light on errors happening in the system, checkpoint behavior, vacuum behavior, trends, and other basic but crucial information for a PostgreSQL system.
PostgreSQL Logging Setup
To use pgBadger effectively, logging in PostgreSQL should be set up to provide pgBadger as much information as possible. A handful of options can tweaked to allow the database system to log useful information for pgBadger to generate useful reports. Full documentation for PostgreSQL configuration can be found on the pgBadger github page, but some basic information is below.
When run, pgBadger will process the logs from PostgreSQL whether they are syslog, stderr, or csvlog, as long as the log lines themselves have enough information in the prefix.
Example log_line_prefix values:
If log_destination = ‘syslog’
log_line_prefix = 'user=%u,db=%d,app=%aclient=%h 'If log_destination = ‘stderr’
log_line_prefix = '%t [%p]: [%l-1] user=%u,db=%d,app=%a,client=%h 'Basic configuration settings to set in postgresql.conf:
log_checkpoints = on
log_connections = on
log_disconnections = on
log_lock_waits = on
log_temp_files = 0
log_autovacuum_min_duration = 0
log_error_verbosity = default
log_statement = off
lc_messages='C'

Log_min_duration_statement = (see below)
One of the more helpful parts of pgBadger’s reports is the slow query report, which relies on the database logging queries that exceed the log_min_duration_statement value. This value is represented in milliseconds, and any query that completes with a time greater than it will be logged, and then reports generated by pgBadger. This is helpful for finding and analyzing queries that take longer than desired.
While setting this value to 0 to log all queries would provide the most information, that can easily end up generating log files that are way too big, and impact performance of the database itself due to constant log writing. A more sane value won’t provide perfect query counts, but will still focus reports on slow running queries in general. If queries that run a couple of minutes are considered ‘slow’, setting the value to one minute would do well. If queries running for more than a few seconds is considered ‘slow’, then setting the value to something like 5 seconds would work well as well.
Generating Logs
Generating logs is done through the command line using the pgBadger executable. There are a host of options, but the most basic set up is to provide the log line prefix the database uses, the log file, and the output html file.
./pgbadger --prefix '%t [%p]: [%l-1] user=%u,db=%d,app=%a,client=%h ' postgresql.log -o postgresql.html
[========================>] Parsed 560607407 bytes of 560607407 (100.00%), queries: 2929645, events: 5
For more information about the different options for pgBadger, consult the documentation or execute the binary with the –help input parameter.
Advanced Log Generation
Since generating reports on logs is a simple command line execution, custom scripts and programs can be set up to generate reports automatically, staged on web servers, emailed, or archived in long term storage. Explore the different options available for report generation and get creative with automating systems for report generation and delivery.
Reviewing Logs
Reviewing the logs is where the fun comes in. The report that was generated can now be opened in a web browser and reviewed.
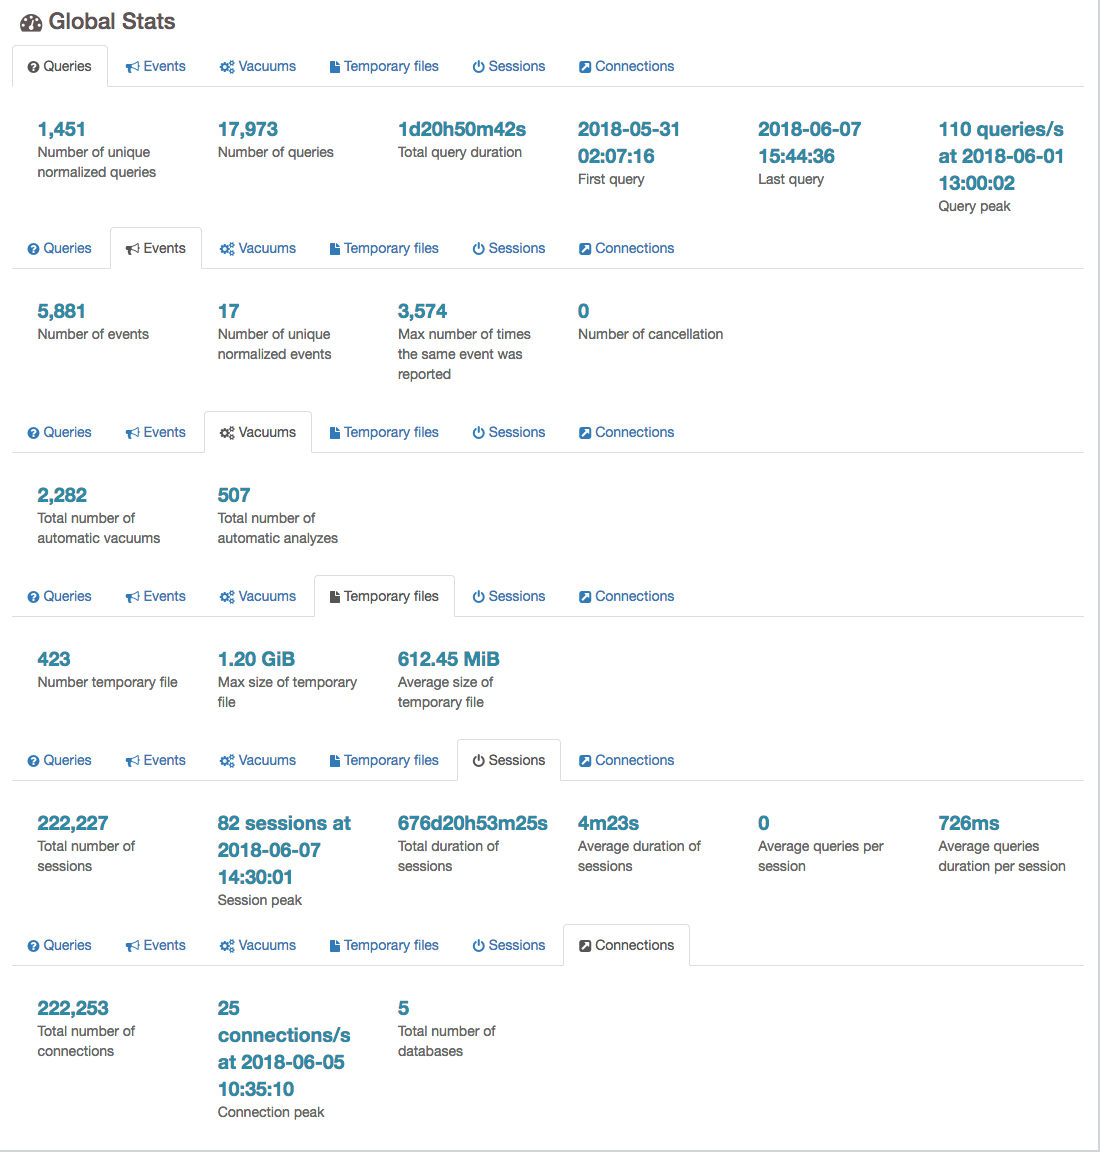
Global stats
The global stats section contains some basic information found in the PostgreSQL log, including:
- Queries: The number of queries found, duration, number of normalized queries, etc.
- Events: Total number of events, normalized events, etc.
- Vacuums: The total number of auto vacuums and auto analyzes found.
- Temporary Files: The total number of temporary files found, max size, and average size.
- Session: Total number of sessions, peak sessions time, total duration of sessions, average duration of sessions, average queries found per session, average queries duration per session.
- Connections: Total number of connections, peak connections, and total number of databases connected to.
Note: Results involving queries, query counts, or query duration will be inaccurate with values of log_min_duration_statement greater than 0.
Example:
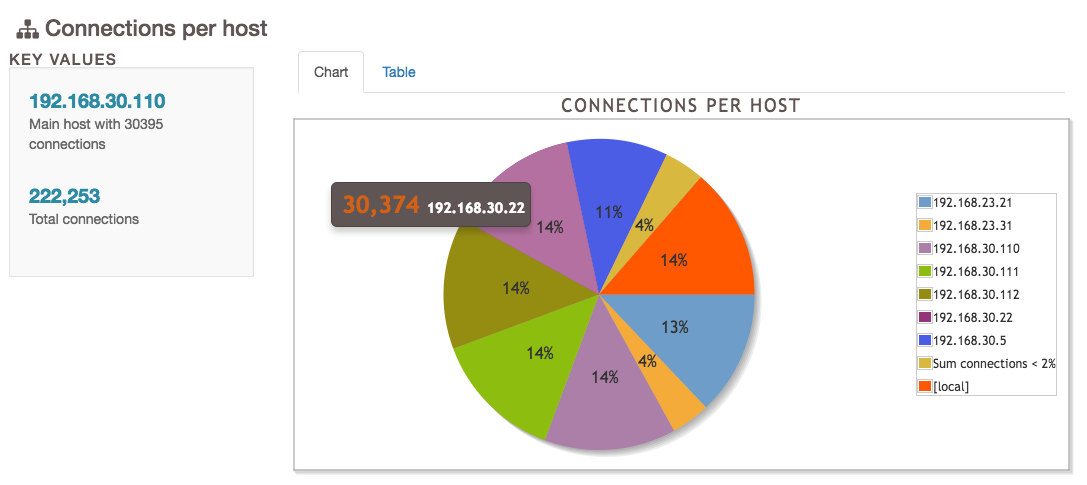
Connections
The connections page shows graphs detailing the connection information found in the logs. As long as log_connections and log_disconnections are both on, the values here will be accurate. Available charts are:
- Established connections: Showing maximum, minimum, and average number of connections over time.
- Connections per database: A pie chart and table view showing the number of connections for each database found.
- Connections per user: A pie chart and table view showing the number of connections for each user found.
- Connections per host: A pie chart and table view showing the number of connections for each source host found.
Example:
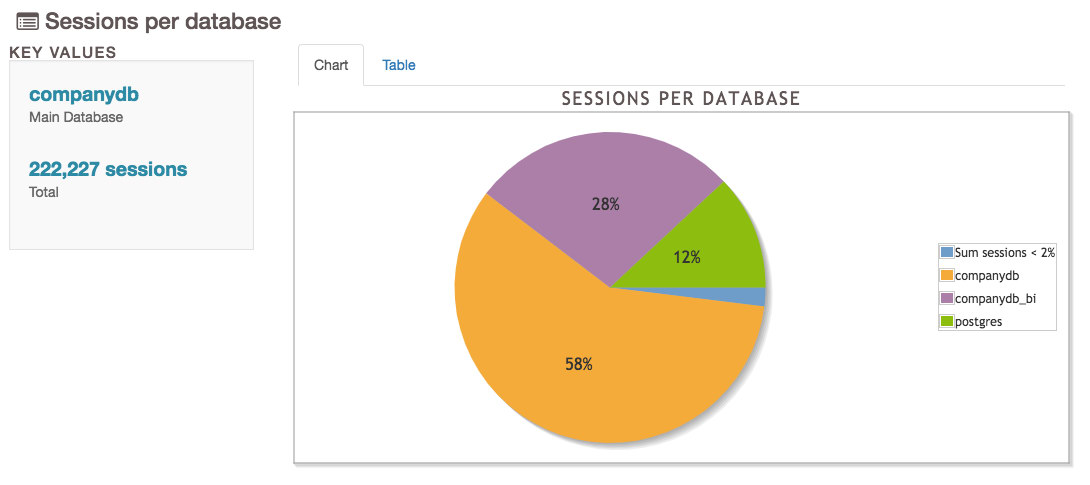
Sessions
The sessions page is similar to the connections page, but contains some more information pertaining to sessions themselves.
- Simultaneous Sessions: A line chart showing the number of sessions over time.
- Histogram of Session Times: A bar chart and table showing session times.
- Sessions per database: A pie chart and table view showing the number of sessions for each database found.
- Sessions per user: A pie chart and table view showing the number of sessions for each user found.
- Sessions per host: A pie chart and table view showing the number of sessions for each source host found.
- Sessions per Application: The number of sessions connected per application.
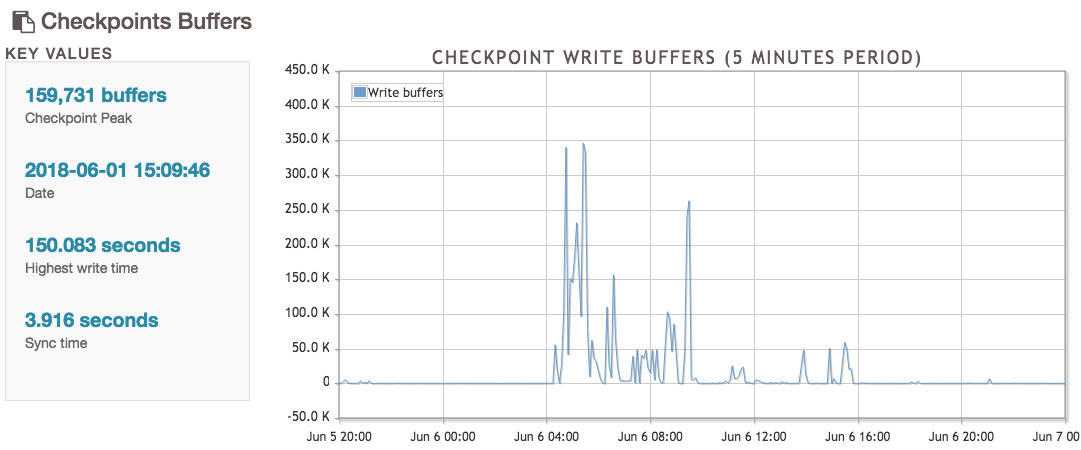
Checkpoints
The checkpoints page provides information on the checkpointer process, including the number of buffers written, WAL files, and other general information.
- Checkpoint Buffers: A line chart showing the amount of buffers written by the checkpoint process over time.
- Checkpoints WAL Files: A line chart showing the number of WAL files added, removed, or recycled by the checkpointer over time.
- Checkpoint Distance: A line chart showing the distance and estimate for checkpoints.
- Checkpoints Activity: A table showing the previous four data points in table form.
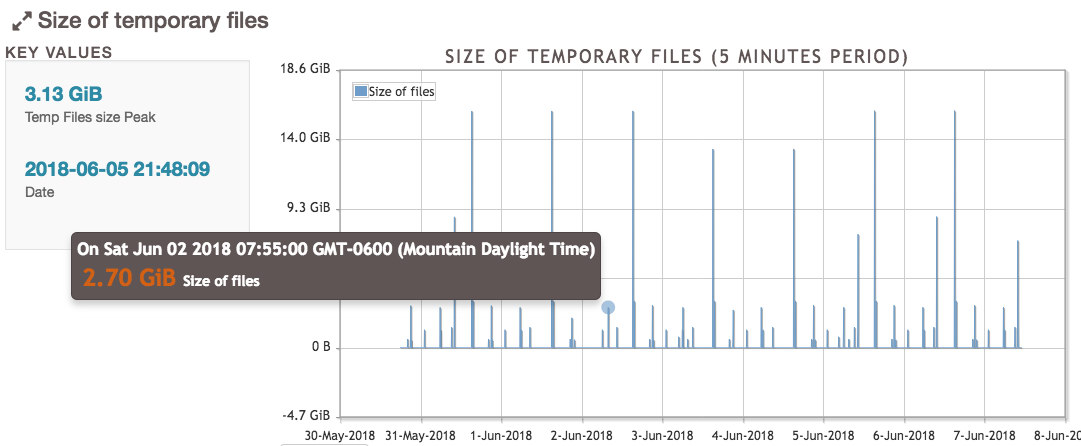
Temp Files
The temp files page contains information for temporary files, which are created when a query runs out of work_mem and needs to use the disk to sort or filter results before returning them to the applications. These files are deleted automatically when the query completes, and knowing the temp file activity helps the administrator tune the work_mem parameter.
- Size of temporary files: A line chart showing the space used by temporary files over time.
- Number of temporary files: A line chart showing the number of temporary files used over time.
- Temporary Files Activity: A table showing the information provided in the previous charts but in table form.
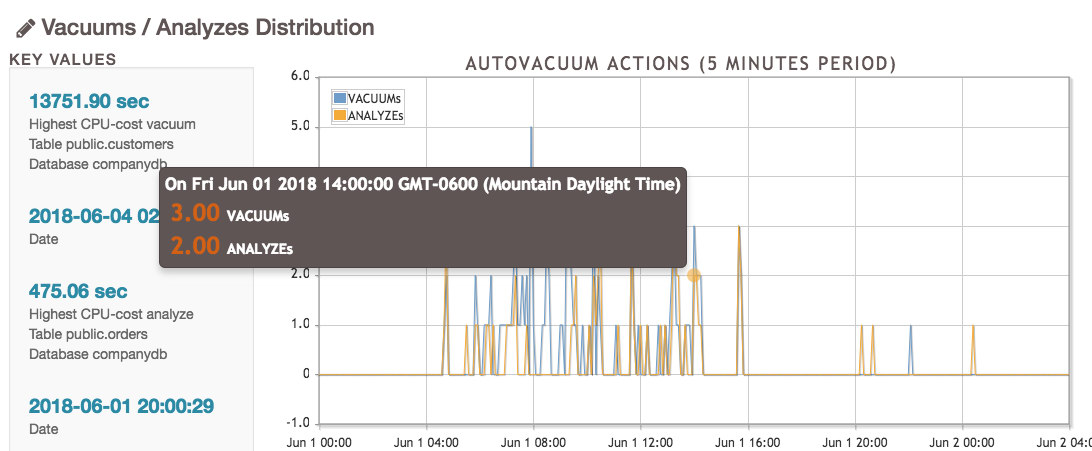
Vacuums
This page shows information on VACUUMs and ANALYZEs occurring in the database. This information is useful to know whether or not the autovacuum process is doing its job well enough, or if it’s bogged down and needs more resources.
- Vacuums / Analyzes Distribution: A line chart showing VACUUMs and ANALYZEs over time, as well as information on the table that consumed the most CPU processing power.
- Analyzes per table: A pie chart and table showing the tables with the most analyzes, suggesting these tables are in a high state of change.
- Vacuums per table: A pie chart and table showing the tables with the most vacuums, suggesting these tables are in a high state of change.
- Tuples removed per table: A pie chart and table showing the number of tuples and pages removed in vacuum processes for tables.
- Pages removed per table: A pie chart and table showing the number of pages and tuples removed in vacuum processes for tables.
- Autovacuum activity: A table showing the VACUUMs and ANALYZEs over time per hour.
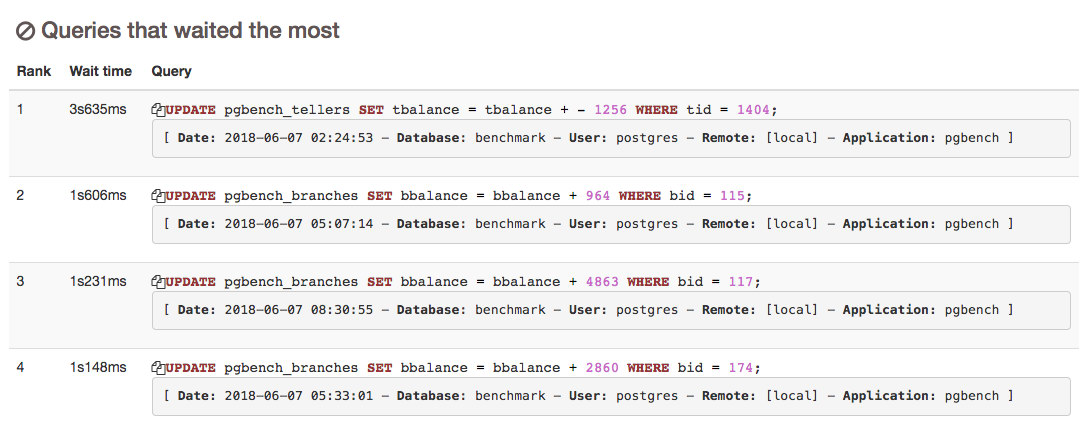
Locks
The locks page contains just a few pieces of data, but it’s useful information to know when there are processes that may be holding up other queries for extended periods of time.
- Locks by types
- Most frequent waiting queries: A list of queries found to be waiting, ranked most frequent to least.
- Queries that waited the most: A list of queries and how long they waited, ordered from longest to shortest.
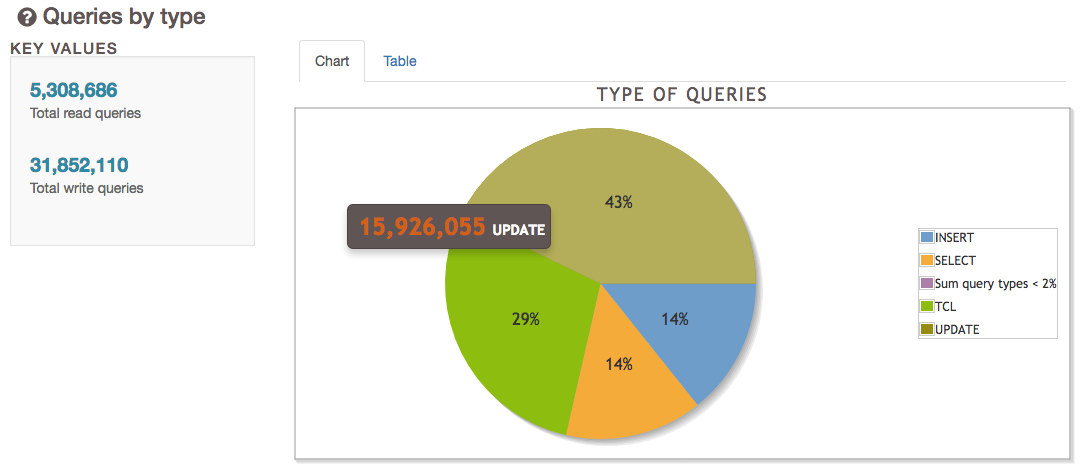
Queries
The Queries page is sometimes the most exciting, as it shows information on the types of queries that come from the applications and users. This information can help understand more of what kind of database churn an application or user puts on the database system, which can help future tuning. Like before, the accuracy of these numbers depends on the value of log_min_duration_statement, as any value above 0 won’t log queries.
- Queries by type: A pie chart and table showing the number of different types of queries, such as INSERT, UPDATE, DELETE, SELECT, etc.
- Queries by database: A pie chart and table showing the number of queries found per database.
- Queries by application: A pie chart and table showing the number of queries found per application.
- Number of cancelled queries: Information on any queries that were canceled.
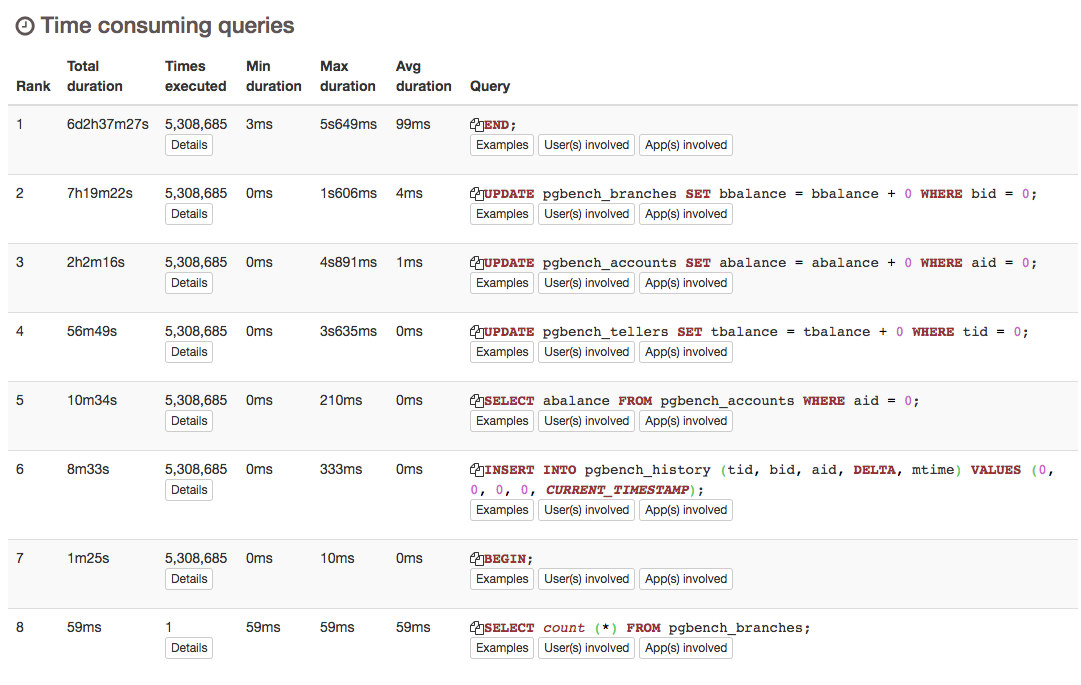
Top
The top page has information on query times, slowest queries overall, query frequency and more. Specific problematic queries are likely to be found here:
- Histogram of query times: A histogram representing how many queries fall into each grouping of timings.
- Slowest individual queries: A list of the slowest queries found, ordered by longest to shortest.
- Time consuming queries: A list of normalized queries and their total duration, ordered by greatest time consumed to least.
- Most frequent queries: A list of normalized queries and how many times they were executed, ordered from most to least.
- Normalized slowest queries: A list of normalized queries and their average duration, ordered by longest to shortest.
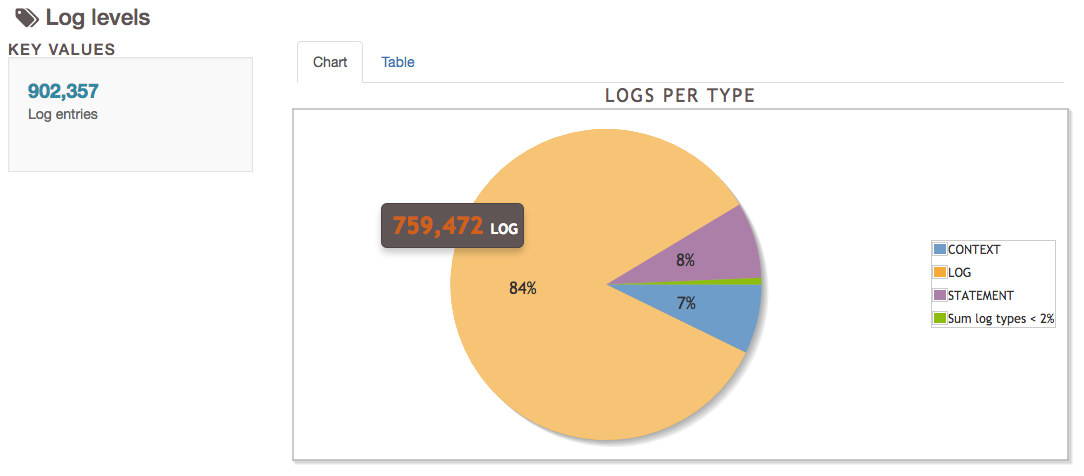
Events
The final page is events, which has information on the logs themselves, and anything that isn’t a query, vacuum, or checkpoint.
- Log levels: The different levels of logs appeared by line, such as CONTEXT, LOG, STATEMENT, HINTs, WARNINGs, and others.
- Events distribution: A line graph of events over time for PANIC, FATAL, ERROR, and WARNING events.
- Most Frequent Errors/Events: A list of EVENTS and their frequency, ordered from most common to least.
Contribute
The pgBadger project is free and exists under the PostgreSQL Licence. It’s currently well maintained and updated to work with newer versions of PostgreSQL as it’s developed. Have ideas to improve pgBadger? Fork the project and show the community your improvements.
To submit bugs, visit the github issues page.


