blog
A New Way to Personalize Your PostgreSQL Monitoring with Prometheus

Monitoring is one of the fundamental tasks in any system. It can help us to detect problems and take action, or simply to know the current state of our systems. Using visual displays can make us more effective as we can easier detect performance problems.
In this blog, we will see how to use SCUMM to monitor our PostgreSQL databases and what metrics we can use for this task. We’ll also go through the dashboards available, so you can easily figure out what’s really happening with your PostgreSQL instances.
What is SCUMM?
First of all, let’s see what is SCUMM (Severalnines ClusterControl Unified Monitoring and Management ).
It’s a new agent-based solution with agents installed on the database nodes.
The SCUMM Agents are Prometheus exporters which export metrics from services like PostgreSQL as Prometheus metrics.
A Prometheus server is used to scrape and store time series data from the SCUMM Agents.
Prometheus is an open-source system monitoring and alerting toolkit originally built at SoundCloud. It is now a standalone open source project and maintained independently.
Prometheus is designed for reliability, to be the system you go to during an outage to allow you to quickly diagnose problems.
How to use SCUMM?
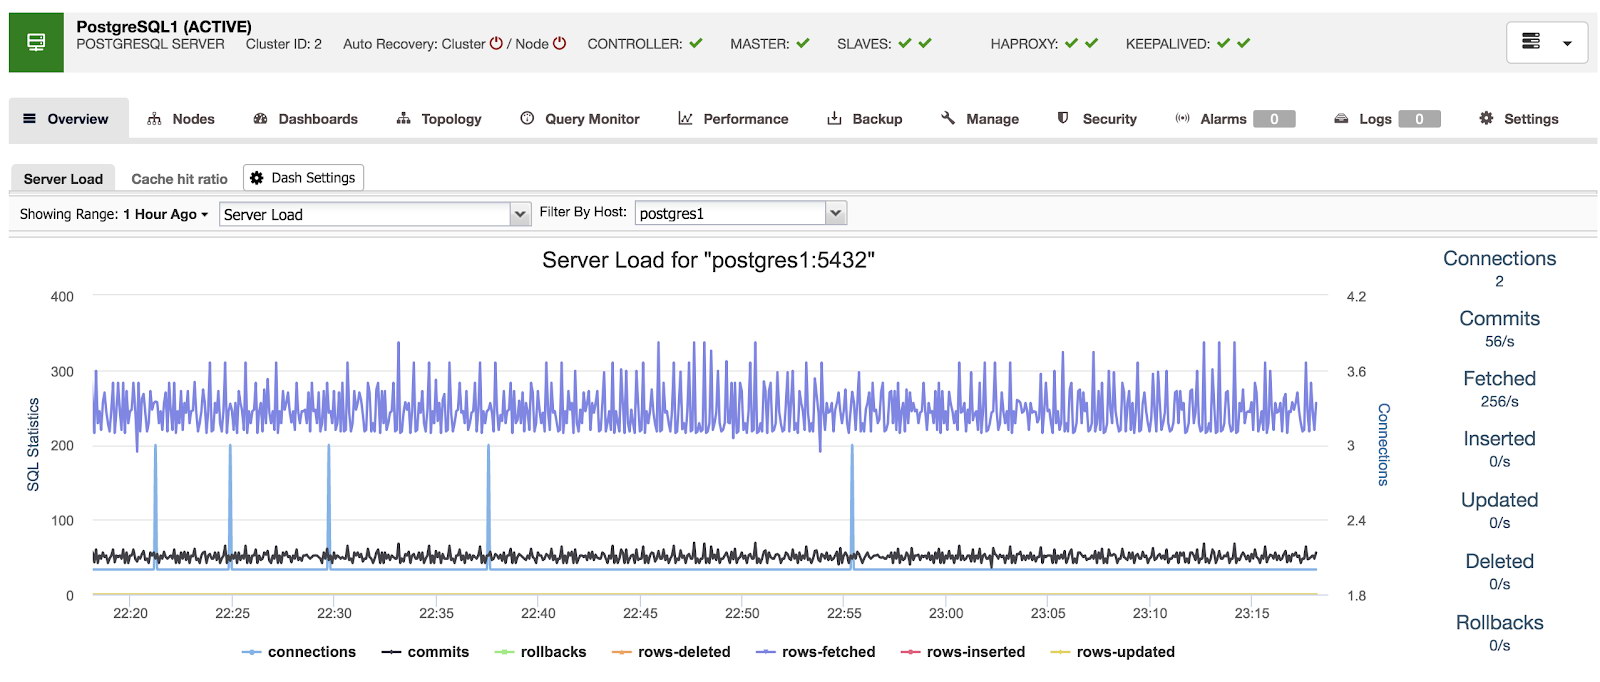
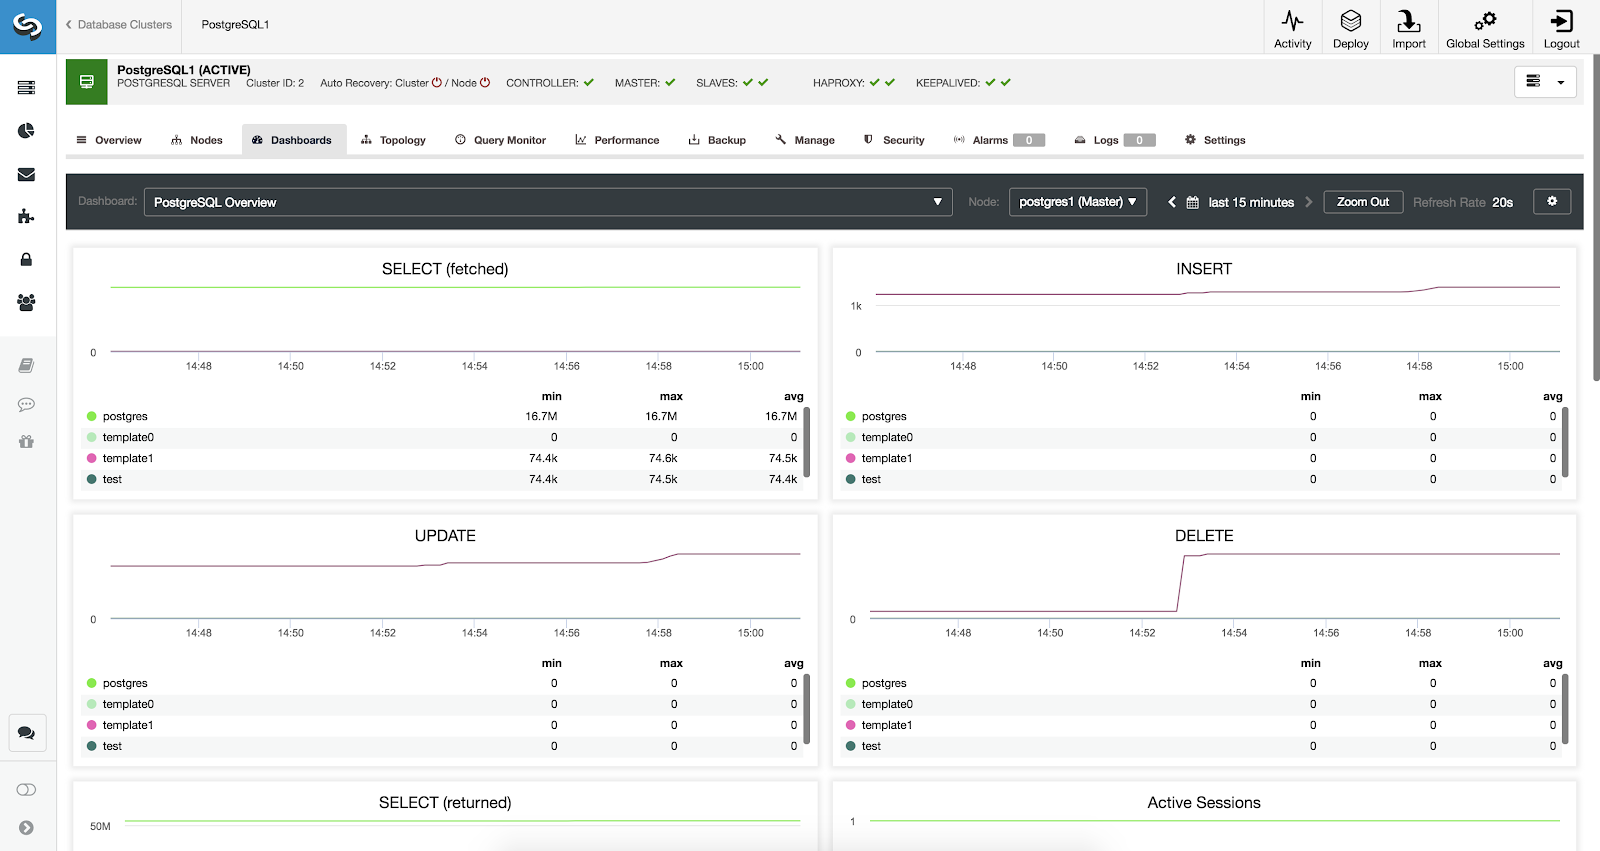
When using ClusterControl, when we select a cluster, we can see an overview of our databases, as well as some basic metrics that can be used to identify a problem. In the below dashboard, we can see a master-slave setup with one master and 2 slaves, with HAProxy and Keepalived.
If we go to the “Dashboards” option, we can see a message like the following.
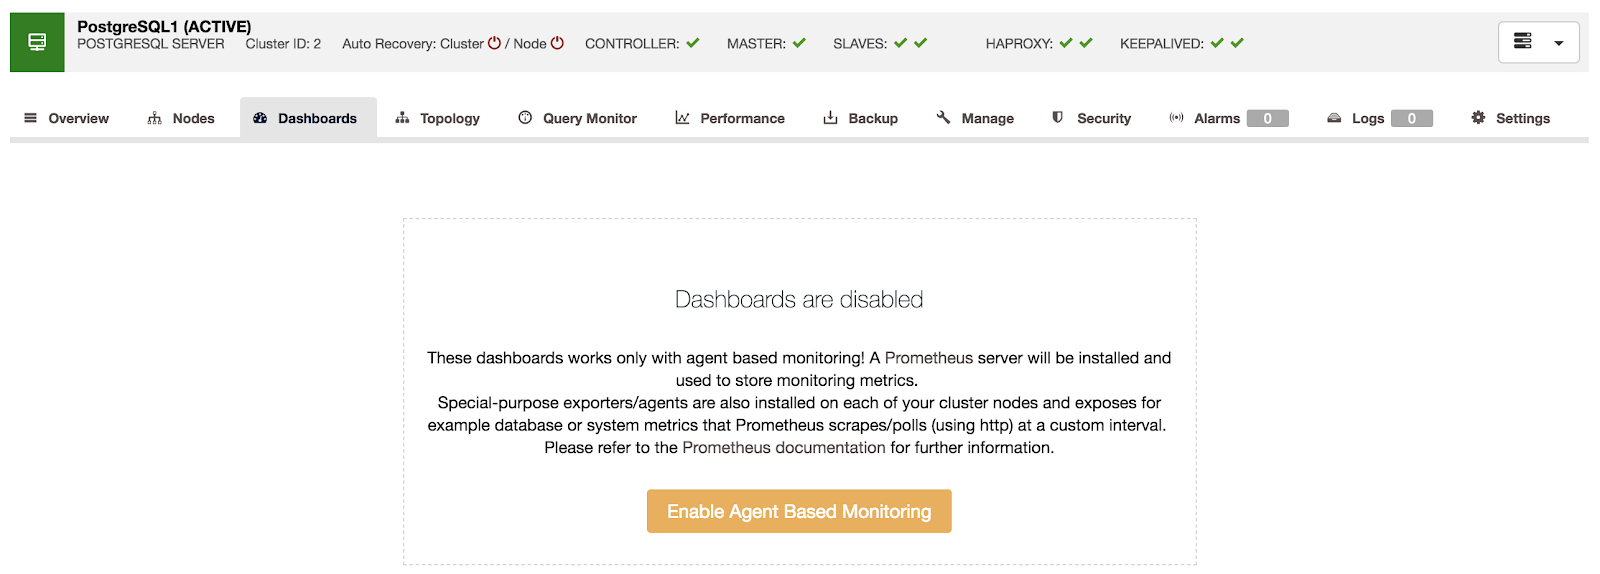
To use this feature, we must enable the agent mentioned above. For this, we only have to press on the “Enable Agent Based Monitoring” button in this section.
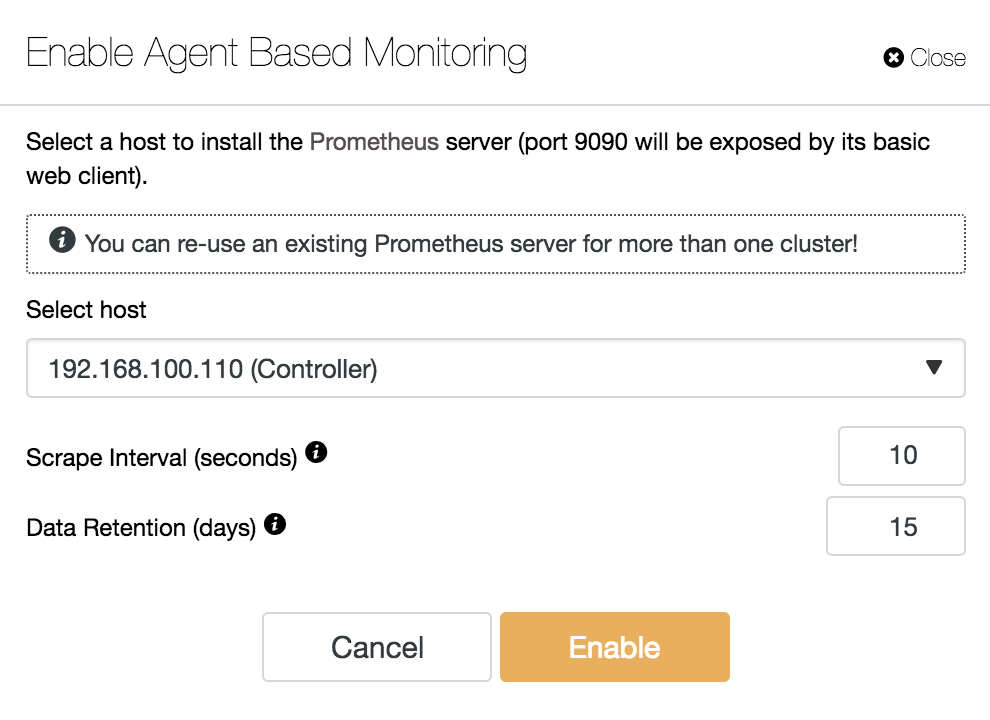
To enable our agent, we must specify the host where we will install our Prometheus server, which, as we can see in the example, can be our ClusterControl server.
We must also specify:
- Scrape Interval (seconds): Set how often the nodes are scraped for metrics. Default is 10 seconds.
- Data Retention (days): Set how long the metrics are kept before being removed. Default is 15 days.
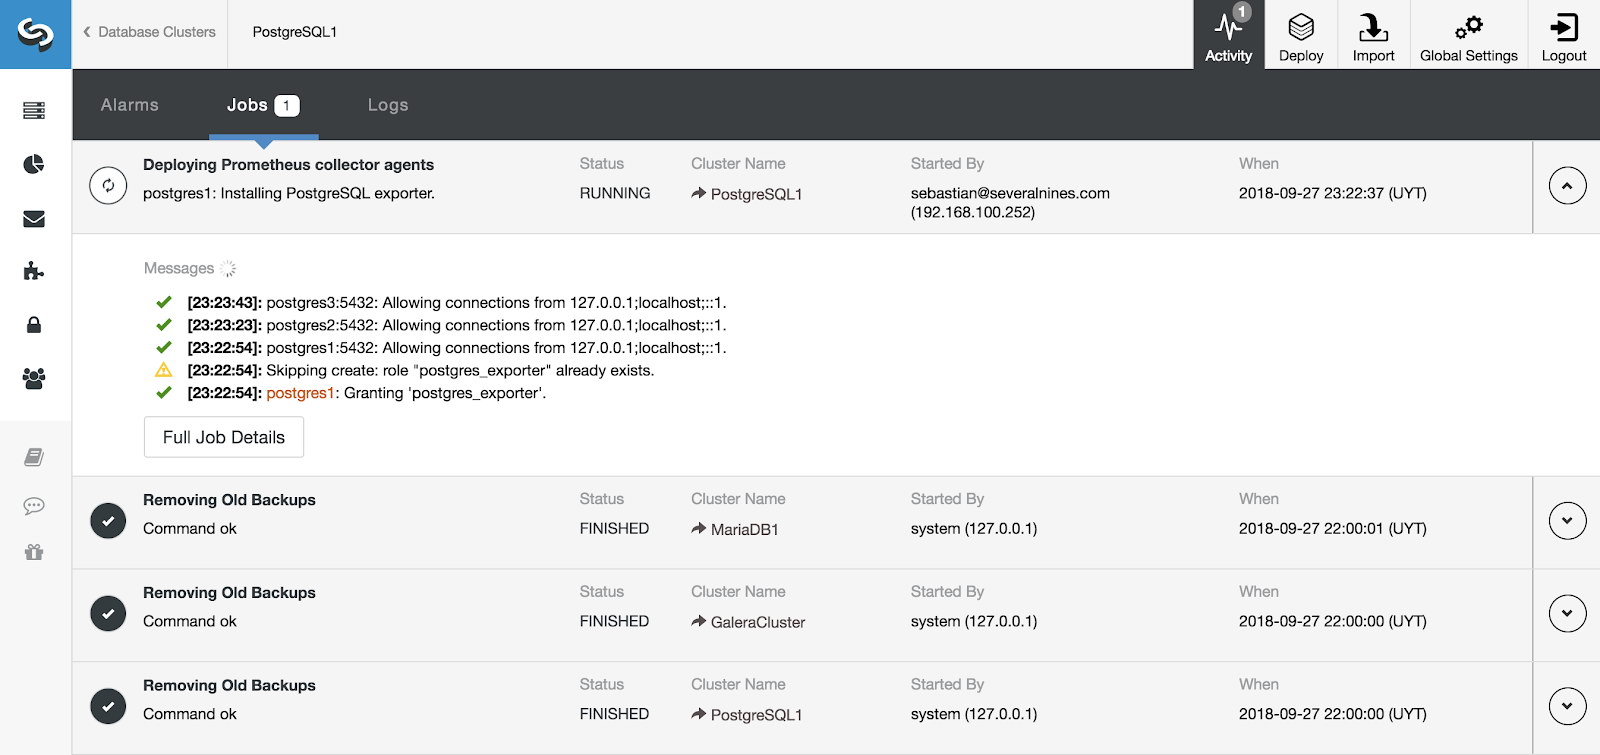
We can monitor the installation of our server and agents from the Activity section in ClusterControl and, once it is finished, we can see our cluster with the agents enabled from the main ClusterControl screen.

Dashboards
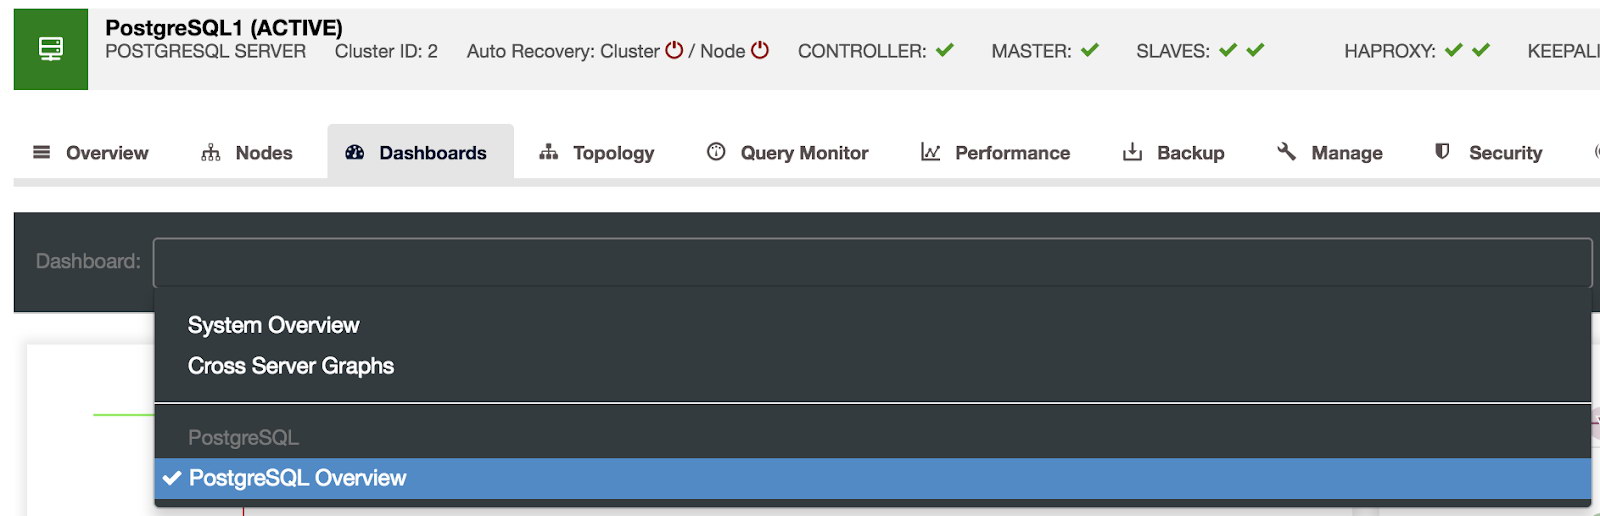
Having our agents enabled, if we go to the Dashboards section, we would see something like this:
We have three different kinds of dashboards available, System Overview, Cross Server Graphs, and PostgreSQL Overview. The last one is what we see by default when entering this section.
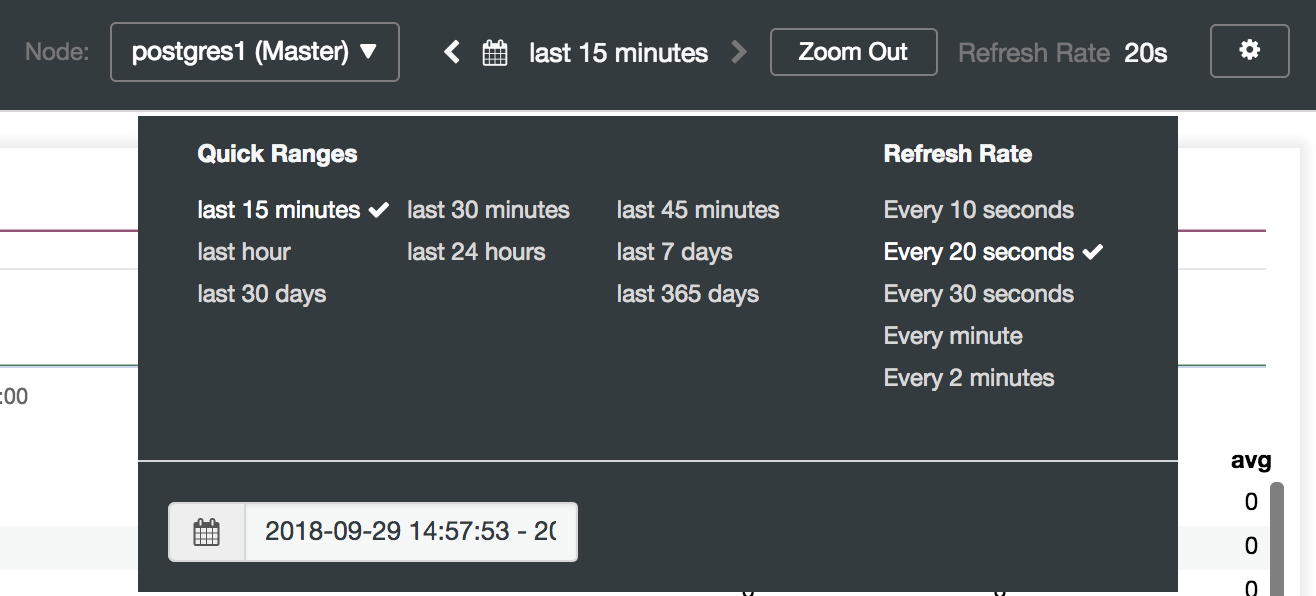
Here we can also specify which node to monitor, the time range and the refresh rate.
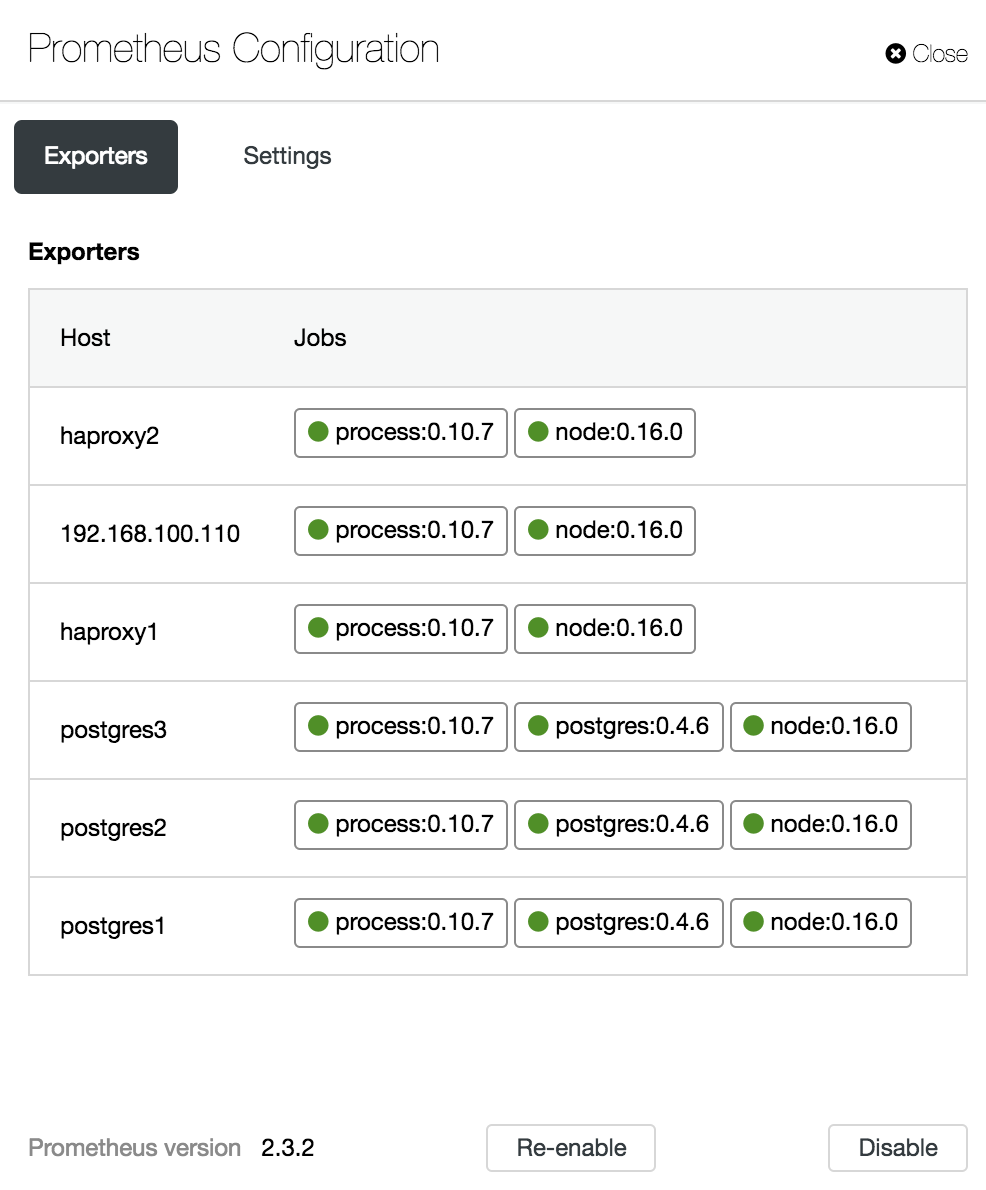
In the configuration section, we can enable or disable our agents (Exporters), check the agents status and verify the version of our Prometheus server.
PostgreSQL Overview Metrics
Let’s see now what metrics we have available for each of our PostgreSQL databases (all of them for the selected node).
- SELECT (fetched): Amount of rows selected (fetched) for each database. The fetched rows refer to live rows fetched from the table.
- SELECT (returned): Amount of rows selected (returned) for each database. The returned rows refer to all rows read from the table, which includes dead rows and not–yet committed rows (in contrast with the fetched rows that counts only the live tuples).
- INSERT: Amount of rows inserted for each database.
- UPDATE: Amount of rows updated for each database.
- DELETE: Amount of rows deleted for each database.
- Active Sessions: Amount of active sessions (min, max, and average) for each database.
- Idle Sessions: Amount of idle sessions (min, max, and average) for each database.
- Lock Tables: Amount of locks (min, max, and average) separated by type for each database.
- Disk IO Utilization: Server disk IO utilization.
- Disk Usage: Percentage server disk usage (min, max and average).
- Disk Latency: Server disk latency.
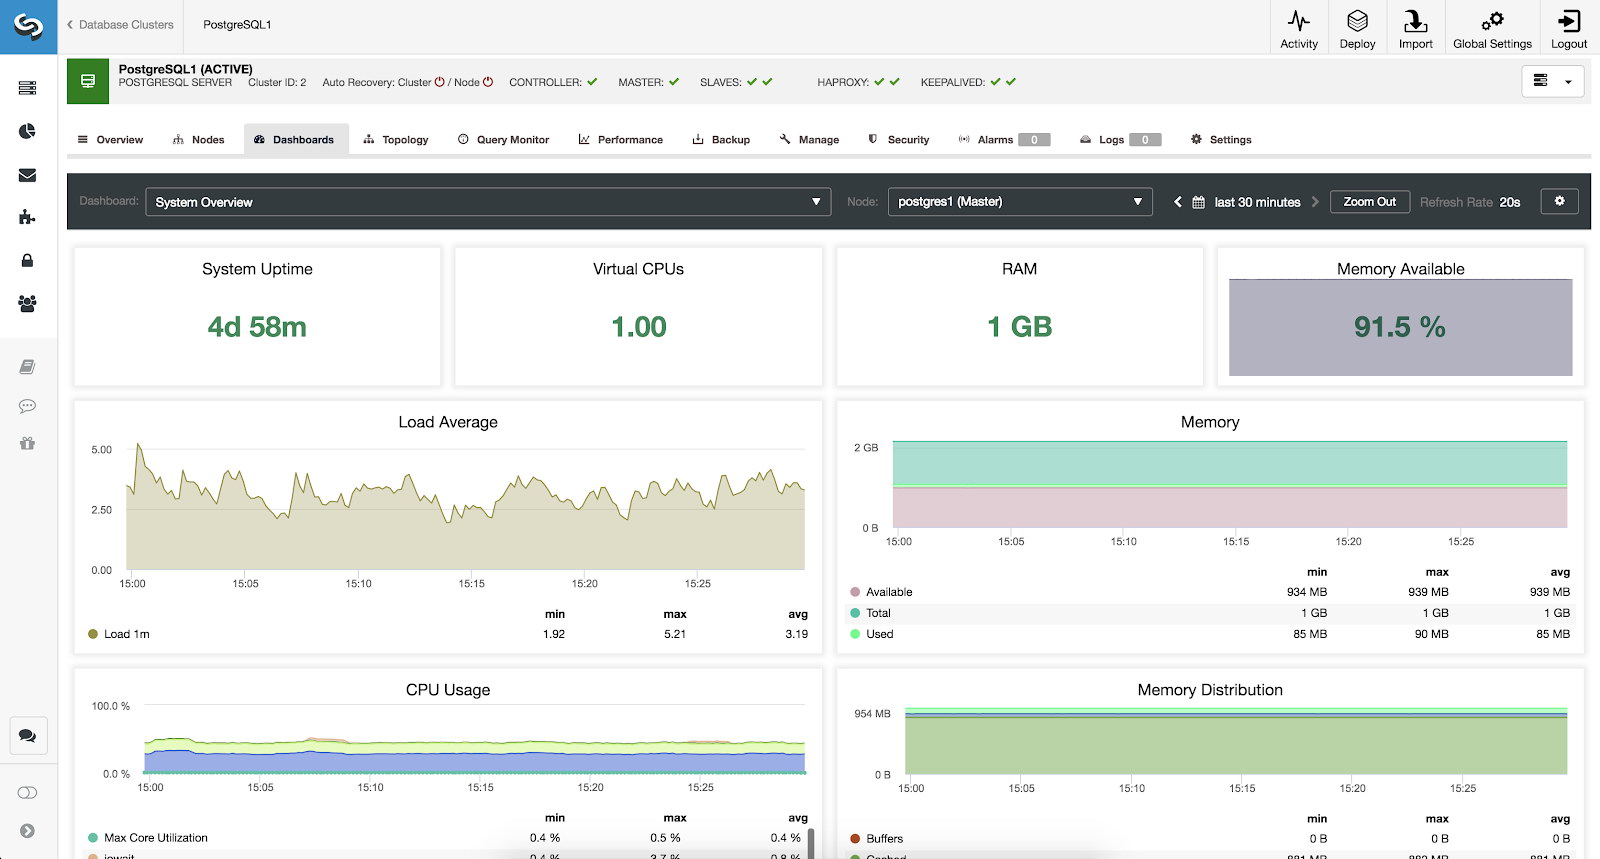
System Overview Metrics
To monitor our system, we have available for each server the following metrics (all of them for the selected node):
- System Uptime: Time since the server is up.
- CPUs: Amount of CPUs.
- RAM: Amount of RAM memory.
- Memory Available: Percentage of RAM memory available.
- Load Average: Min, max and average server load.
- Memory: Available, total and used server memory.
- CPU Usage: Min, max and average server CPU usage information.
- Memory Distribution: Memory distribution (buffer, cache, free and used) on the selected node.
- Saturation Metrics: Min, max, and average of IO load and CPU load on the selected node.
- Memory Advanced Details: Memory usage details like pages, buffer and more, on the selected node.
- Forks: Amount of forks processes. Fork is an operation whereby a process creates a copy of itself. It is usually a system call, implemented in the kernel.
- Processes: Amount of processes running or waiting on the Operating System.
- Context Switches: A context switch is the action of storing the state of a process or of a thread.
- Interrupts: Amount of interrupts. An interrupt is an event that alters the normal execution flow of a program and can be generated by hardware devices or even by the CPU itself.
- Network Traffic: Inbound and outbound network traffic in KBytes per second on the selected node.
- Network Utilization Hourly: Traffic sent and received in the last day.
- Swap: Swap usage (free and used) on the selected node.
- Swap Activity: Reads and writes data on swap.
- I/O Activity: Page in and page out on IO.
- File Descriptors: Allocated and limit file descriptors.
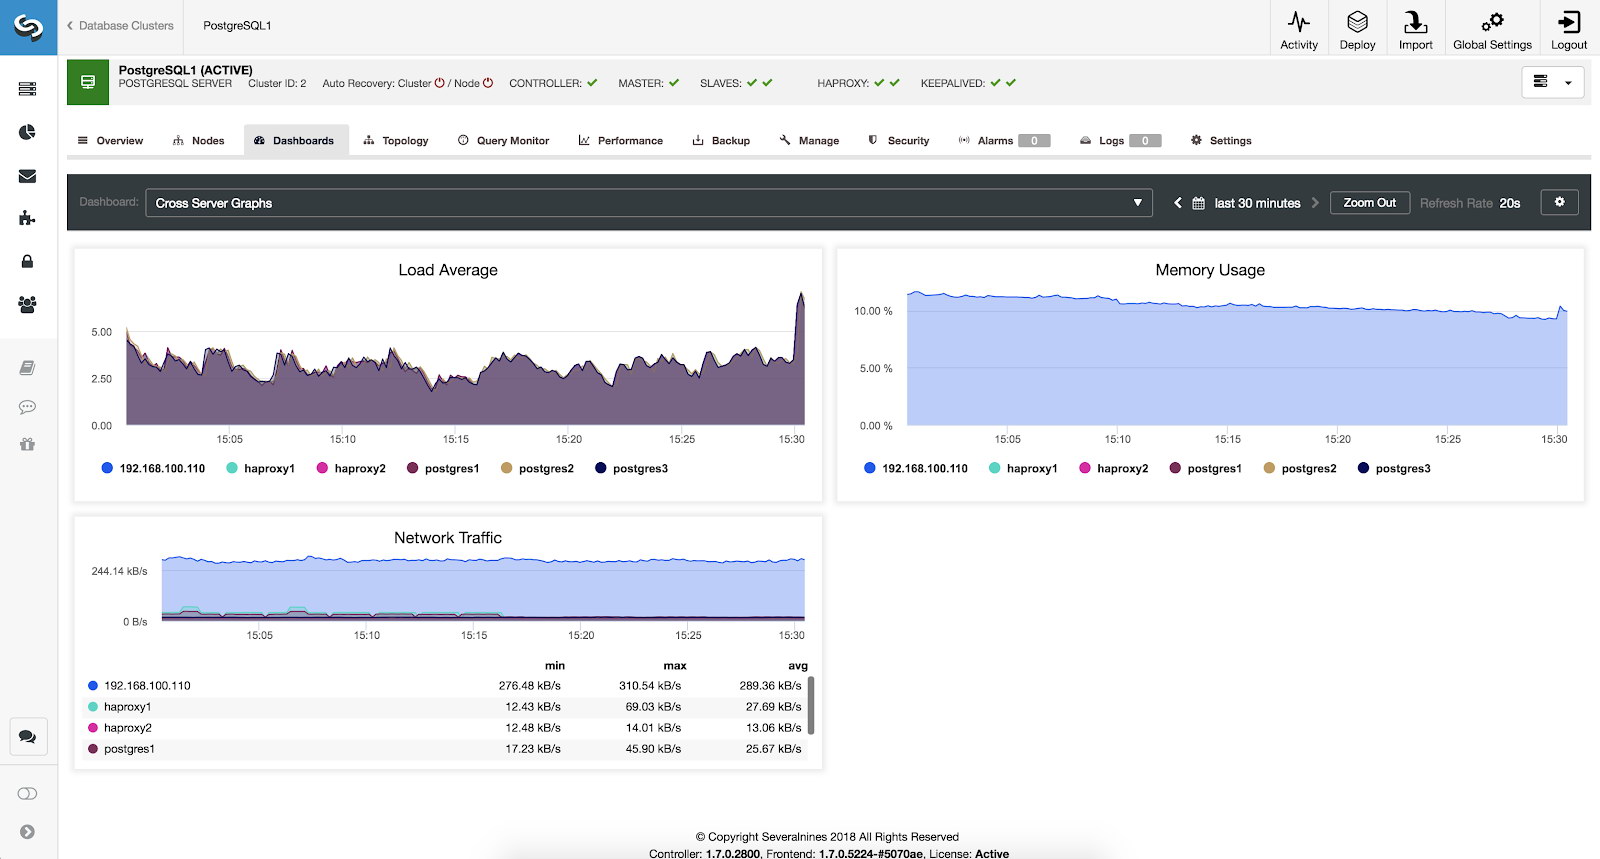
Cross Server Graphs Metrics
If we want to see the general state of all our servers we can use this dashboard with the following metrics:
- Load Average: Servers load average for each server.
- Memory Usage: Percentage of memory usage for each server.
- Network Traffic: Min, max and average kBytes of network traffic per second.
Conclusion
There are multiple ways to monitor PostgreSQL. ClusterControl provides both agentless and now agent-based monitoring through Prometheus. It provides higher resolution monitoring data, as well as different dashboards to understand database performance. ClusterControl can also integrate with external tools like Slack or PagerDuty for alerting.


