blog
Monitoring Your Databases with MySQL Enterprise Monitor

How to Monitor MySQL Databases?
Operational visibility is a must in any production environment. It is crucial to be able to identify any issues as soon as possible, otherwise you may end up in serious troubles as an undetected issue can cause serious service disruption or downtime. MySQL Enterprise Monitor is one of the oldest monitoring products for MySQL on the market, and is available as part of an commercial enterprise subscription agreement from Oracle.In this blog post we will take a look at MySQL Enterprise Monitor and the kind of insight it provides into MySQL.
Installation
First of all, MySQL Enterprise Monitor is part of MySQL Enterprise Edition, a commercial offering from Oracle. It comes in multiple versions of packages, for different operating systems. The installation on Windows 10 (the system we tested on) is pretty much straightforward. MySQL Enterprise Monitor is configured and some bundled services will be installed (MySQL, Tomcat). The tool can be accessed via the browser.
Initial Configuration
First of all, you have to add hosts you would like to monitor.
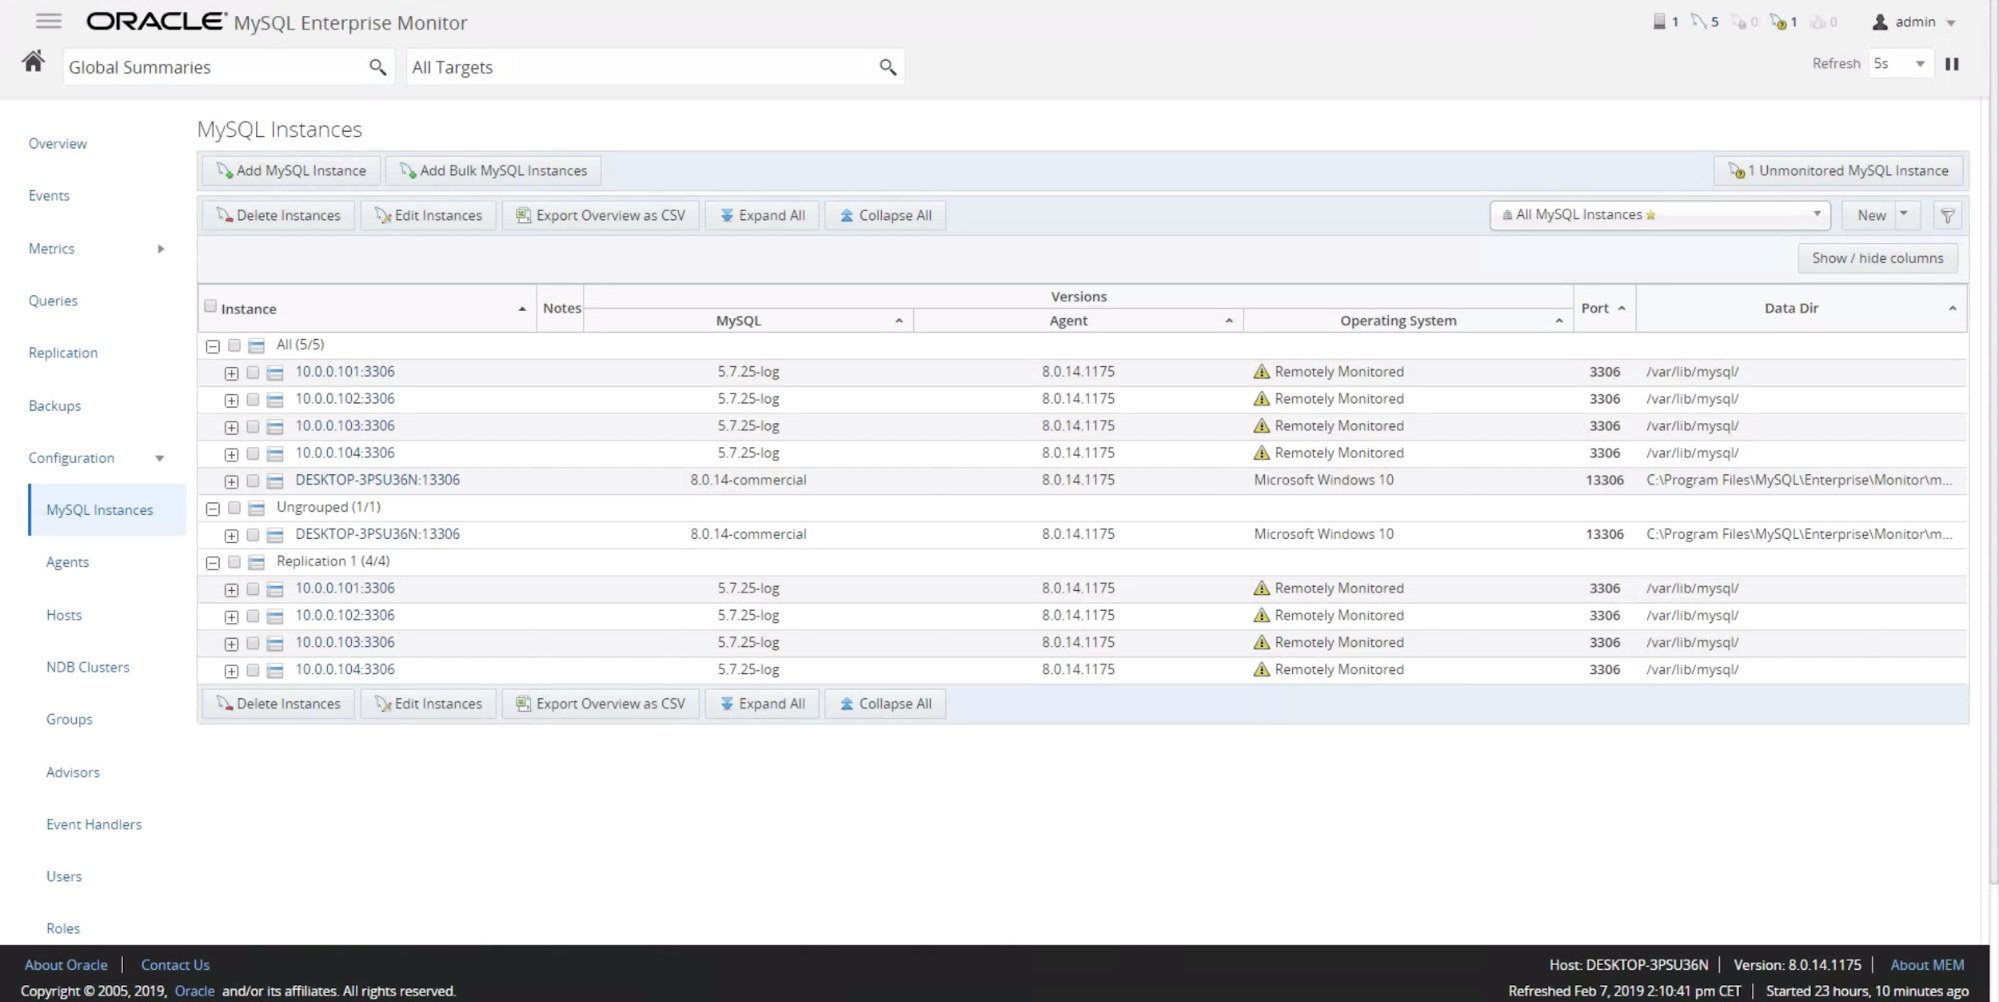
You can either add single hosts or a batch of them. The dialog window looks the same except that when adding in bulk, you can pass a comma-separated list of servers.
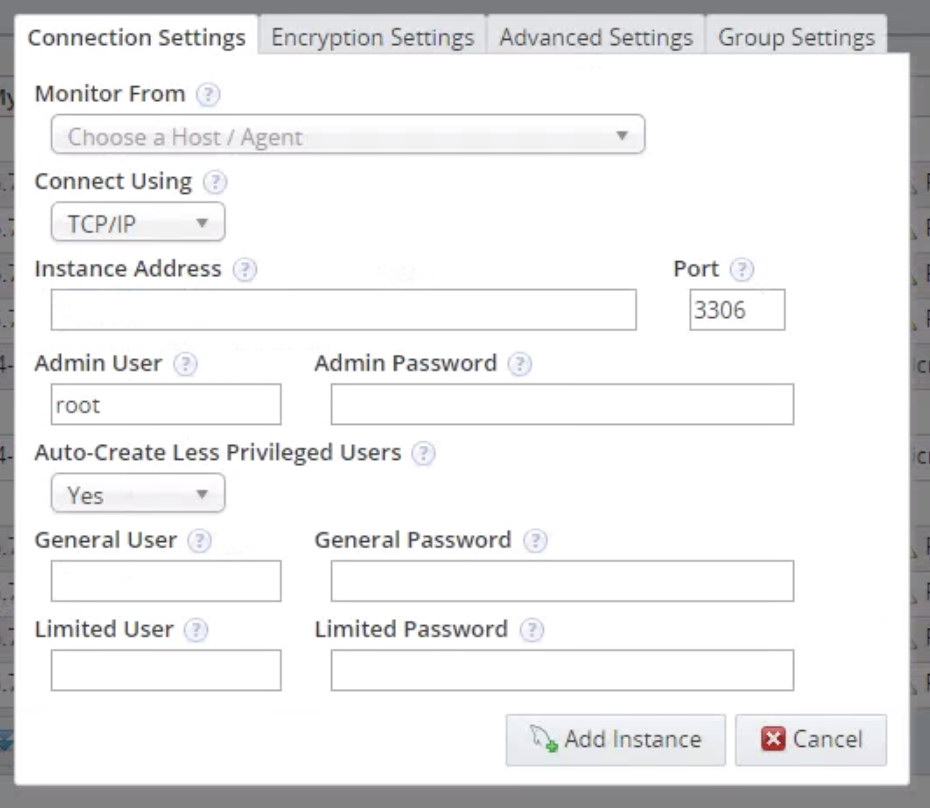
We won’t go into details, but in short you have to define from which host the MySQL instances should be monitored – typically it will be the host on which you installed MySQL Enterprise Monitor. You can also setup agents on your MySQL instances, in that case they will be able to collect data for the host as well, not only MySQL metrics. Then you need to define how to reach the monitored instance (IP address/hostname, user and password). MySQL Enterprise Monitor will then create additional users for tasks like monitoring, which does not require superuser privileges. If you want, you can also configure SSL communication if that’s what the MySQL instance uses, you can also define some timeouts and if a replication topology should be auto-detected or not.
What is also important to keep in mind is that MySQL Enterprise Monitor relies heavily on Performance Schema – make sure your databases have PS enabled, otherwise you will not benefit from a significant part of the features of MySQL Enterprise Monitor.
Monitoring
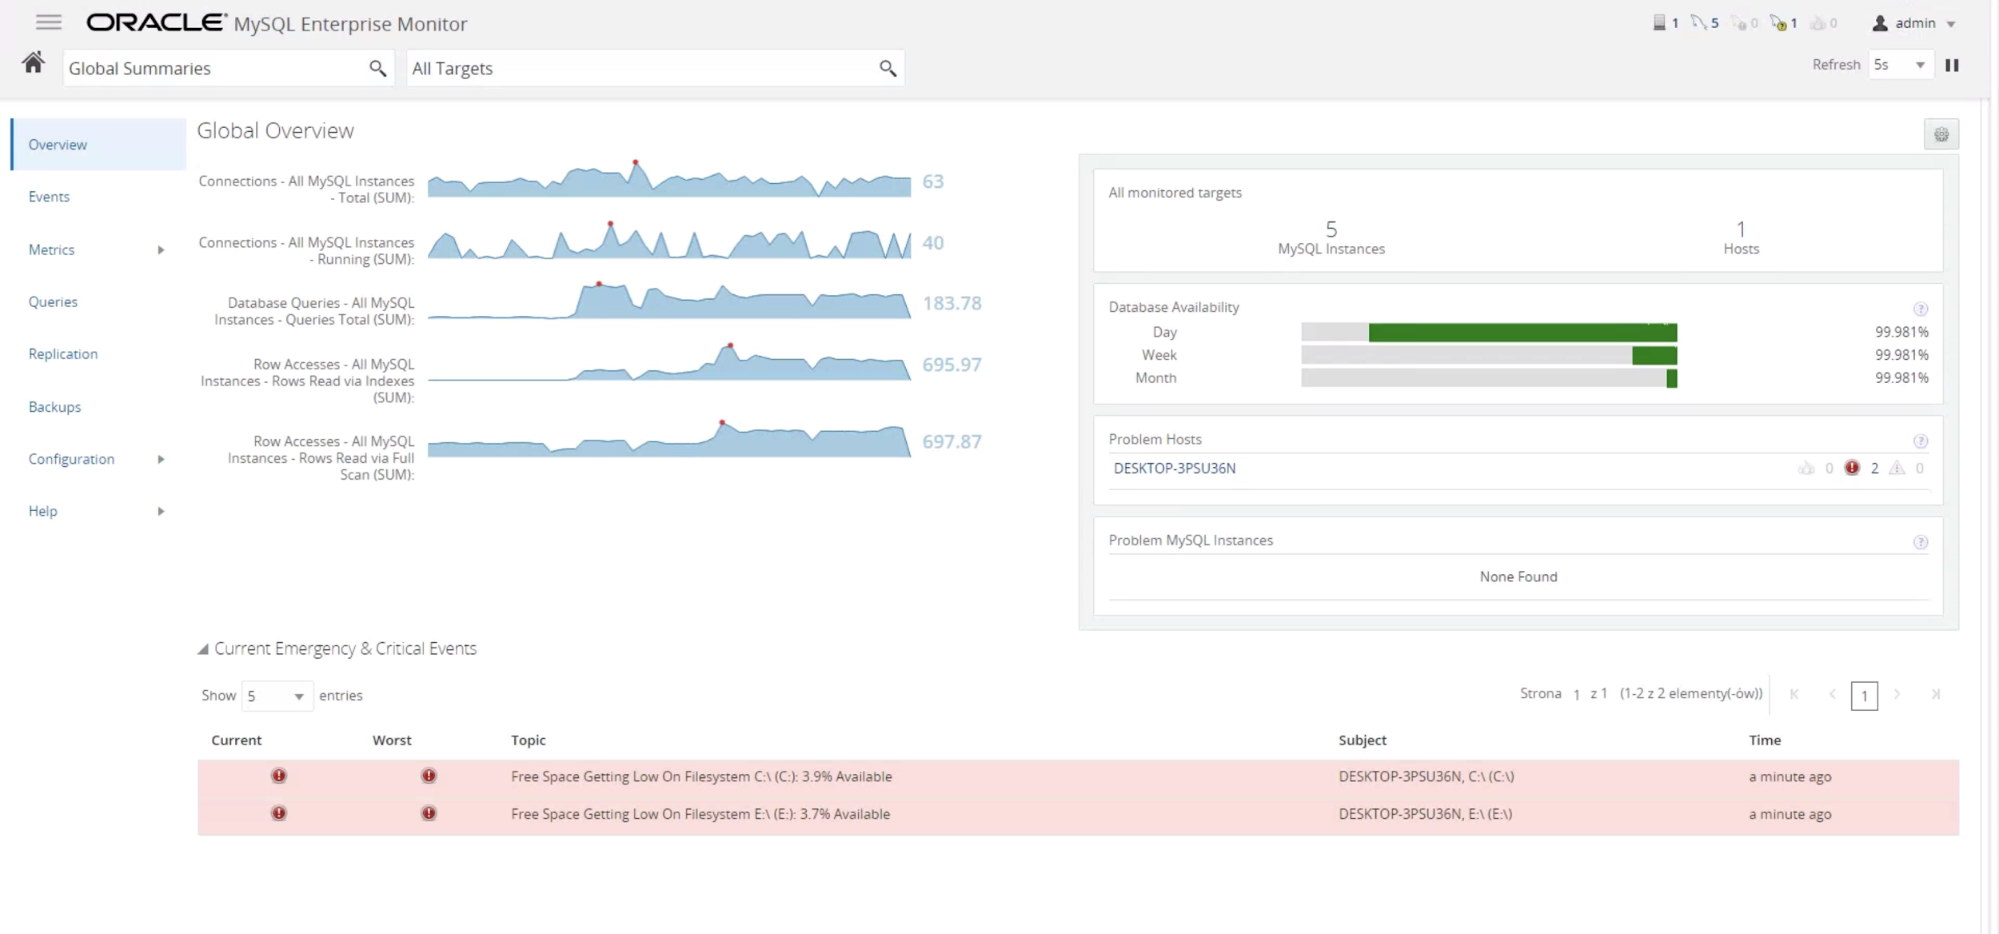
Once the monitored MySQL instances are configured, you can start to look at the collected data. The Overview section gives you a short summary of some of the most important metrics in MySQL. Data is aggregated and it makes it easier to find any unexpected patterns and then dig further into what happened.

Events tab gives an overview of different issues or events reported by the MySQL Enterprise Monitor and its advisors. You can click at any of the events and read what it is all about, as well as any recommended steps to take:
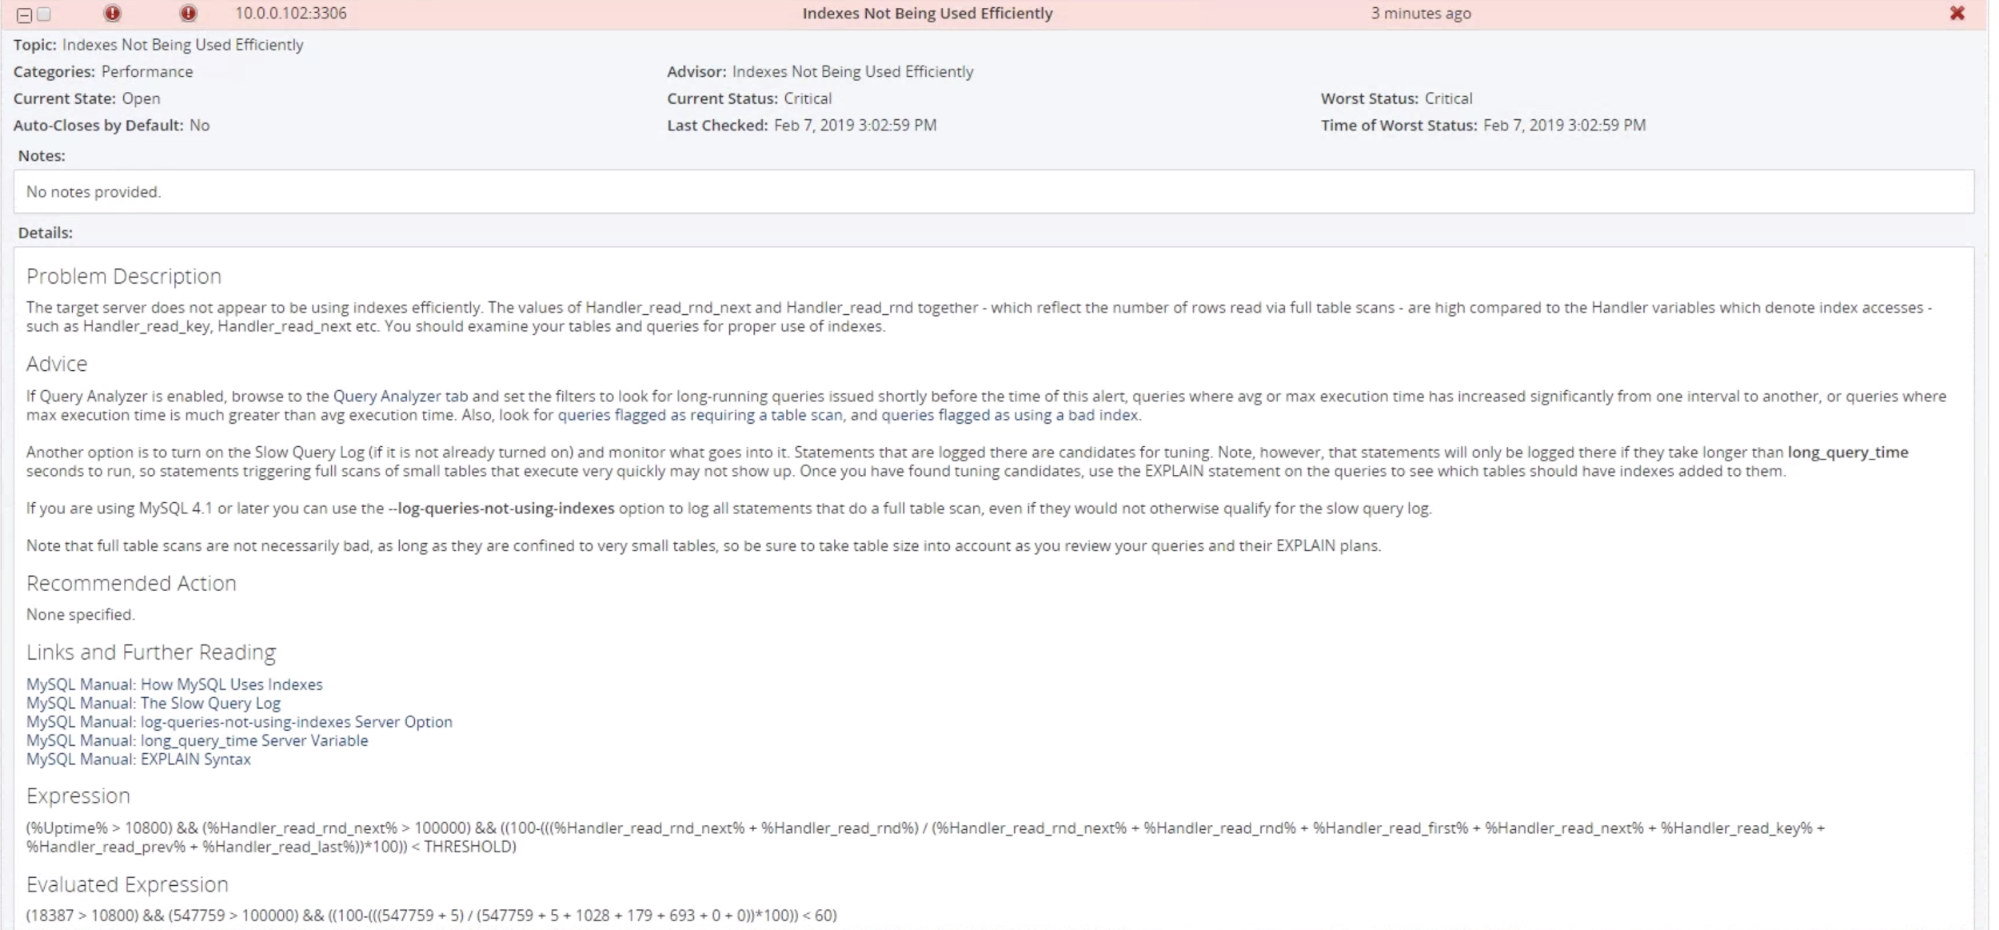
In this particular case it seems like some queries are doing full table scans and it is recommended to investigate it further to pinpoint such queries and see if they can be optimized.
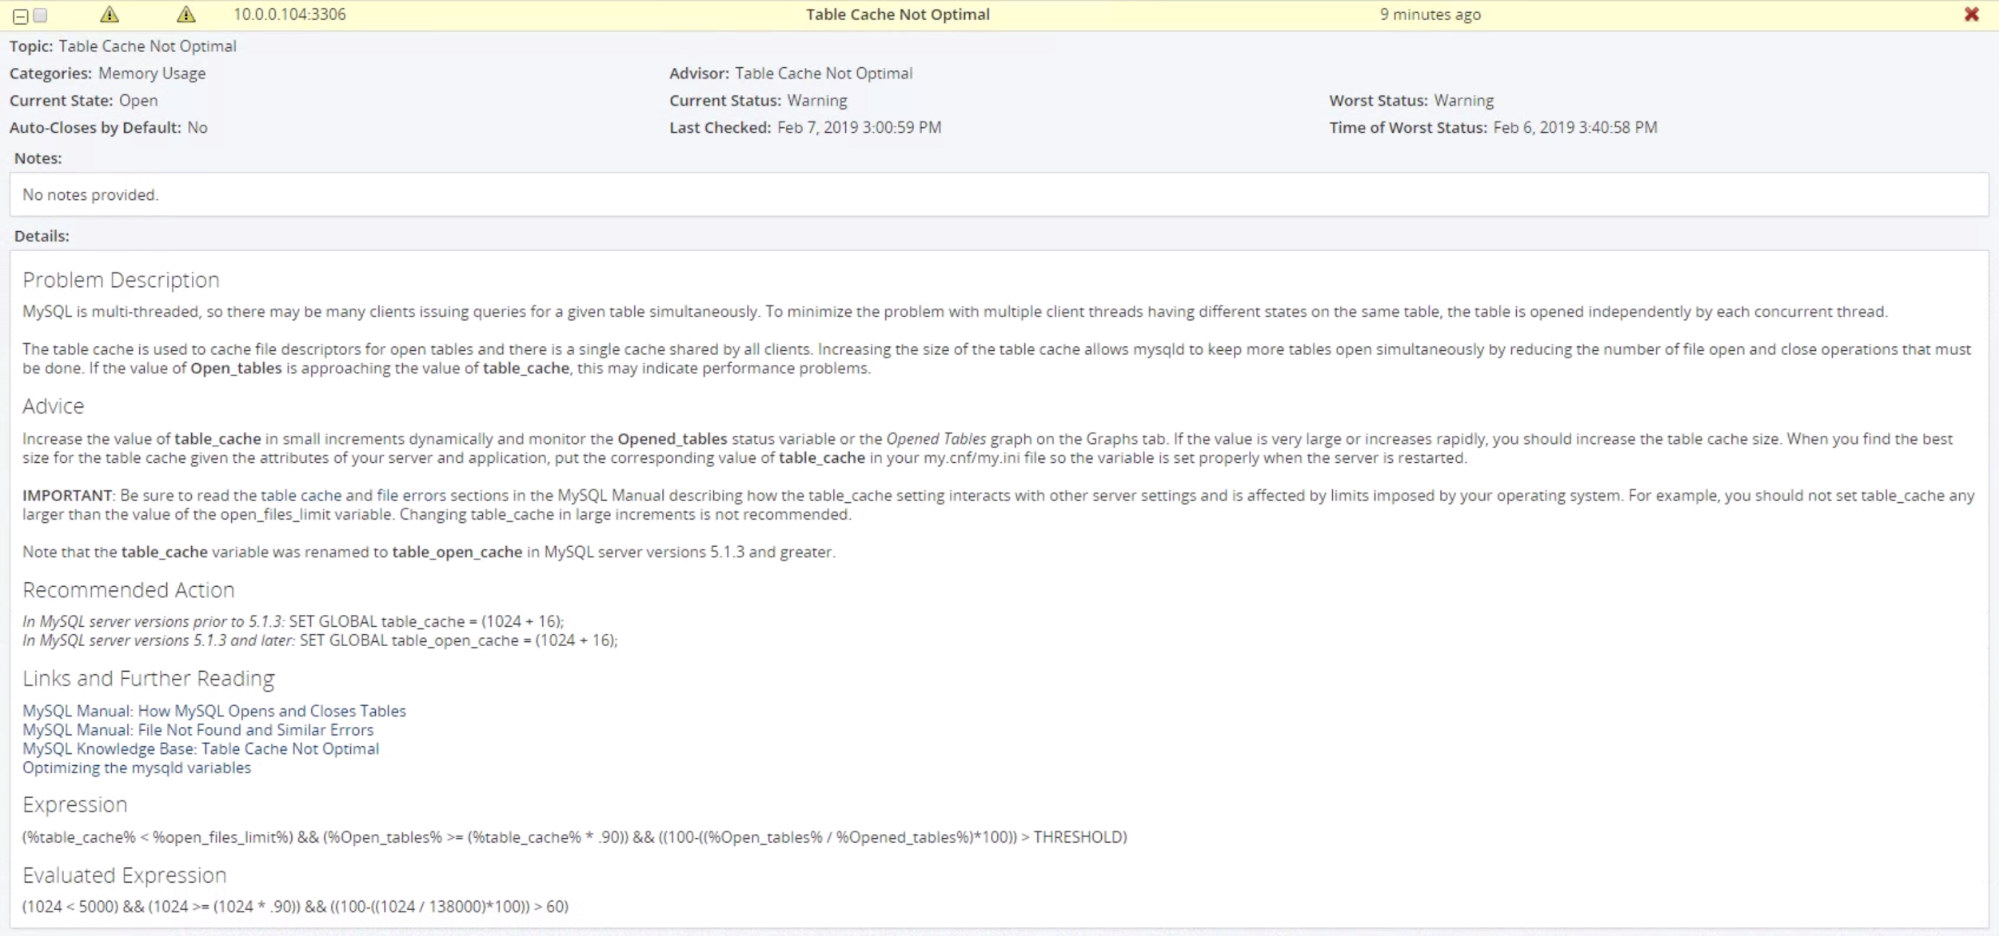
Another example, here we see that table cache is not configured in an optimal way. You can see the explanation of the problem, advice and recommended actions to take based on this alert.
Metrics
In this tab we can see data for multiple MySQL metrics that are helpful to understand the state of the system.
Timeseries Graphs
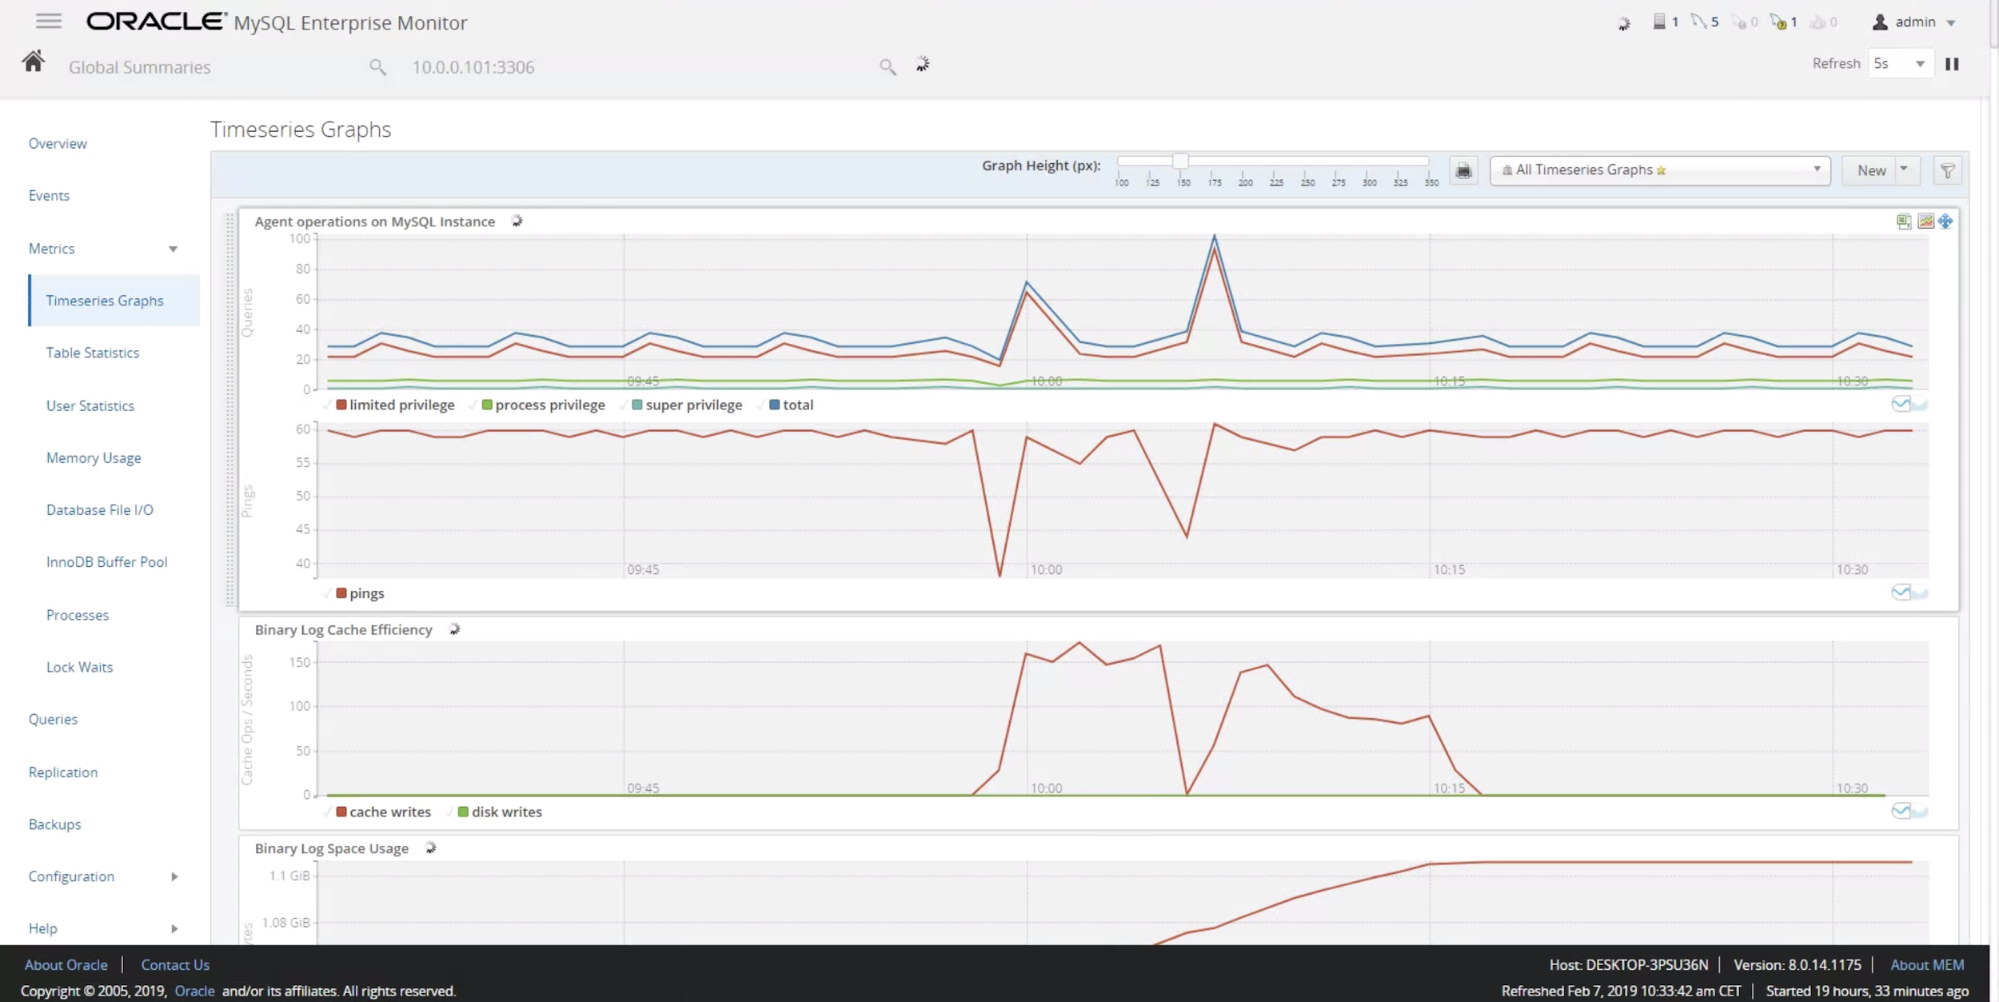
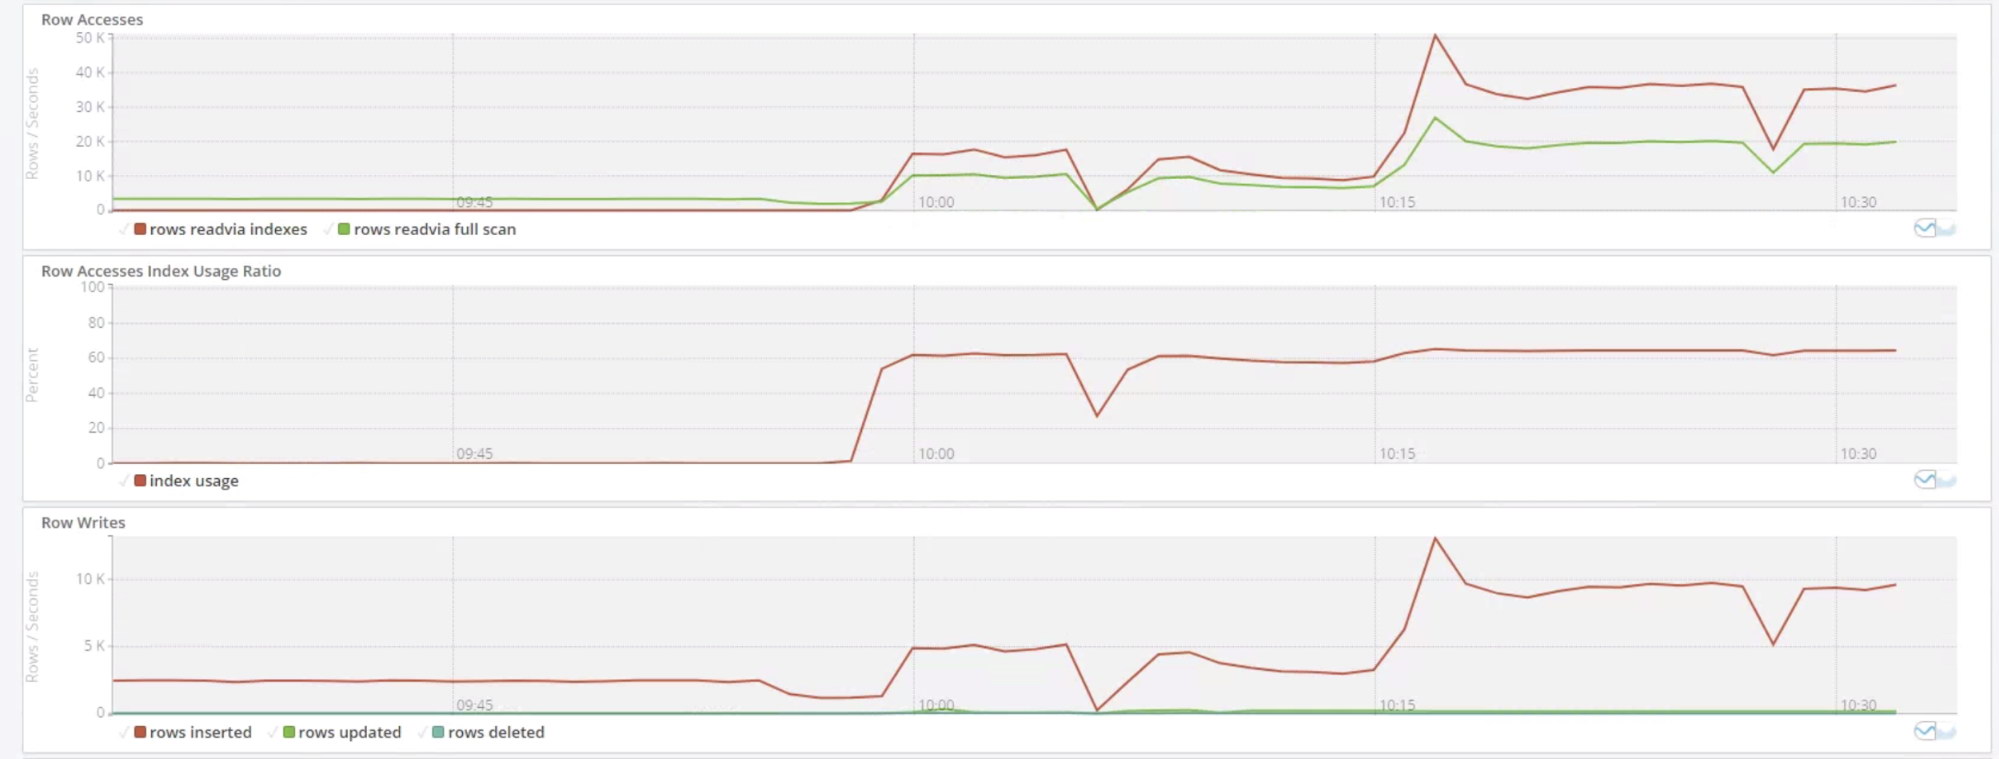
Screenshots above are just an example, there are many more graphs to look at.
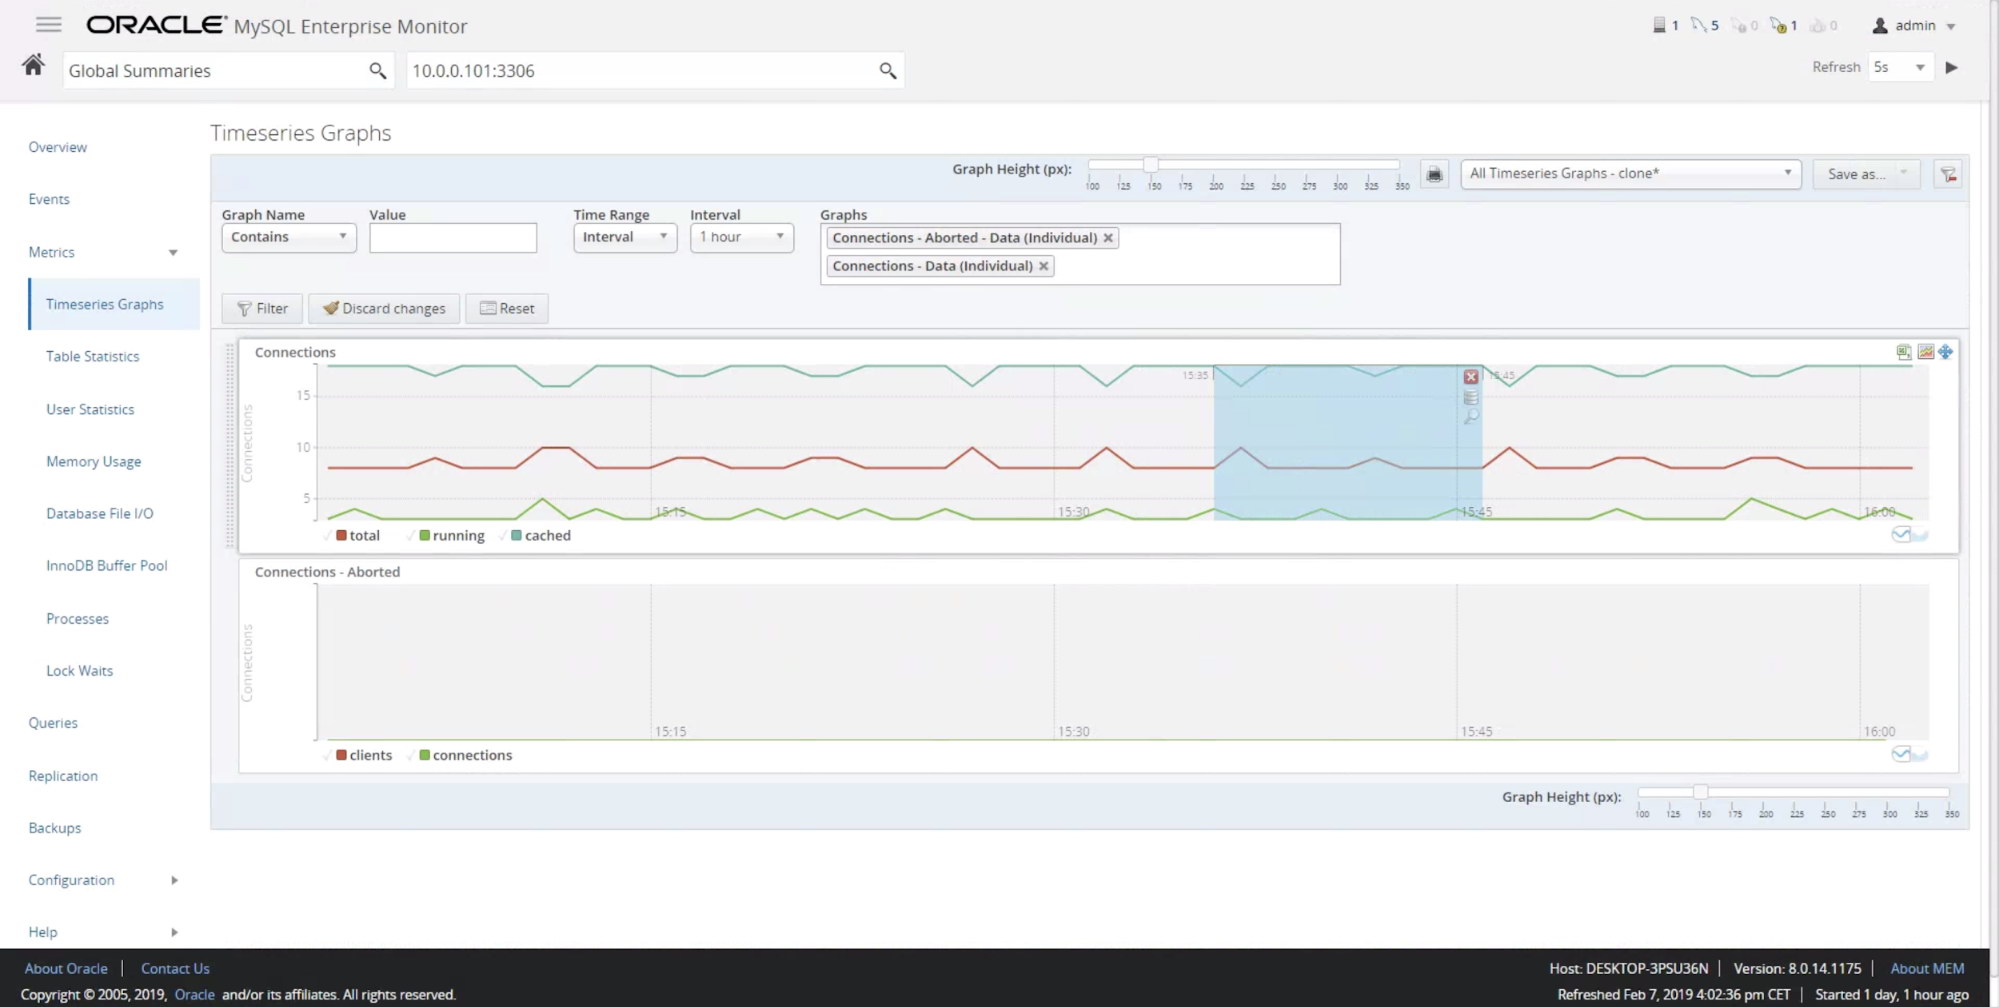
It is possible to apply filtering: you can define which graphs you would like to see, you can also define what time range should be shown. On top of that, you can just mark a part of the graph and either zoom into it or open the Query Analyzer with data from that particular time:
We will go through this functionality later but in short, it allows you to analyze queries, how their performance changed in time and some example queries.
Table Statistics
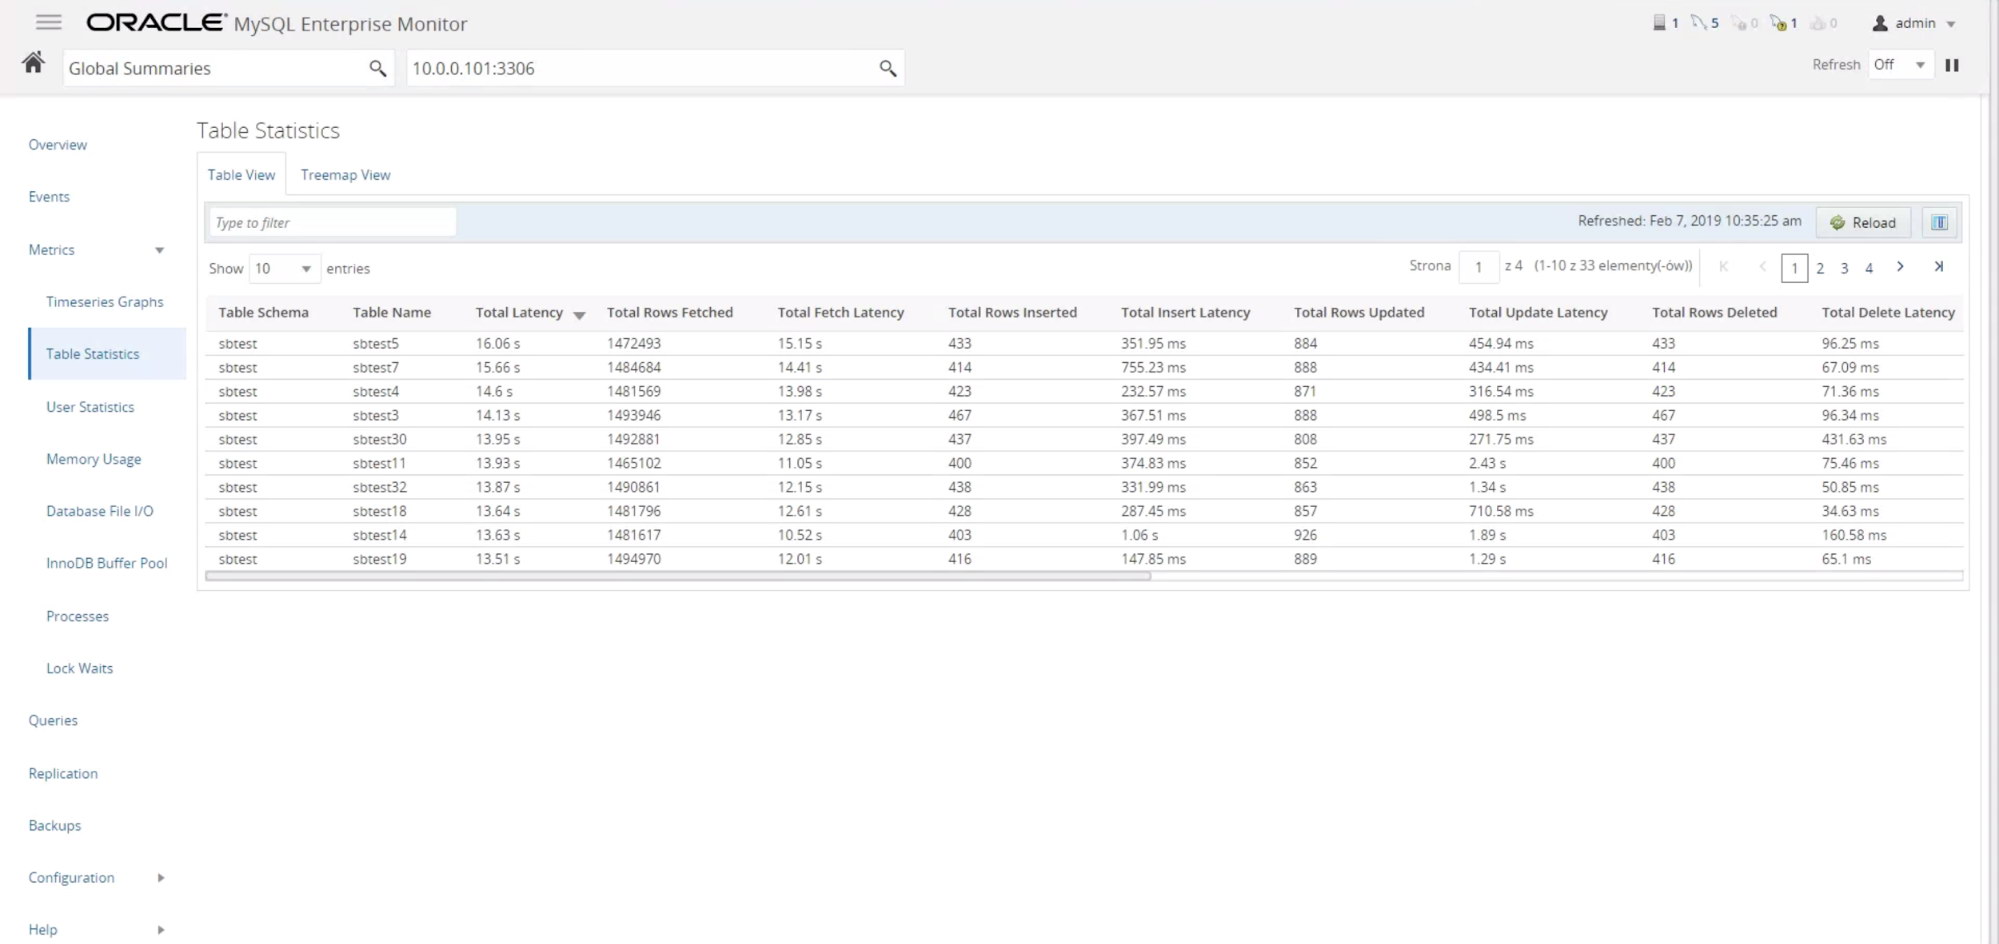
This tab gives us insight into table statistics: how the traffic looked like (rows fetched, inserted, updated, deleted) and how the latency looked like for all the row operations.
User Statistics
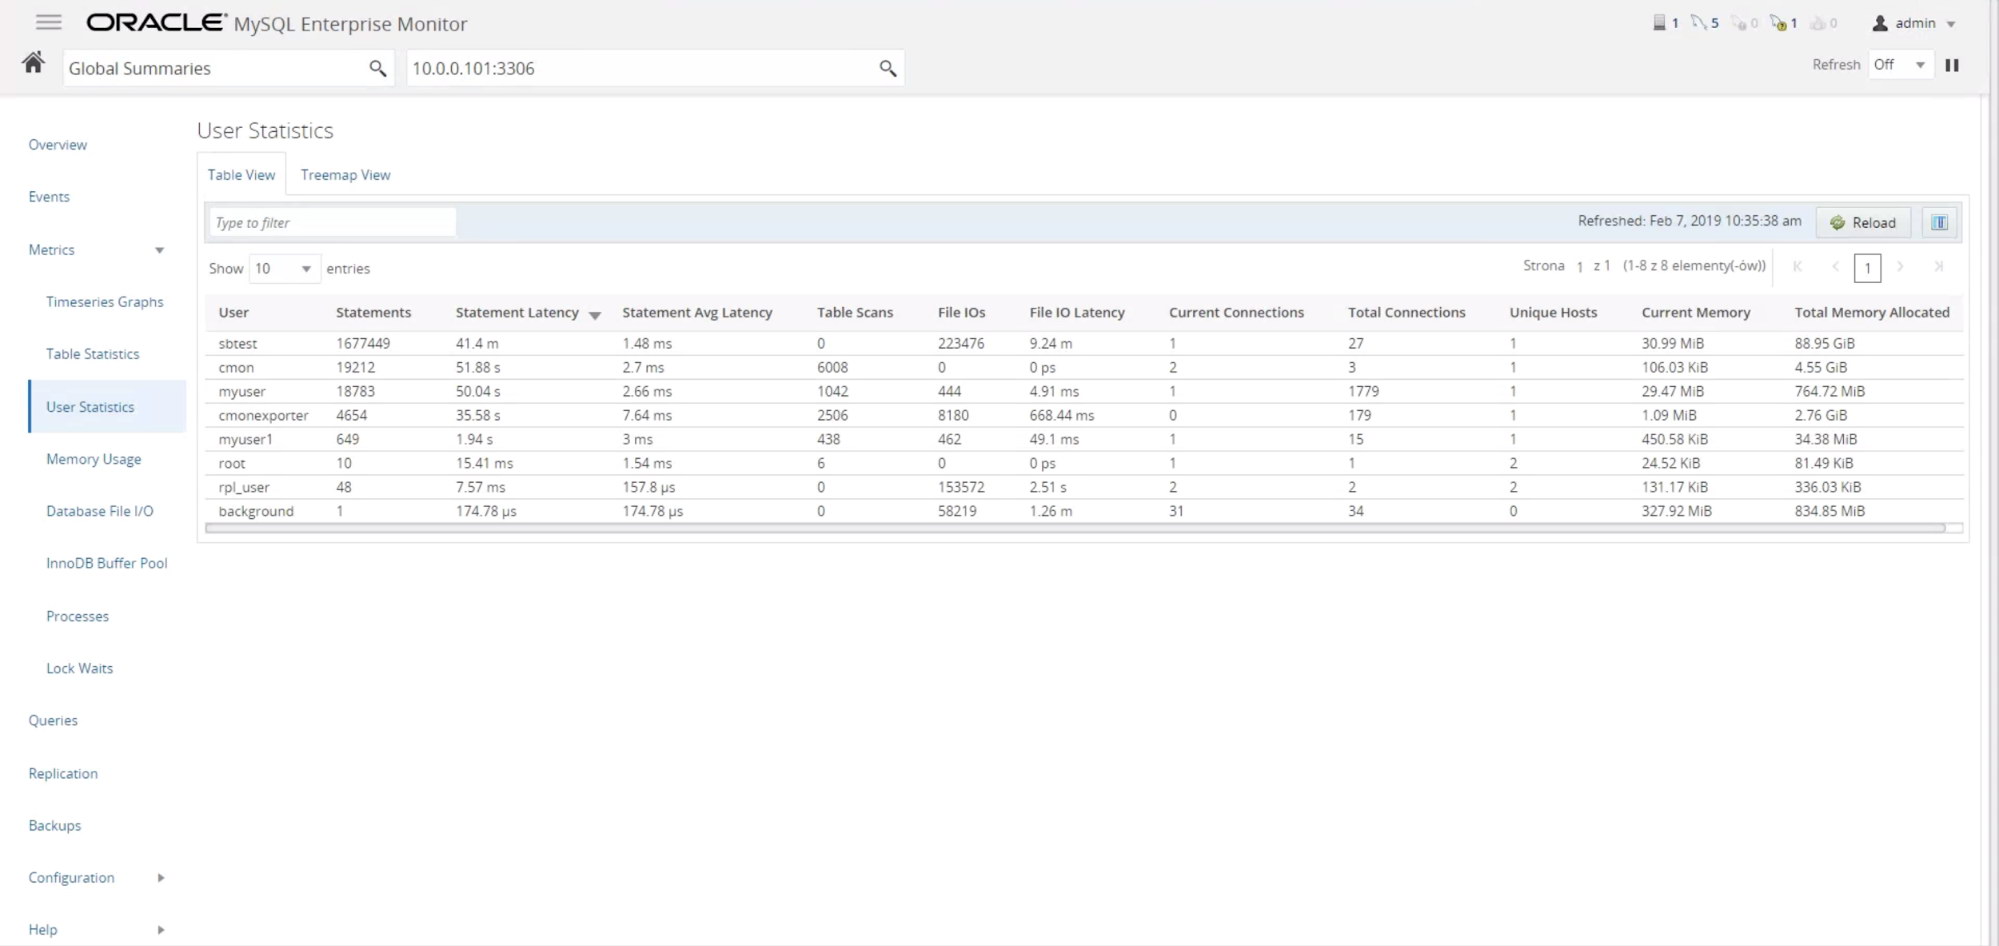
In this tab MySQL Enterprise Monitor presents data about users – statements executed, latency, table scans, I/O latency, connections, memory utilization. This data should give quite a good insight into which user is responsible for the load on the database. It might be very useful especially in the multi-user environments, where there is no one main source of the traffic.
Database File I/O
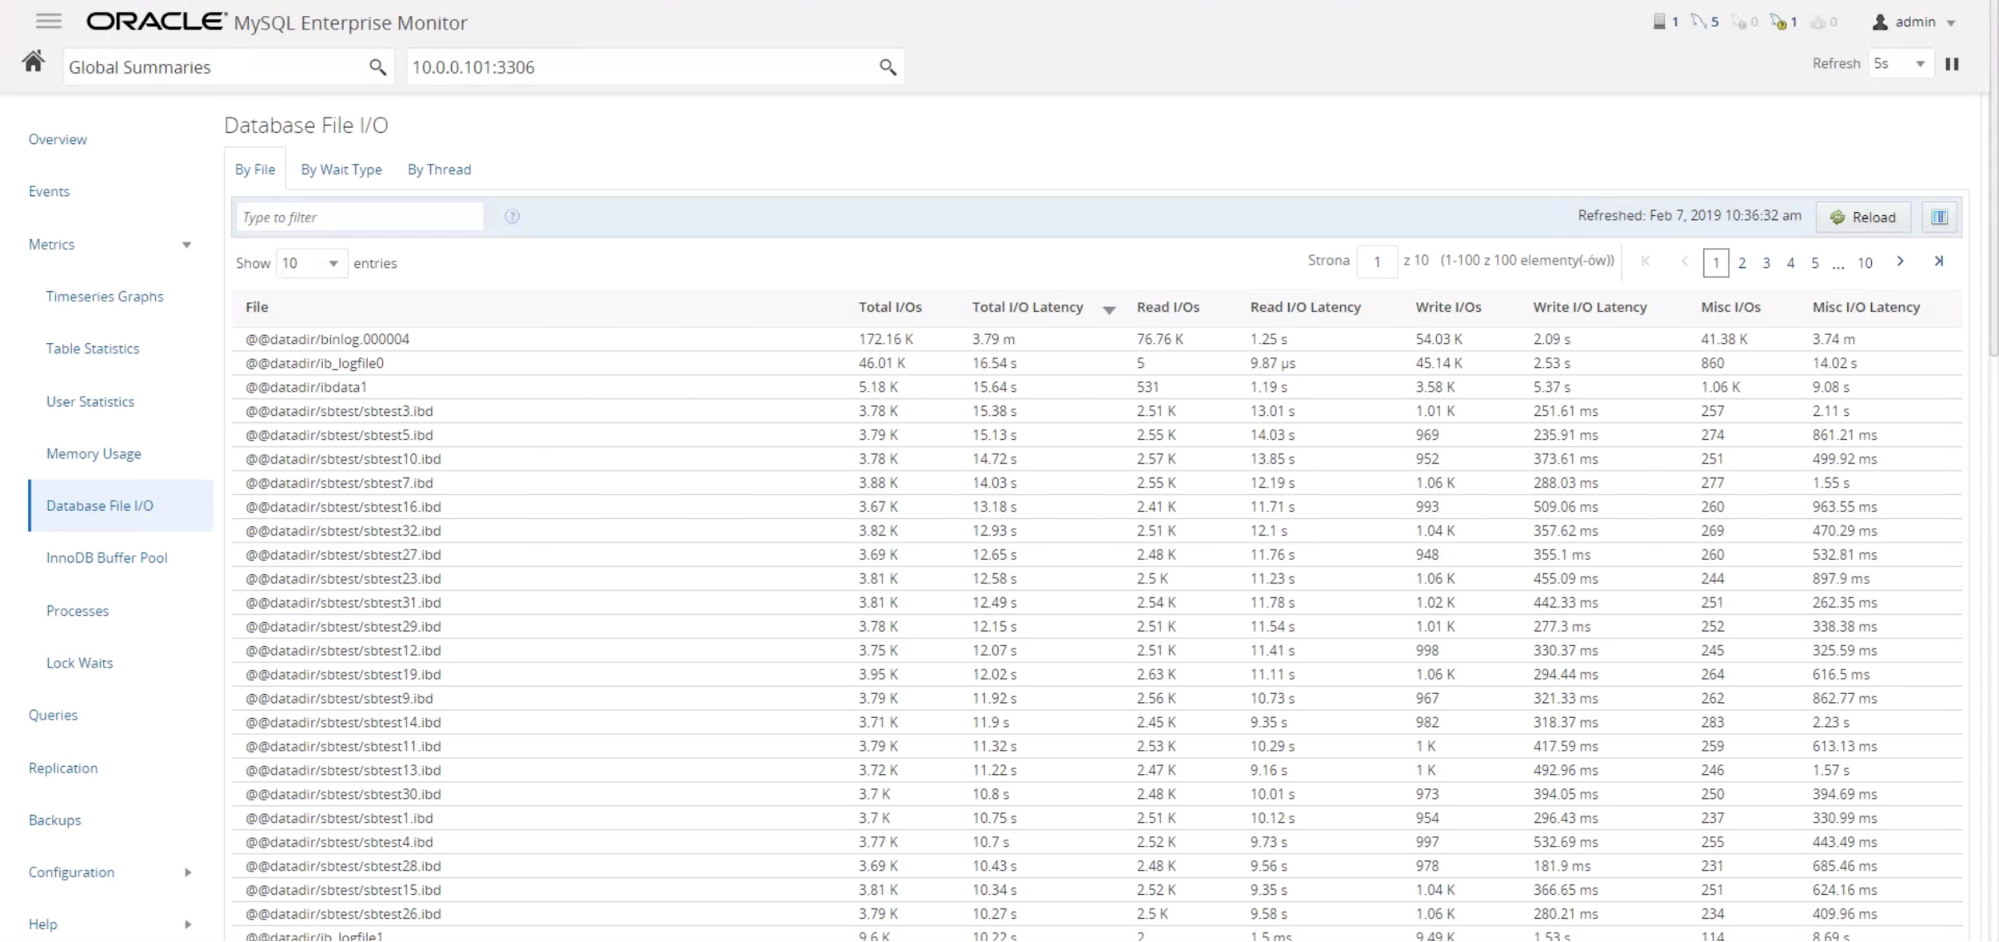
Database File I/O explains how the I/O load is distributed across the files in the database. Total number of I/O operations, latency, how many reads and writes were performed on a given file.
Memory Usage
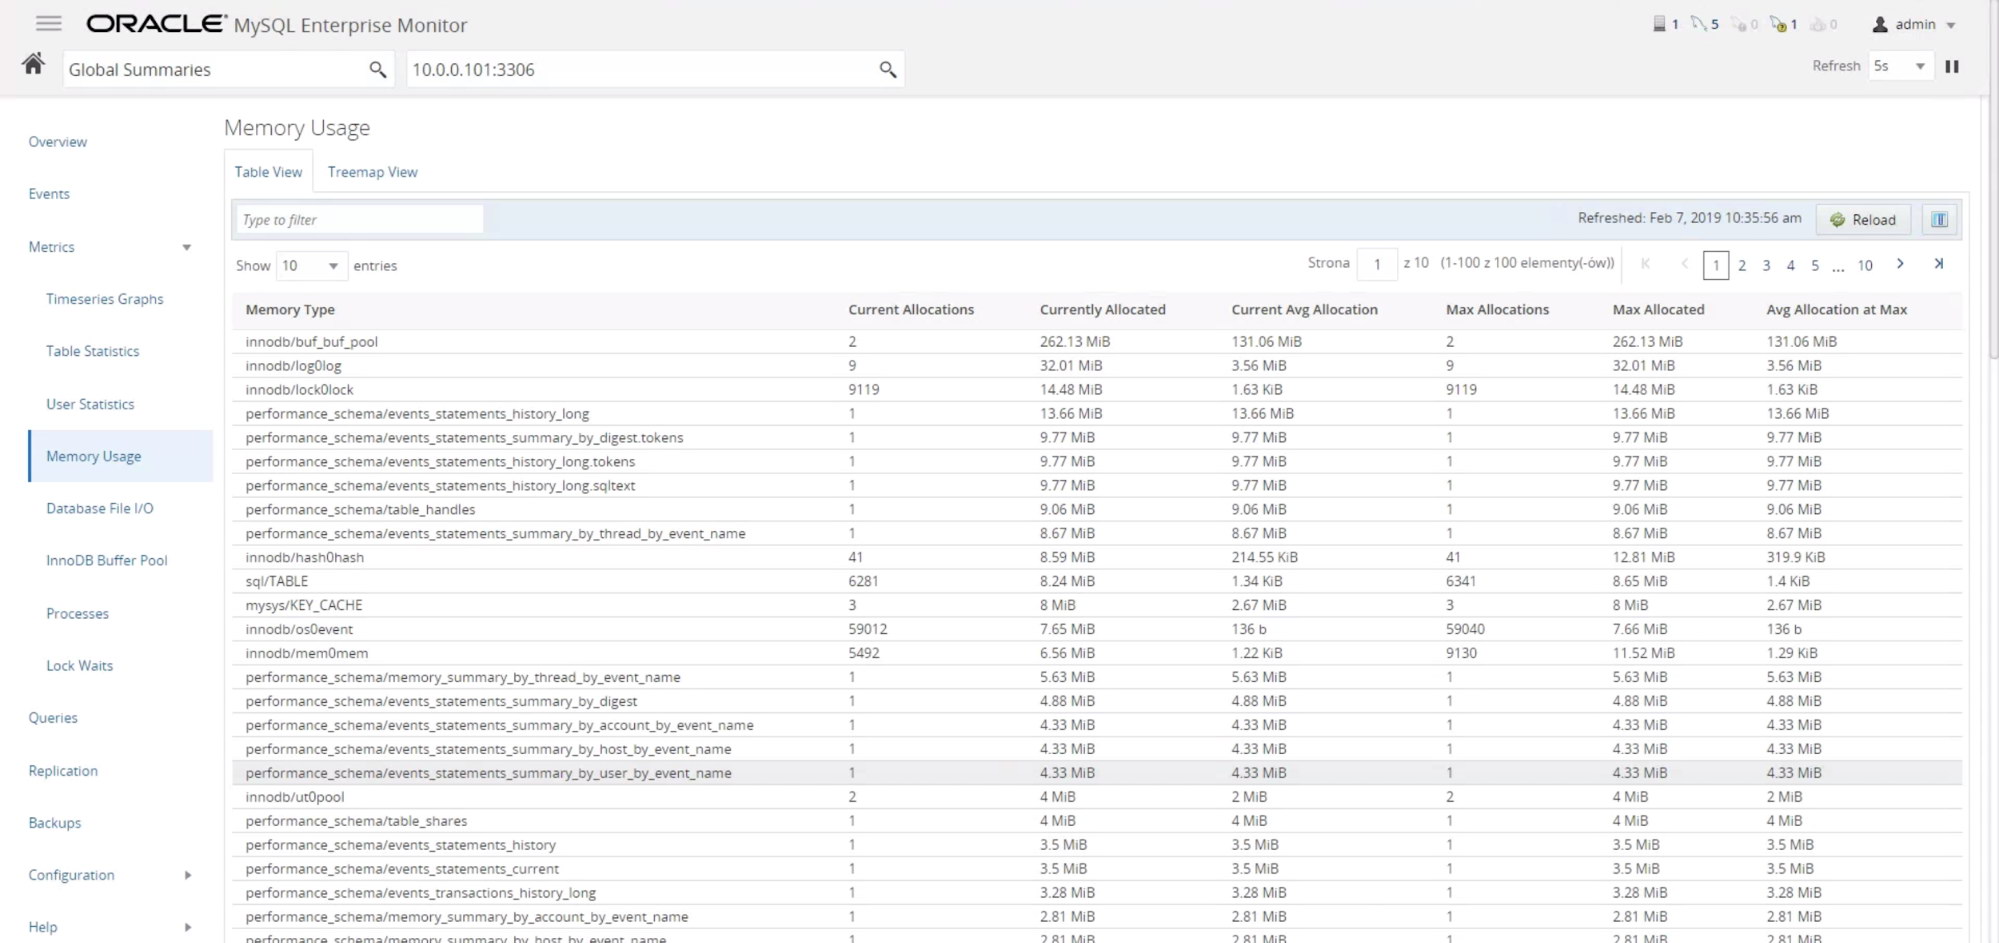
Memory usage shows memory structures in MySQL, which help to build the better picture of the memory utilization in the database. This data can come handy in case of issues with memory – it is easy to track where the growth is the biggest and, if needed, reduce relevant settings. It can also help significantly in diagnosing potential memory leaks.
InnoDB Buffer Pool
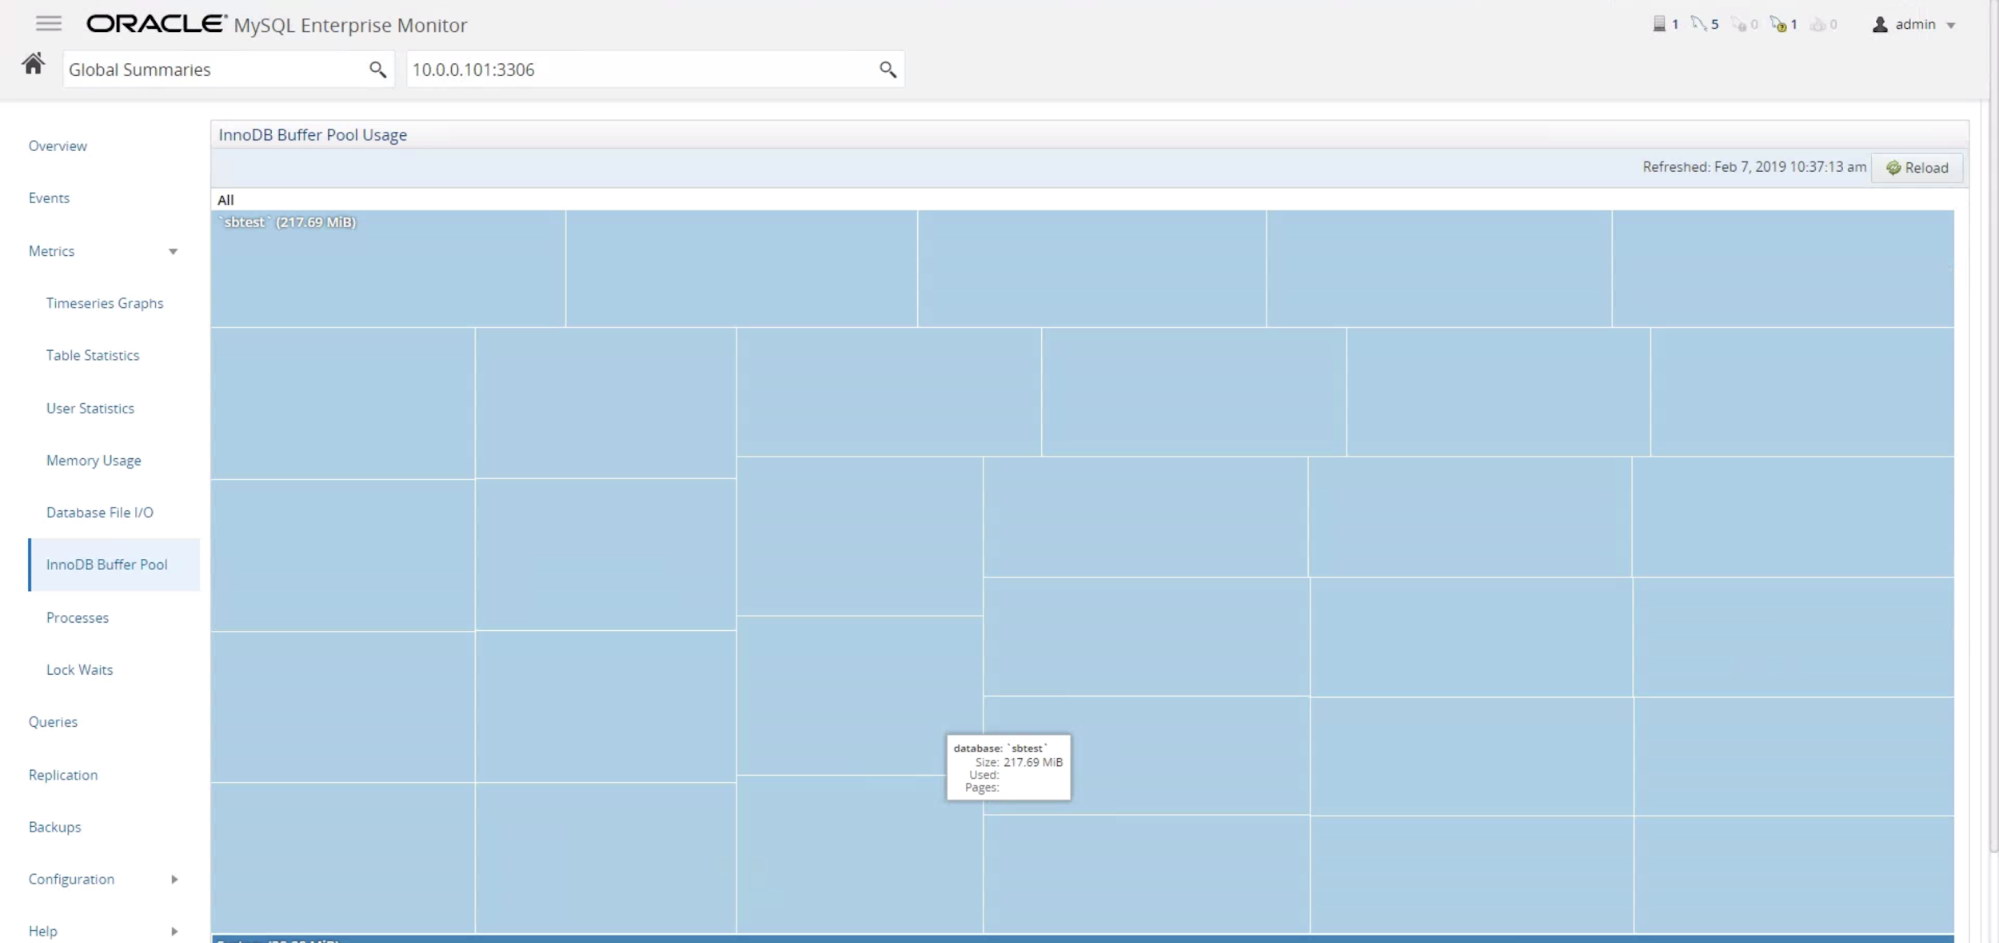
This tab in MySQL Enterprise Monitor gives the user insight into the structure of the buffer pool utilization. Which tables are cached, how many dirty pages are there to flush?
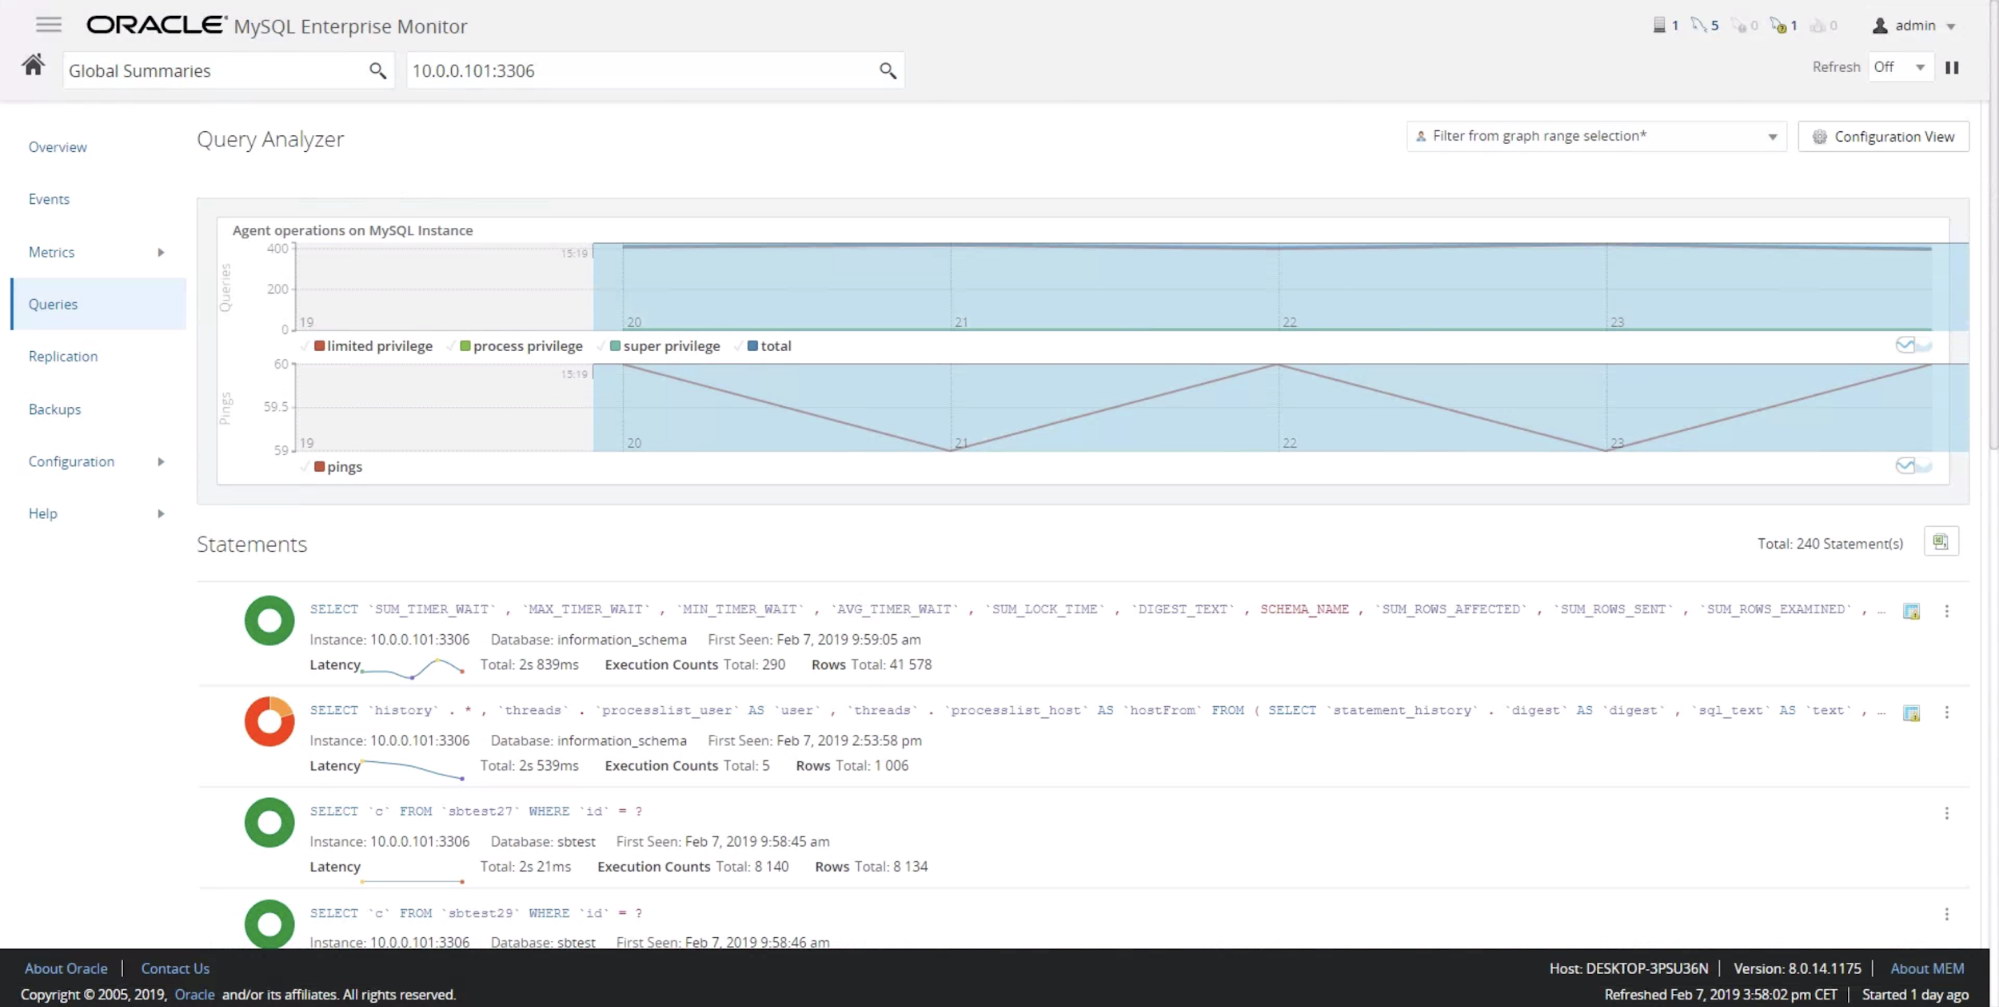
Queries
It is extremely important for any MySQL user to understand the load that queries create. Which queries are the most problematic? How they behave in time? Performance can be measured in multiple ways but it is quite common that it is the predictable, stable performance is more important than the top performance. As long as the response time is acceptable, users will like the predictable results better than somewhat faster response (low latency), which can sometimes slow the server down significantly. That’s why it is very valuable to see how a query behaves in time and pinpoint those, which behavior is not consistent.
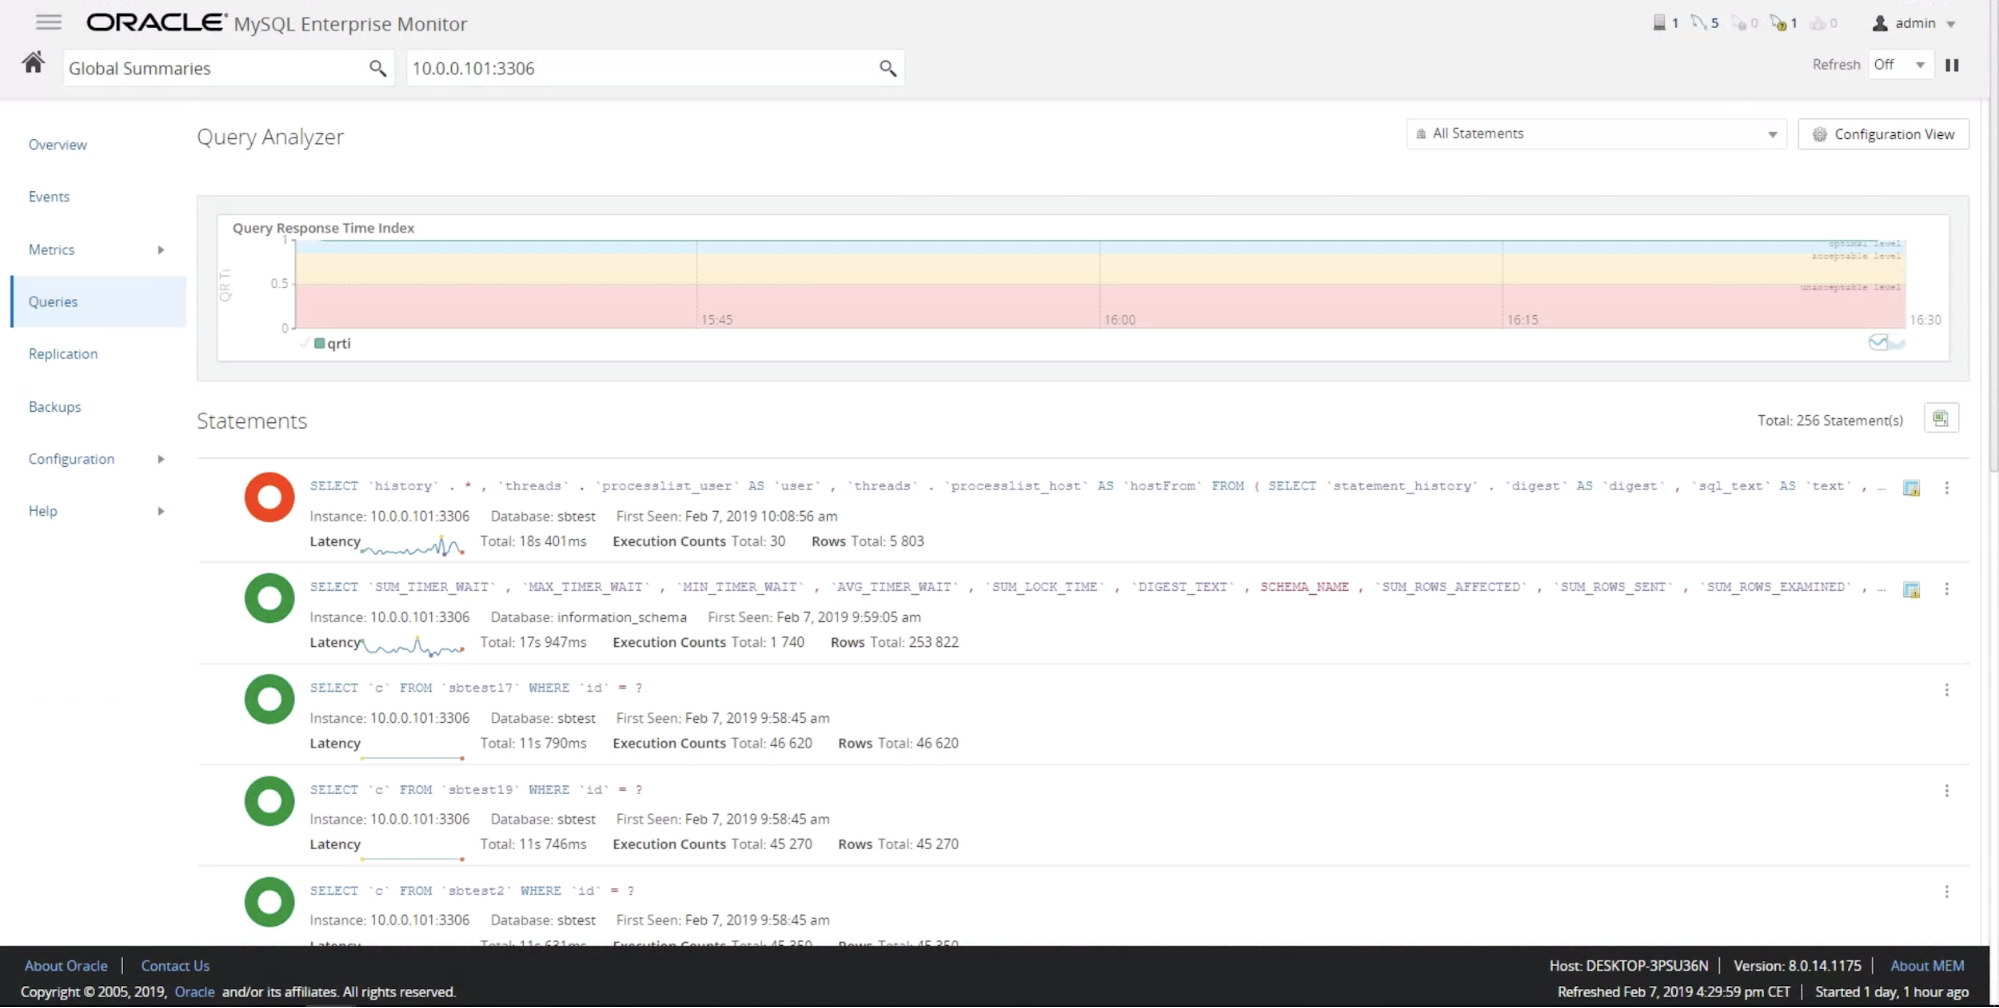
MySQL Enterprise Monitor definitely delivers such data. On the list of the queries, you can easily see how the latency changed in time. Flat line is good, spikes – not so much. This means such query may have to be investigated further. When you click on it, MySQL Enterprise Monitor will give you more data about it.
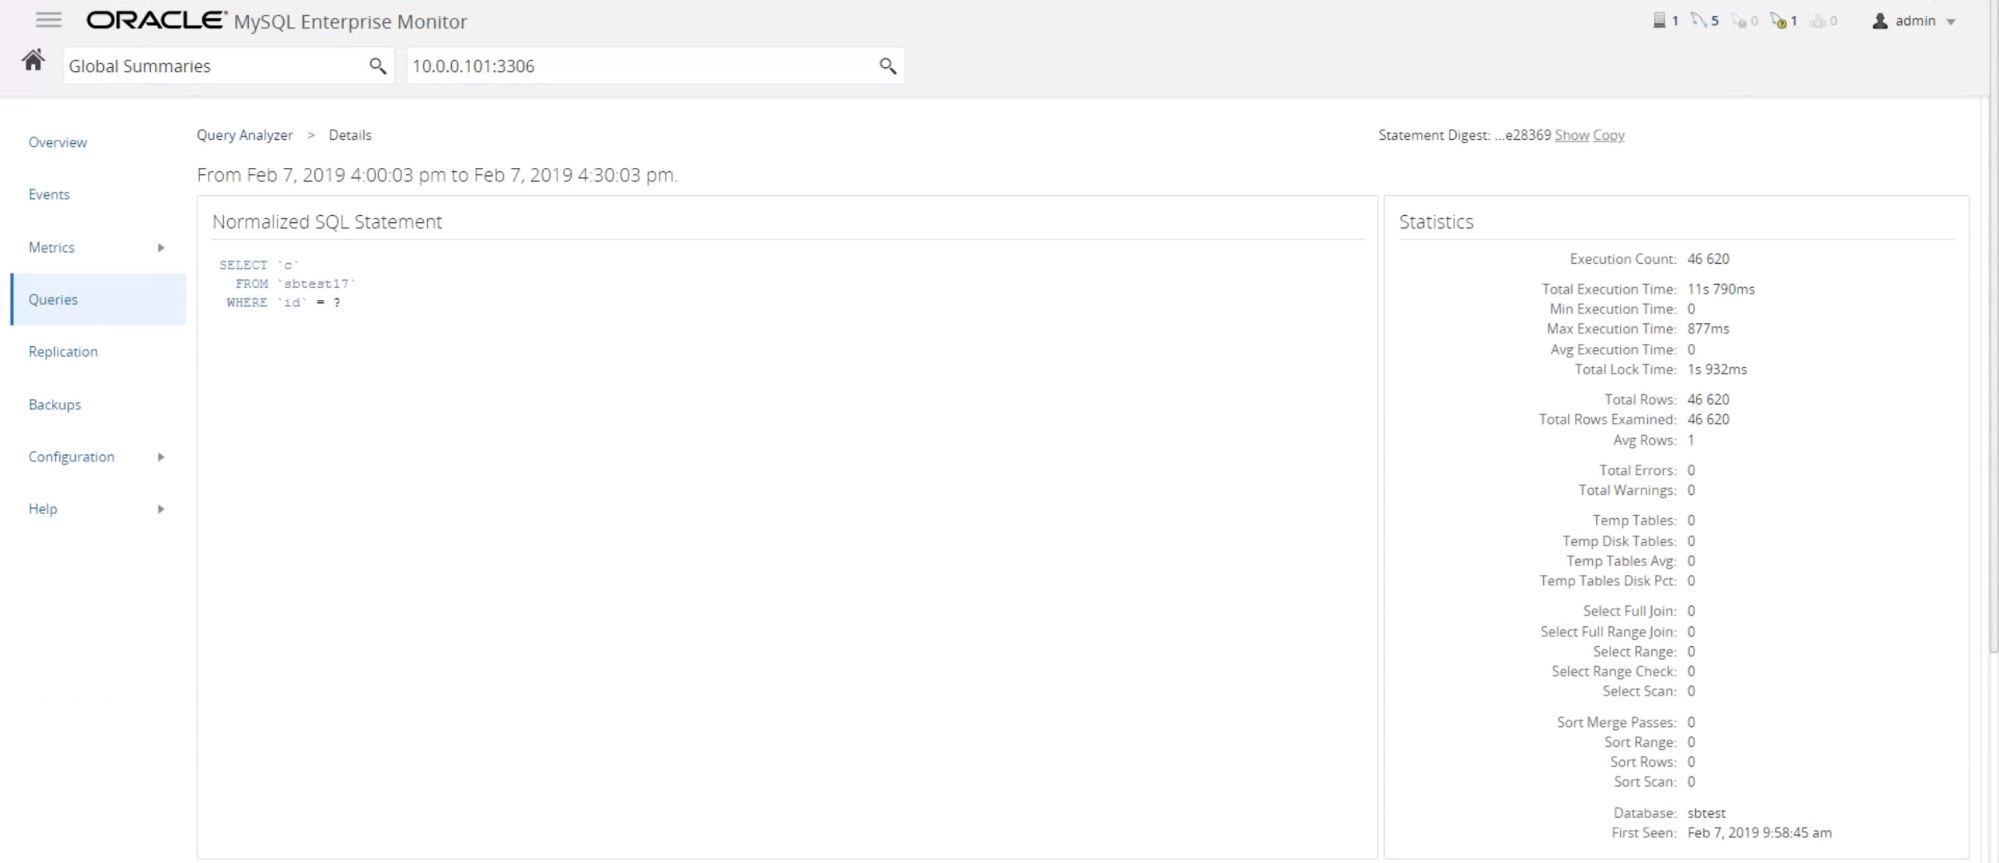
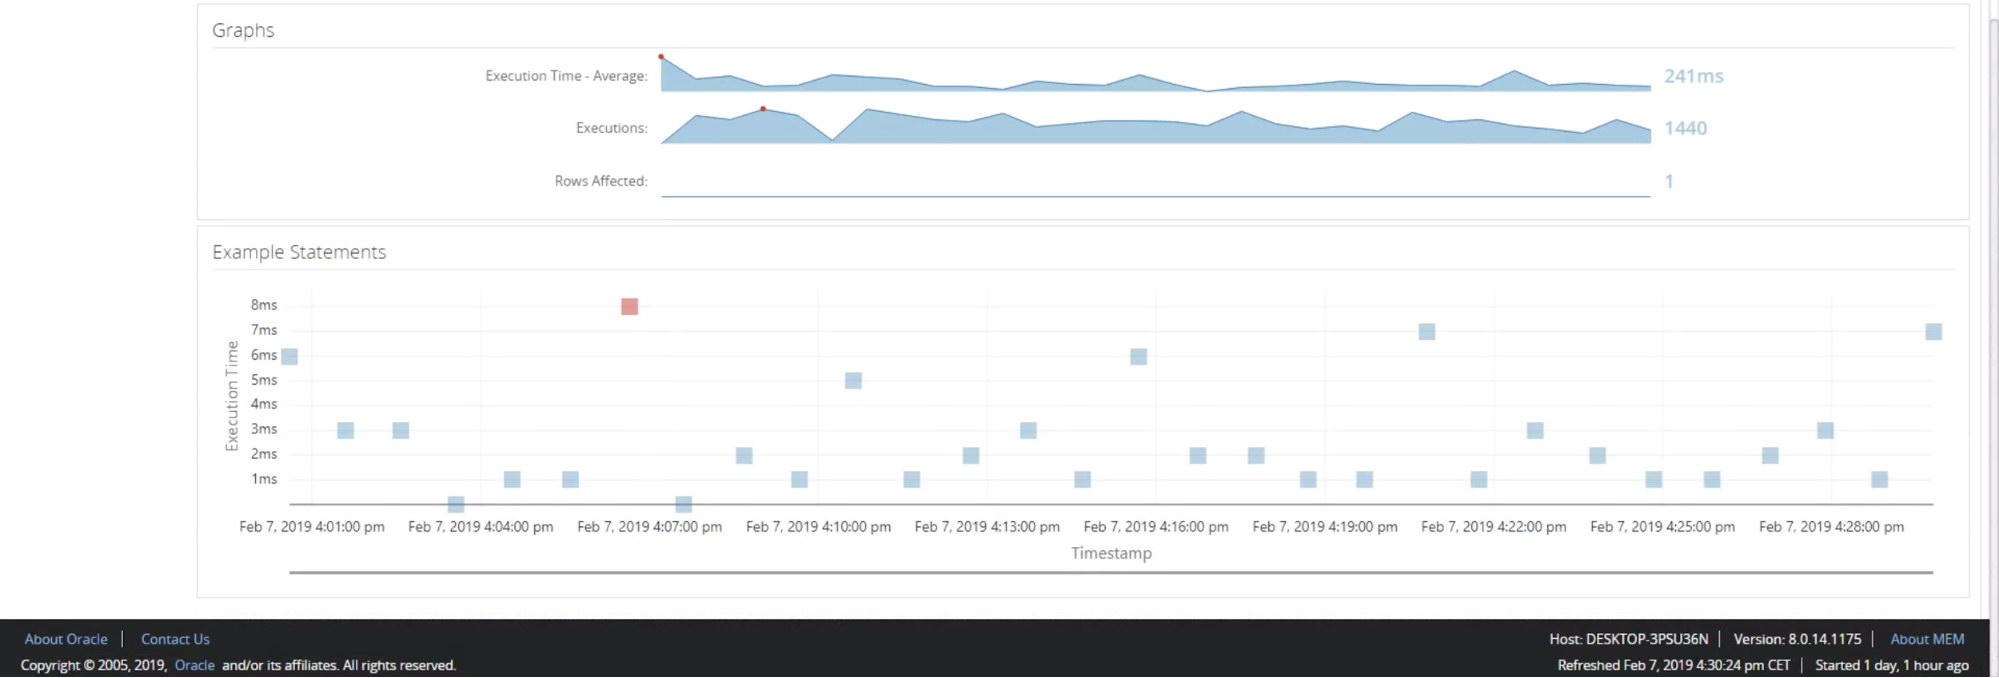
As you can see, there are some statistical data about the particular query type, you can also see how the latency changed in time. At the bottom you can see some example statements in time and you can compare their execution time.
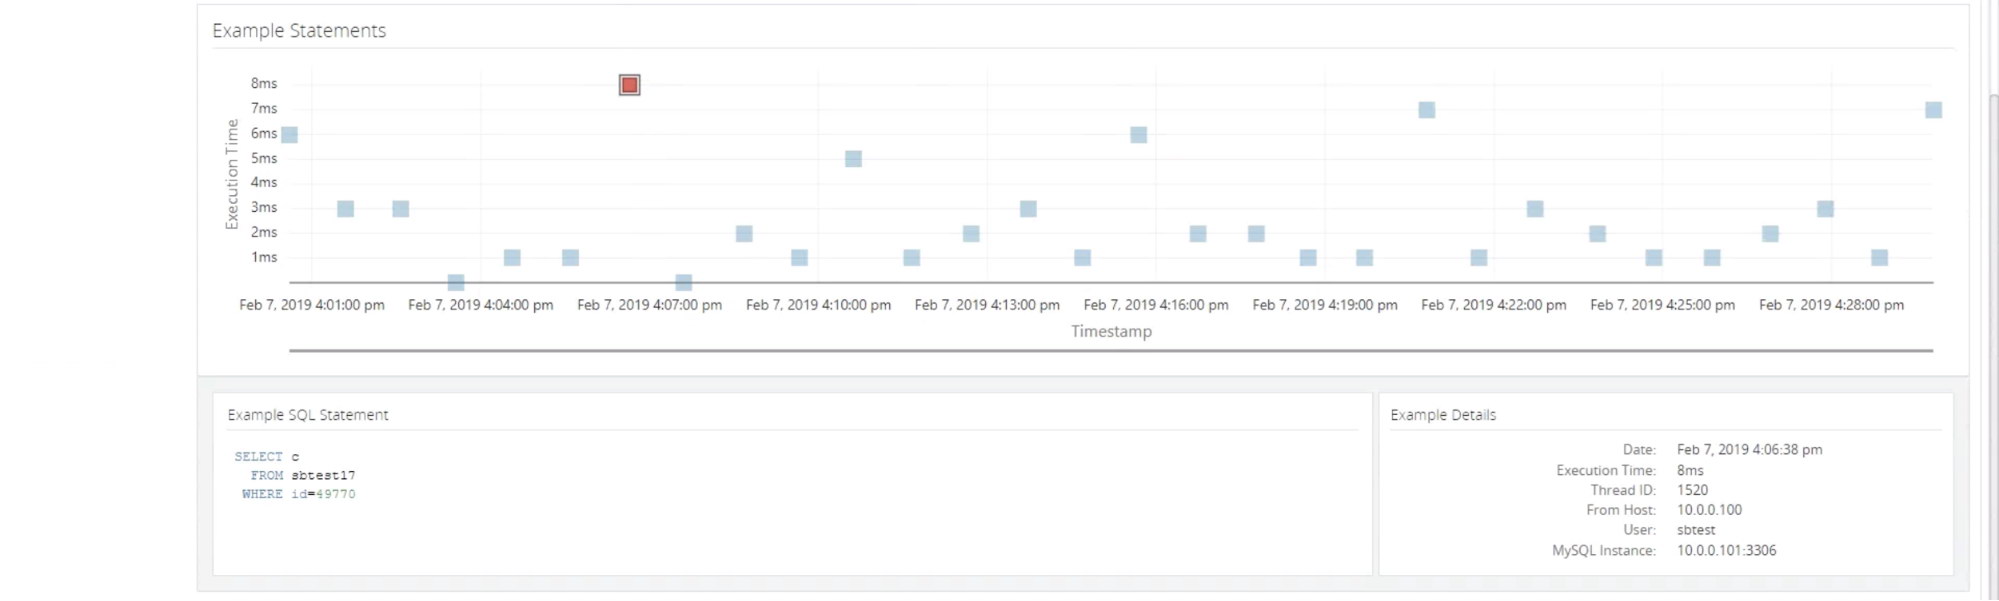
When you click on one of them, you will see a full query that was executed at that moment. It can be useful in case of queries where the performance differs depending on what arguments were used in WHERE case (for example, WHERE some_column = ‘some value’ and values in that column are not distributed evenly across the rows).
Replication
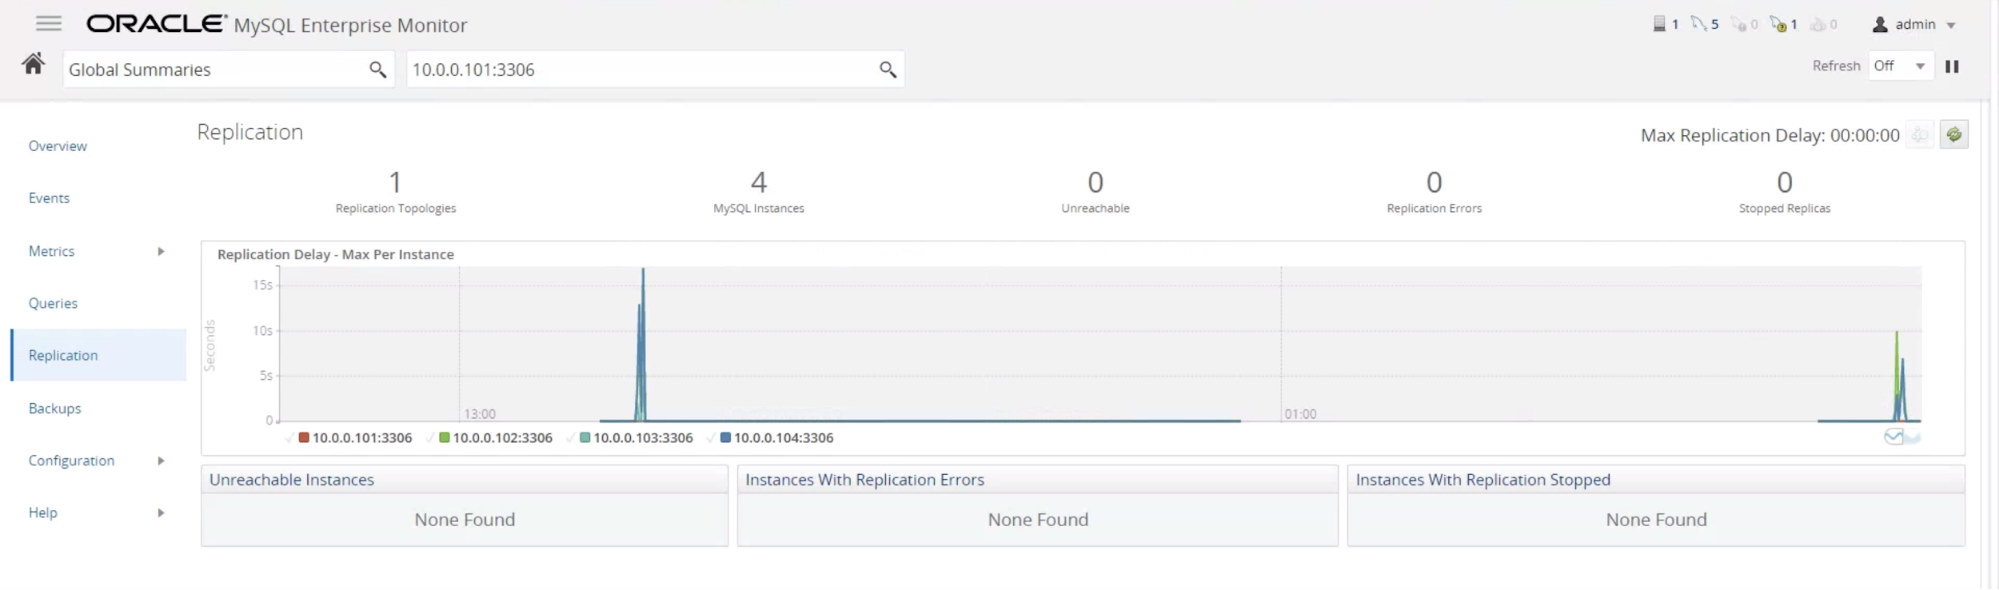
In a MySQL replication environment, lag is something you have to learn to deal with. What is important is to keep the track of it – how badly are slaves lagging? How often does it happen? With this information it is possible to try and pinpoint the issue and understand better what queries are causing it. Then you can try to implement some improvements like, for example, multi-threaded replication and track if the changes improved the replication performance and reduced the lag to an acceptable level.
How is MySQL Enterprise Monitor Different from ClusterControl
As we stated, MySQL Enterprise Monitor is a part of the paid MySQL Enterprise Edition. For all users of the MySQL Community, MariaDB or Percona Server, MySQL Enterprise Edition is not available. ClusterControl provides access to monitoring of MySQL in its free Community version. In terms of server and query monitoring, there are many similarities.
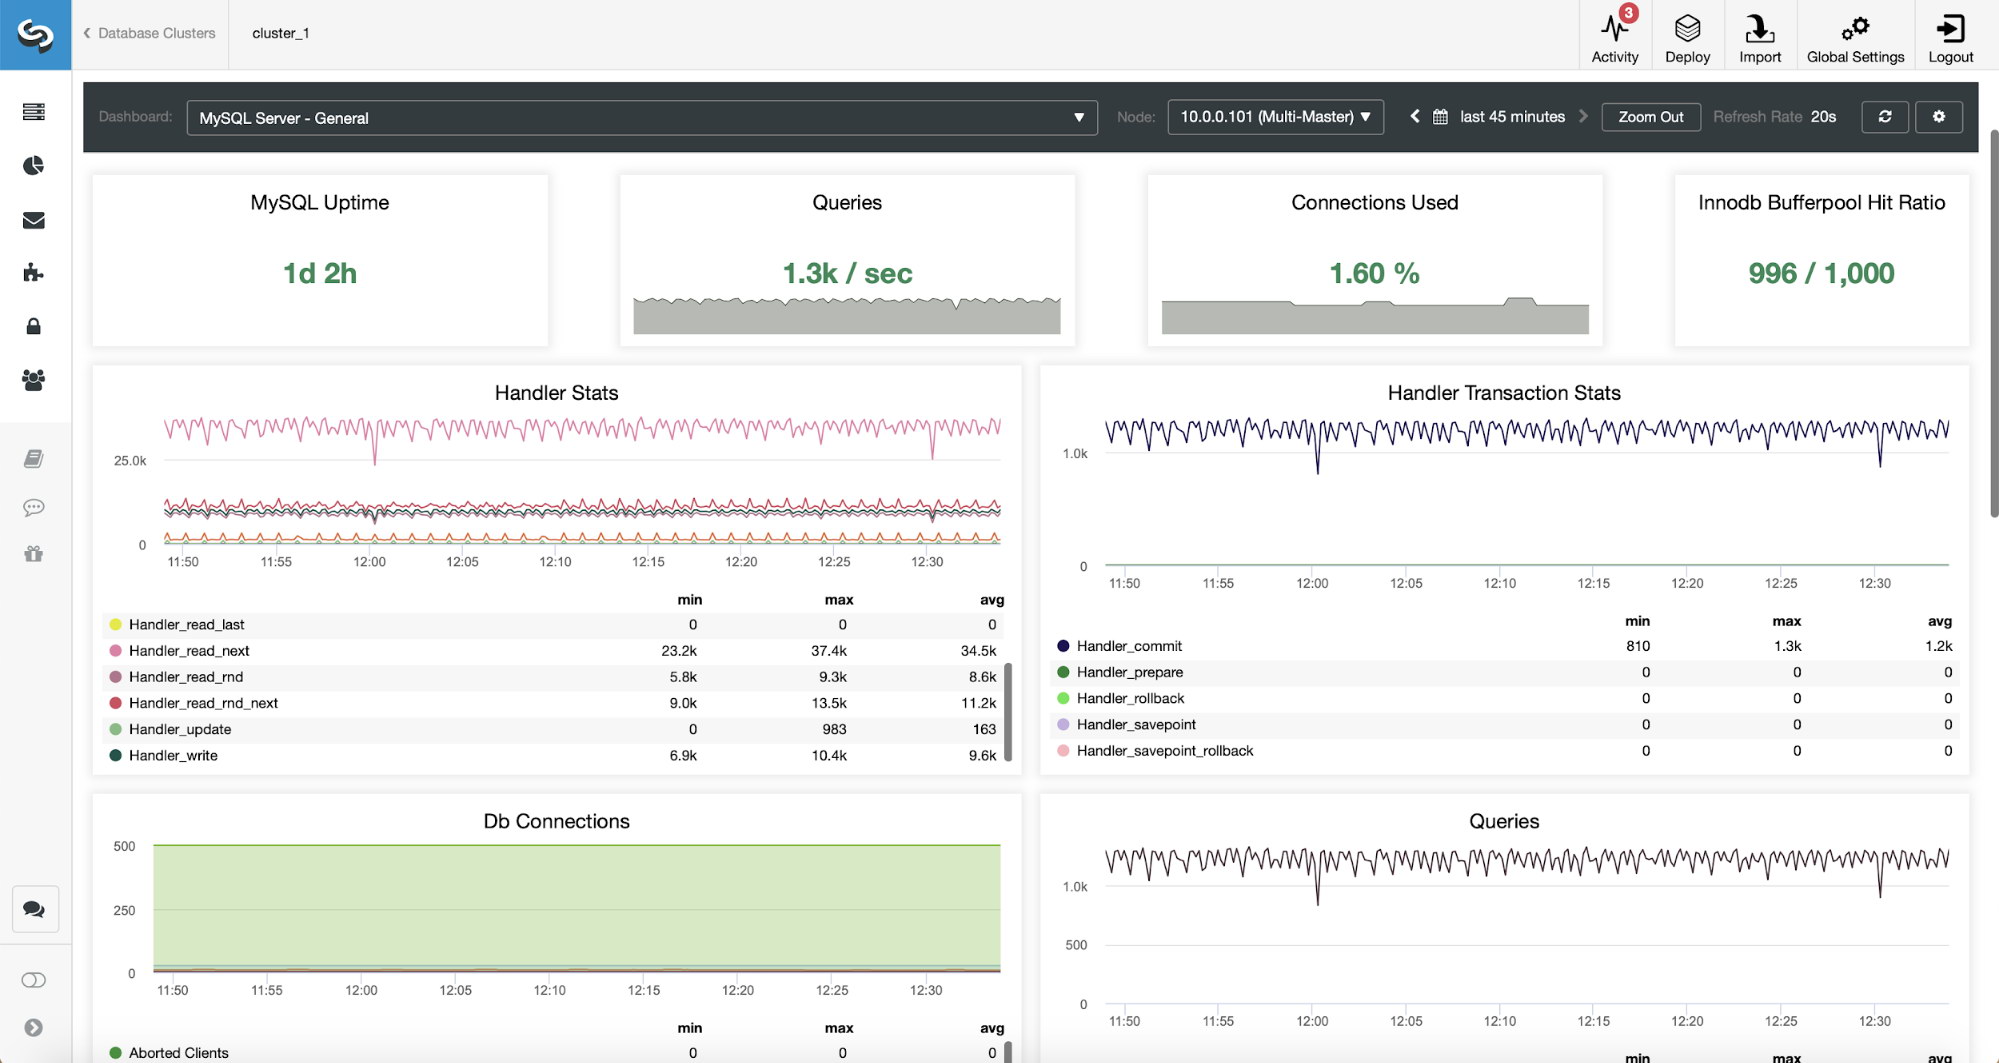
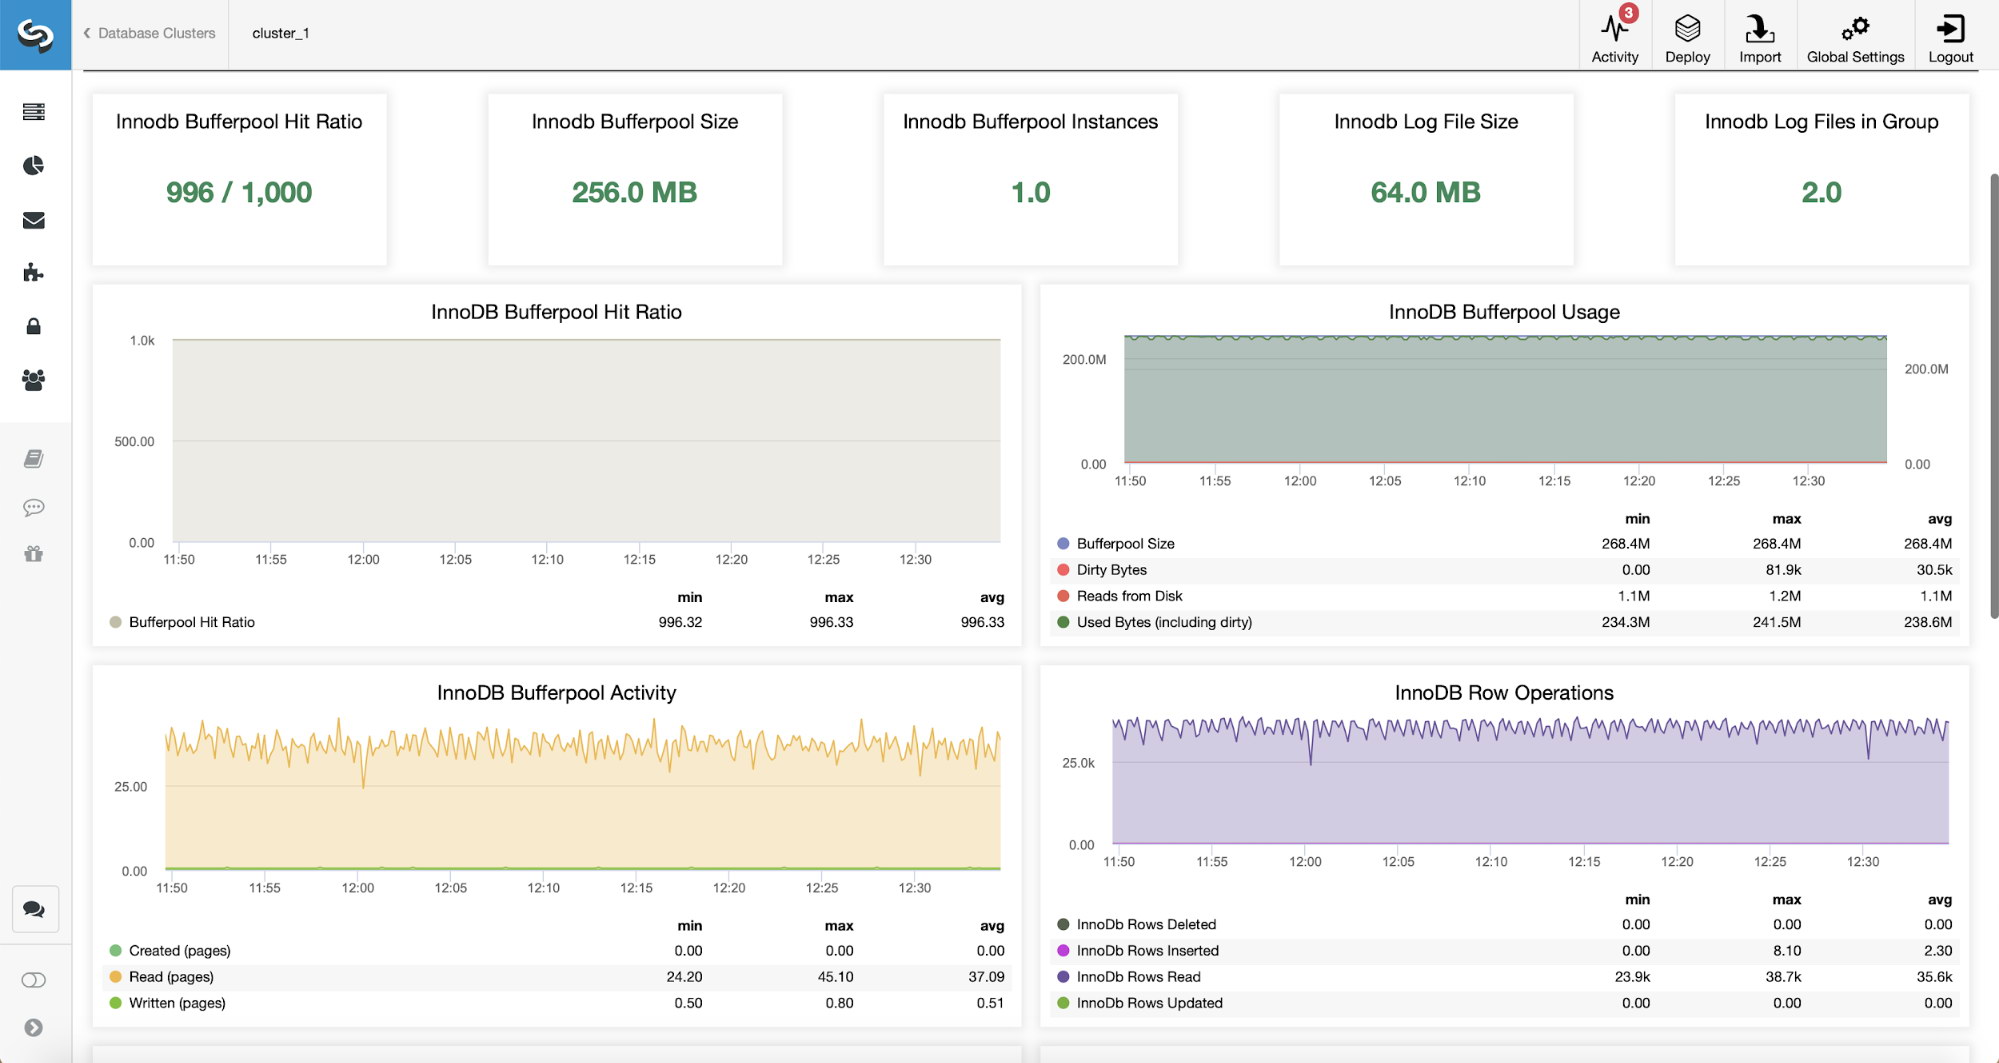
ClusterControl gives you access to MySQL metrics collected and stored in the Prometheus time-series database. You can easily keep track of numerous metrics made available in ClusterControl.
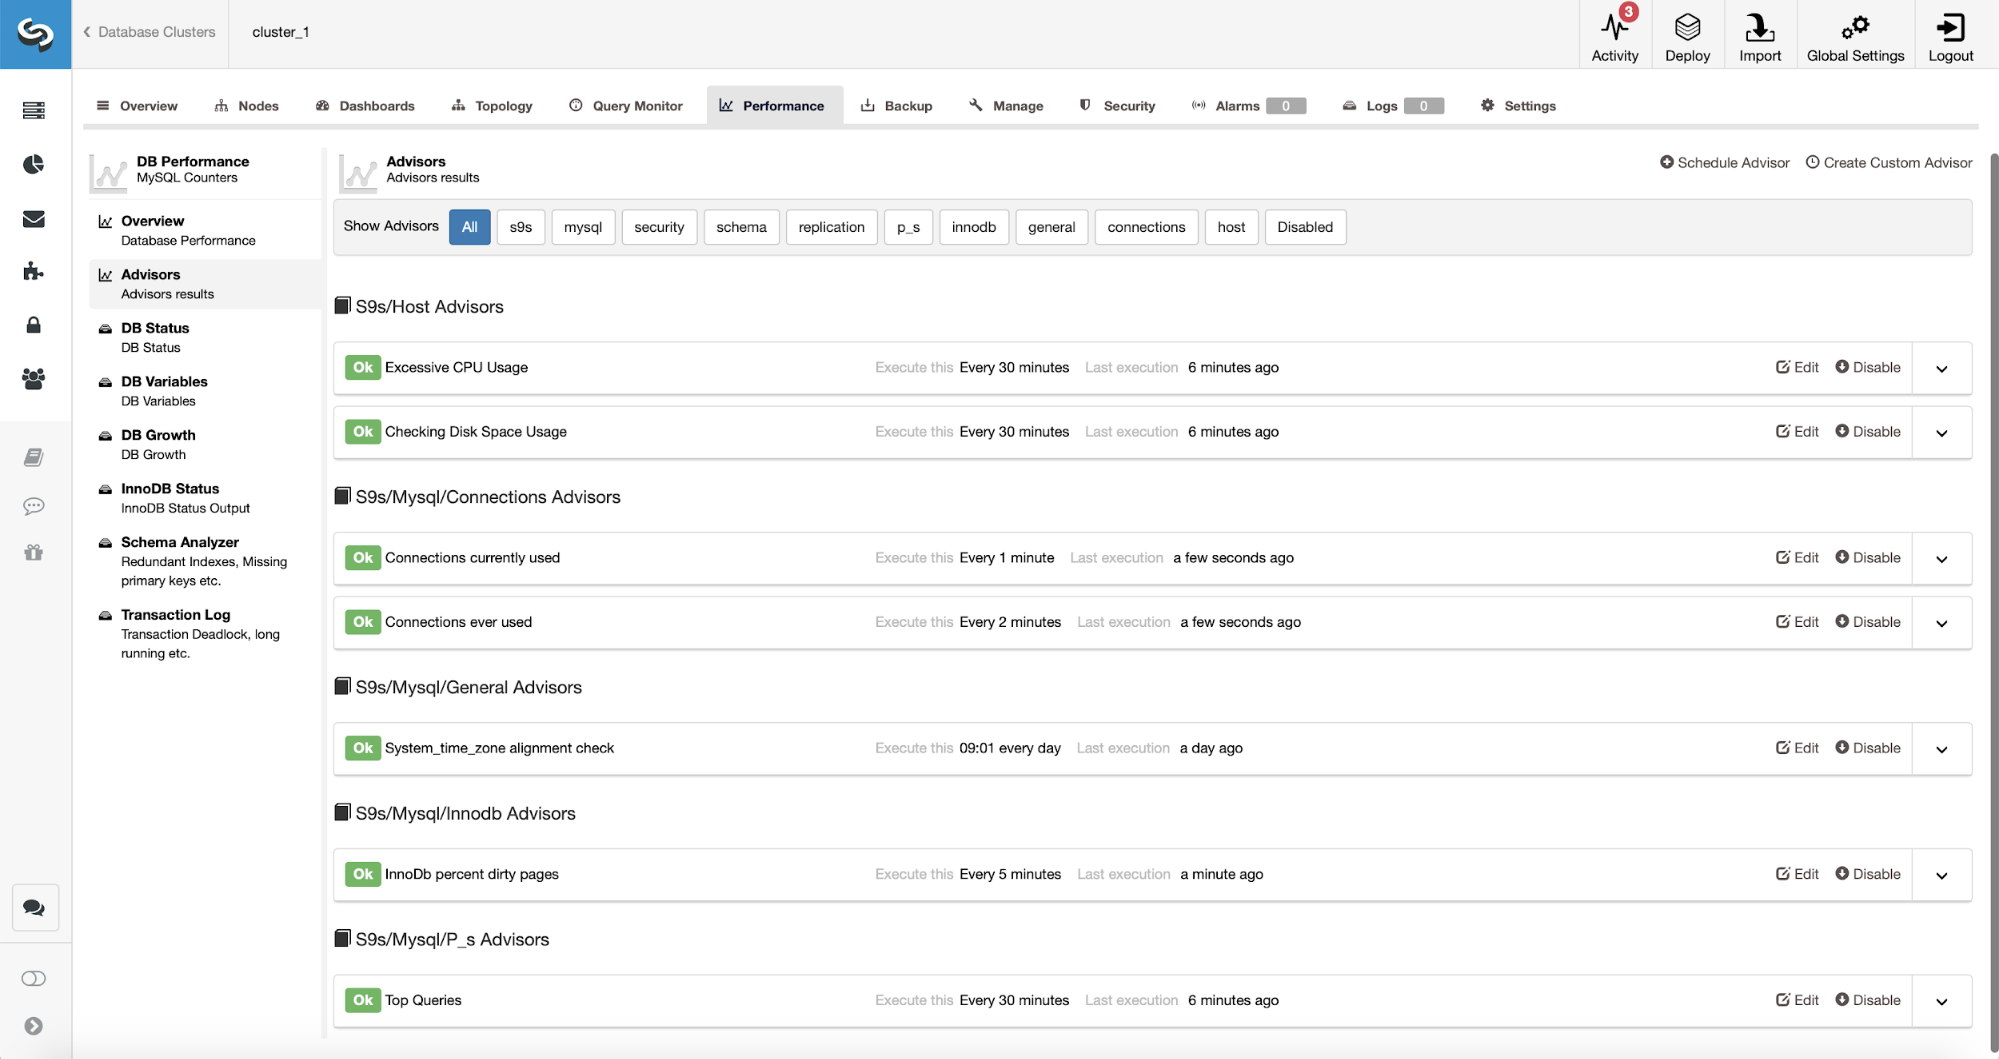
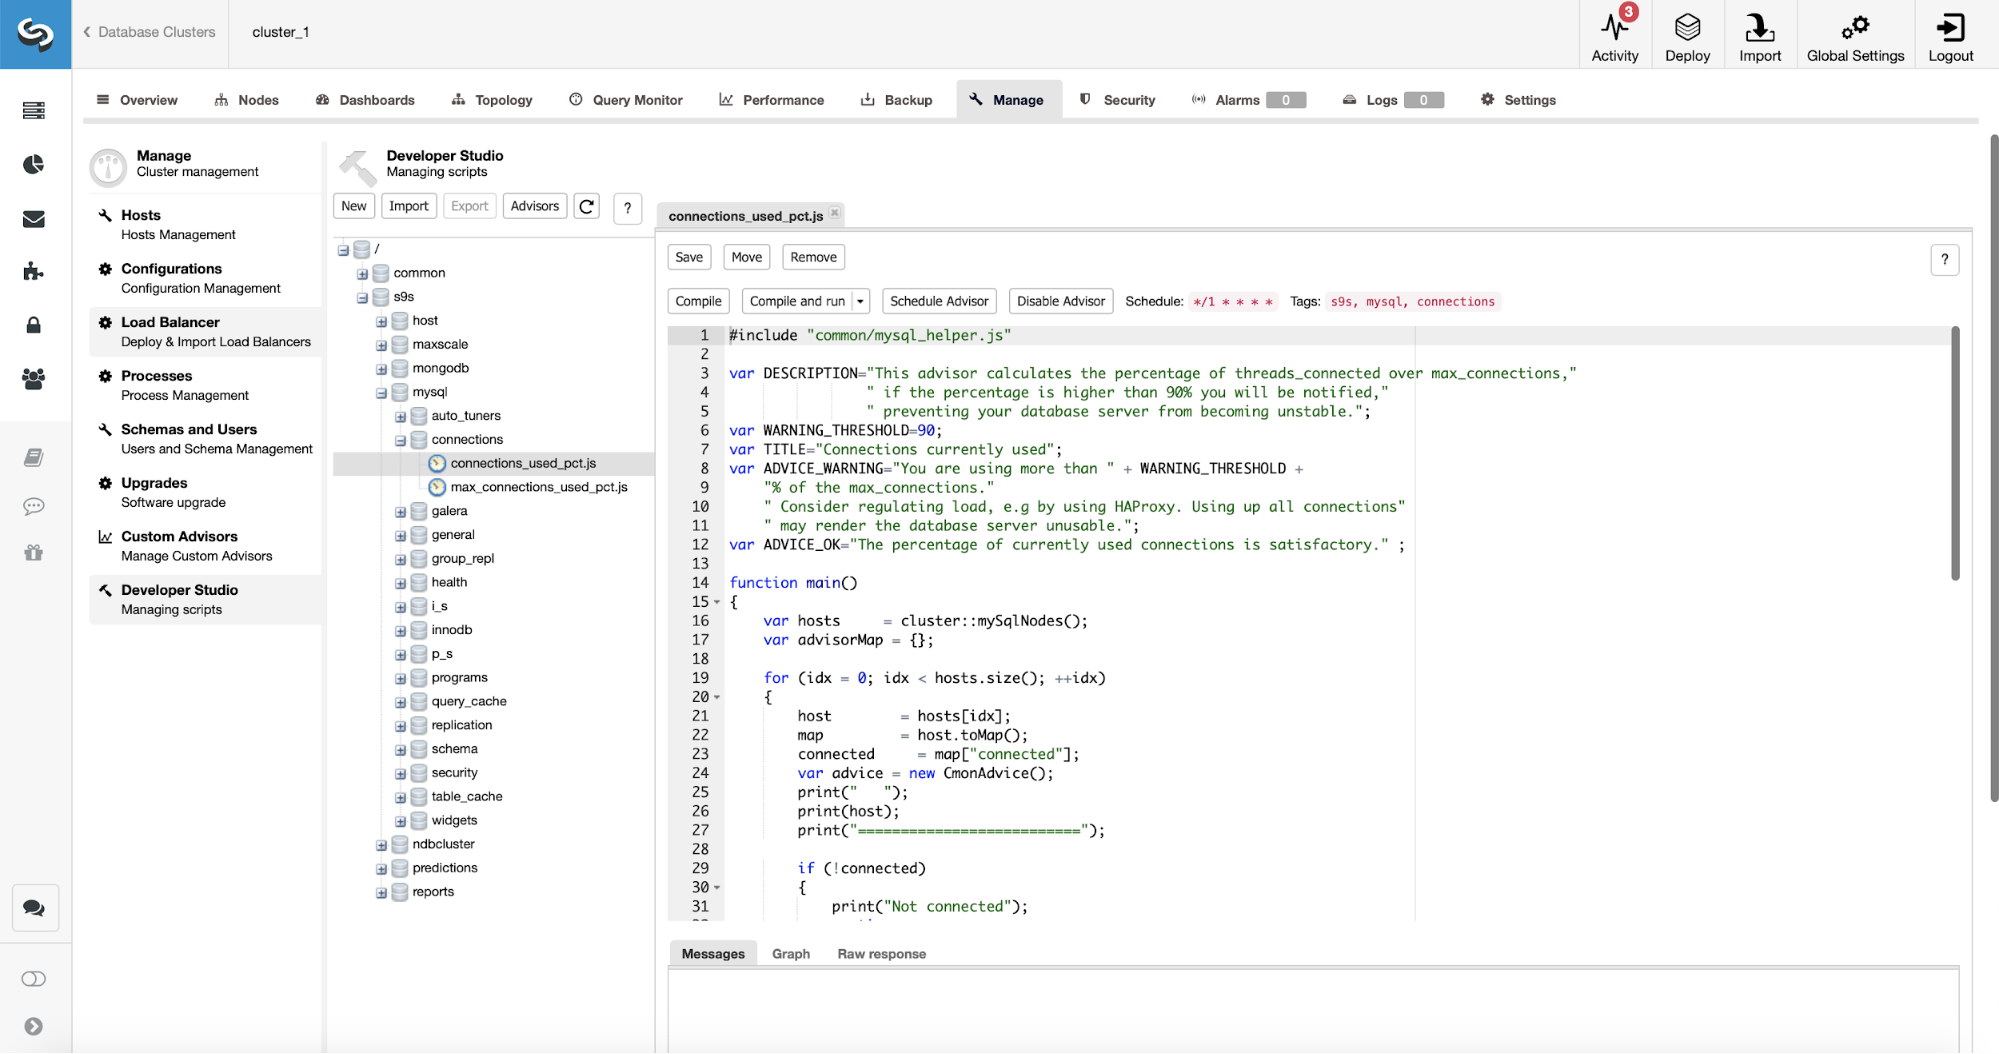
ClusterControl also comes with a list of advisors, which can be used to keep track of the health and performance of the database. You can also easily create new advisors using the Developer Studio:
If you are interested in query performance, ClusterControl provides a Query Monitor for you – executed queries are collected and their performance is compared making it easy for the user to pinpoint which queries use the most of the CPU on the database.
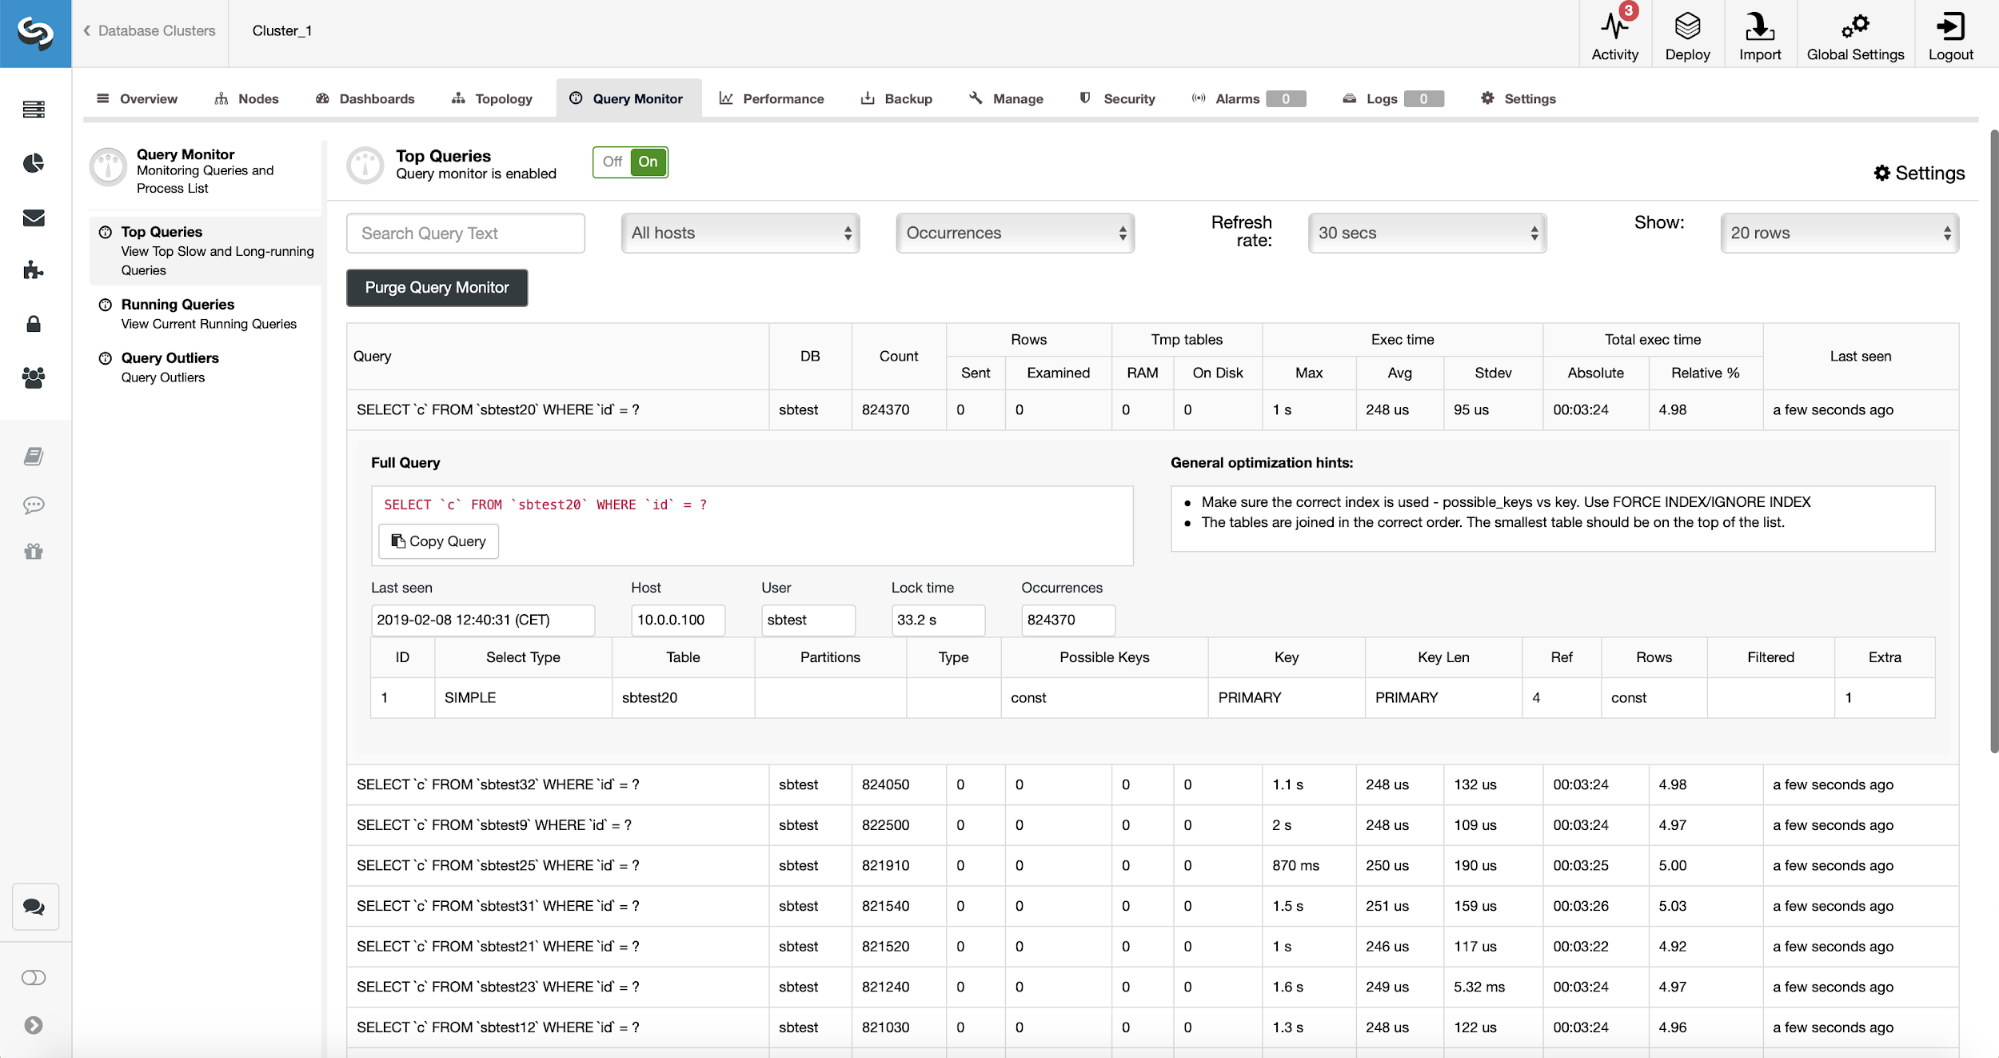
You can see statistic data on the queries – executions, rows sent and examined, execution time. You can also check the explain plan for a particular query type.
Monitoring Polyglot Persistence
One big difference is the ability to monitor all the main variants of the MySQL ecosystem (Oracle MySQL, MariaDB and Percona Server), different clustering technologies (NDB Cluster, Group Replication, asynchronous replication and Galera Cluster), load balancers/proxies (HAProxy, Keepalived, Maxscale, ProxySQL) as well as other open source databases (PostgreSQL and MongoDB).
Automation and Management
ClusterControl also provides functionality to deploy single instances or clusters on-prem or in the cloud (AWS, GCE and Azure), as well as features like backup management, automatic failover and recovery/repair, rolling upgrades, cluster management for replication or cluster setups, scaling, etc.
That’s all for today folks. If you have worked with MySQL Enterprise Monitor and would like to add something, please do so in the comments section.


