blog
Monitoring MySQL Performance with ClusterControl

Monitoring the performance of MySQL databases is a daily task of almost every MySQL DBA. In this blog post we will try to demonstrate how to monitor the performance of your MySQL databases – with ClusterControl.
What Do You Need to Monitor?
In general, if you’re monitoring MySQL performance, you should probably consider monitoring the following things:
- Query Management – monitoring the performance of your queries can prove to be one of the most efficient ways to improve MySQL performance.
- Query Outlier Detection – historical data can tell us a lot: it can even be used to calculate expected query performance based on historical data, then compare the current query performance against the expected performance to detect query outliers.
- Database Schema Performance – ClusterControl can help you optimize the performance of your MySQL instances by providing schema insight to ensure your schemas are optimized for your workload.
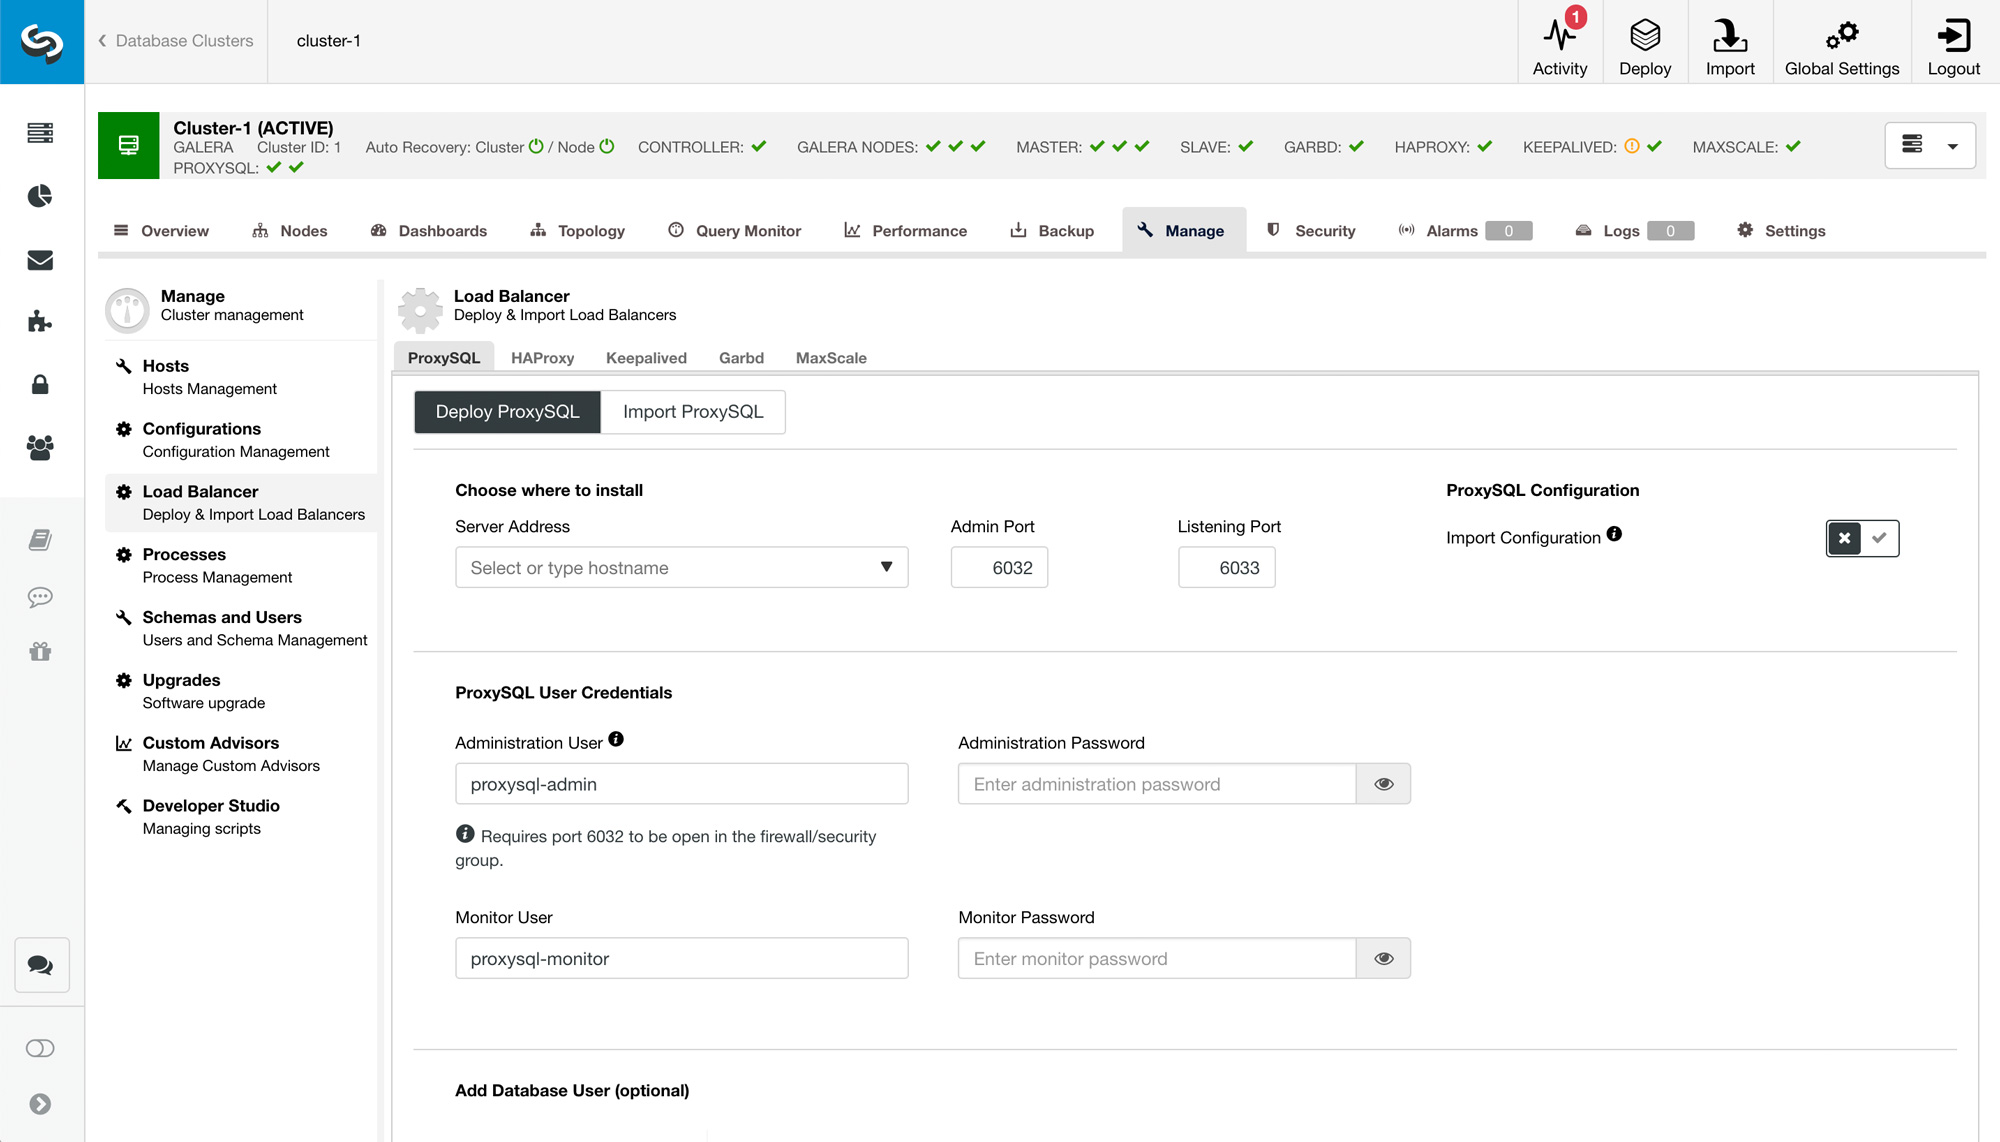
- Load Balancing – load balancers like ProxySQL, HAProxy or MaxScale can make your database perform at the best of its ability. Those load balancers can easily be deployed using ClusterControl.
Database Load Balancing and Query Management Using ClusterControl
ClusterControl supports the following load balancers:
- HAProxy
- MariaDB MaxScale
- ProxySQL
- Keepalived (virtual IP address only)
Do note that ClusterControl must reside on an independent node, separate from your database cluster.
In regards to query management, ClusterControl allows you to absorb the following (you can see these things once you have switched to the Query Monitor tab):
- You can view top slow and long-running queries.
- You can view a list of currently running queries.
- You can view a list of query outliers.
This tab provides you with an aggregated list of all your top queries running on all of the nodes of your database cluster. ClusterControl gets the information in one of these two ways:
- Queries are either retrieved from PERFORMANCE_SCHEMA or
- If PERFORMANCE_SCHEMA is disabled or unavailable, ClusterControl will parse the content of the Slow Query Log.
If the Slow Query Log is in use, only queries that exceed the Long Query Time will be listed here.
Long Query Time collects queries that take longer than Long Query Time seconds to execute (for example, if the Long Query Time is 0.1 only queries that take more than 0.1 seconds to execute will be logged), “log queries not using indexes?” configures the behavior of ClusterControl in regards to queries without indexes etc.
The top queries table is automatically refreshed every 30 seconds (the refresh rate can be changed). The top queries table columns contain a list of sampled queries, database names, the total number of query occurrences, the number of rows involved in operations, the number of temporary tables created for a certain query etc. – the list of the aggregated top queries can also be ordered by Occurence or Execution Time to show either the most common or the slowest queries.
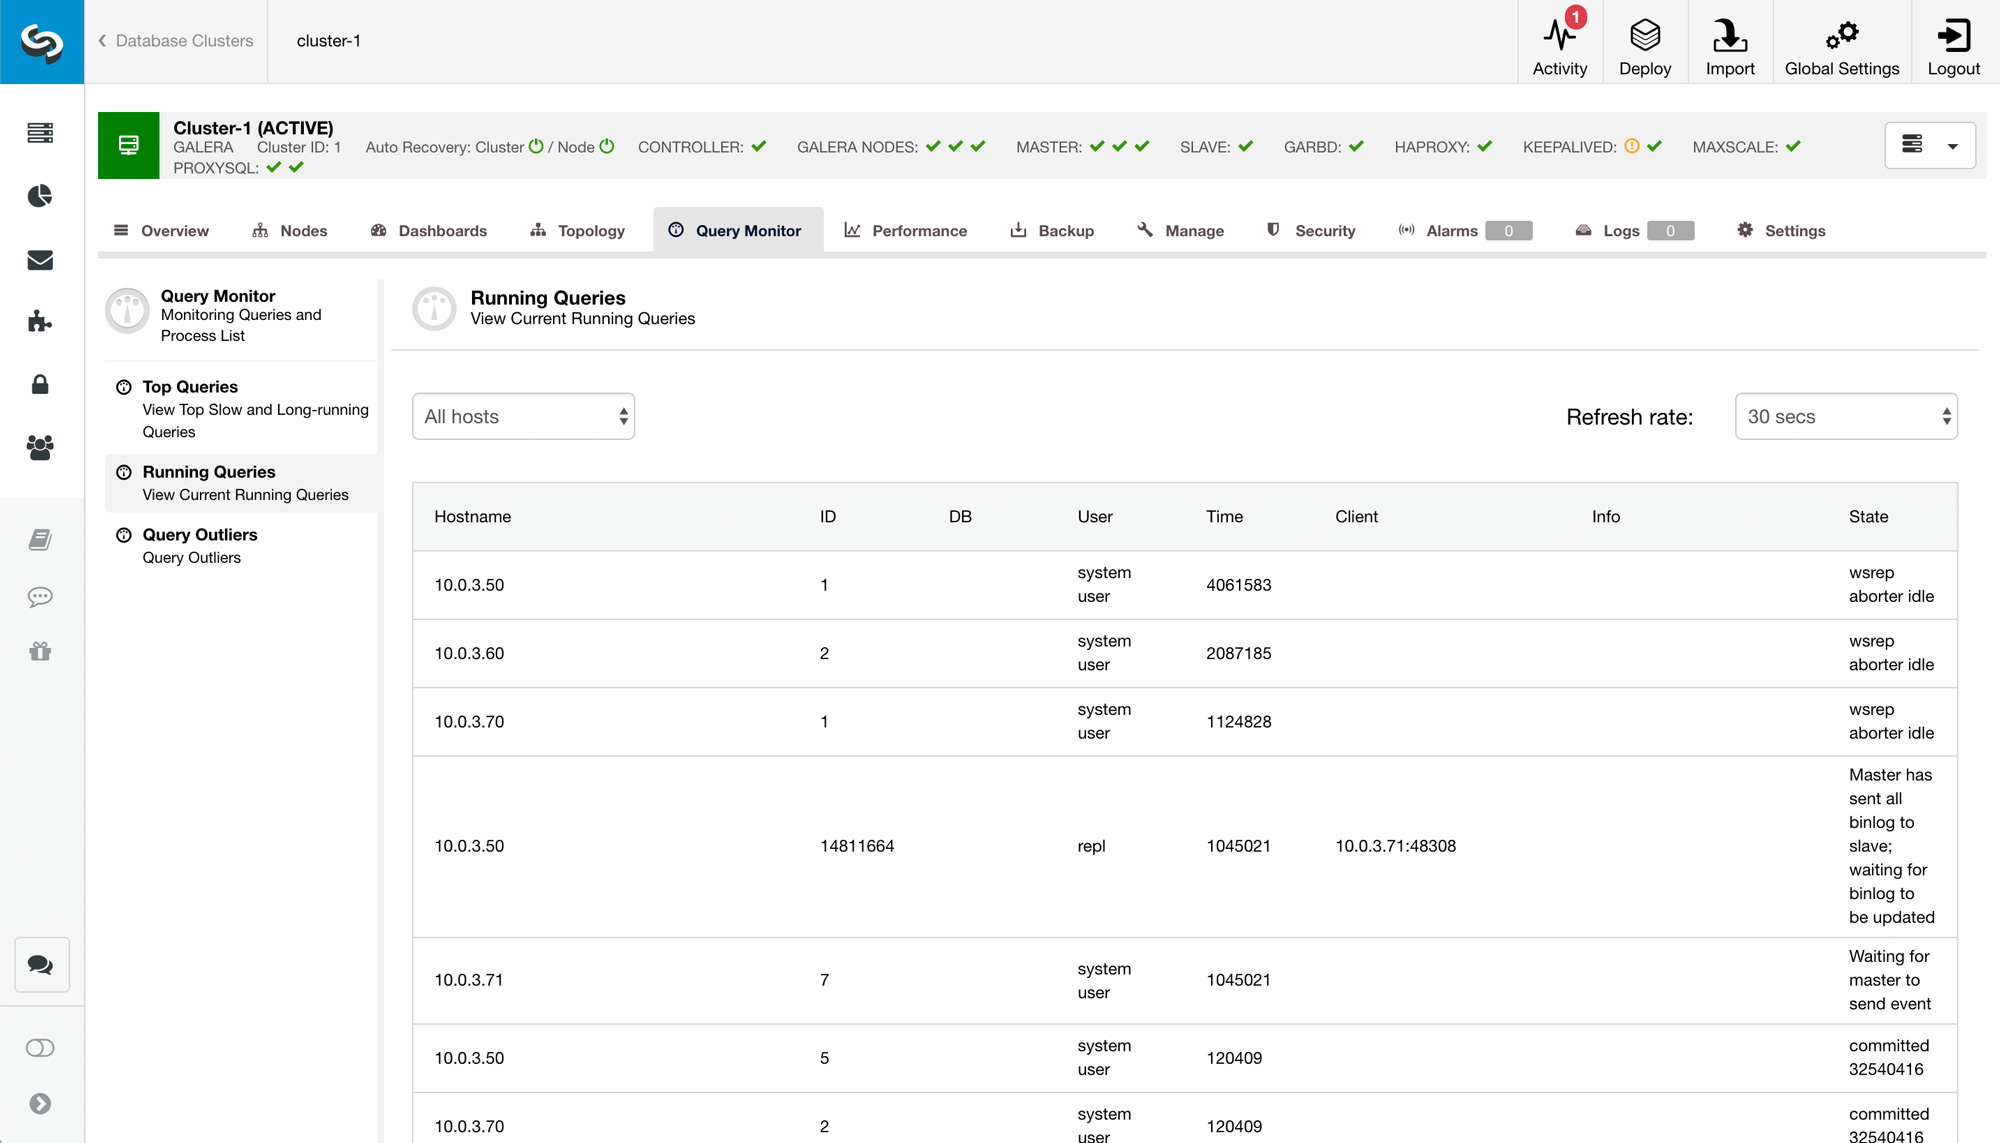
ClusterControl also allows you to view a list of currently running queries. This page is also automatically refreshed every 30 seconds and it displays:
- The MySQL server from which the process is retrieved.
- The connection ID.
- The database name.
- The MySQL user who issued the statement.
- The MySQL thread execution time in seconds.
- The hostname of the client issuing the statement.
- The type of command the thread is executing.
- The state of the thread (as explained in the MySQL documentation)
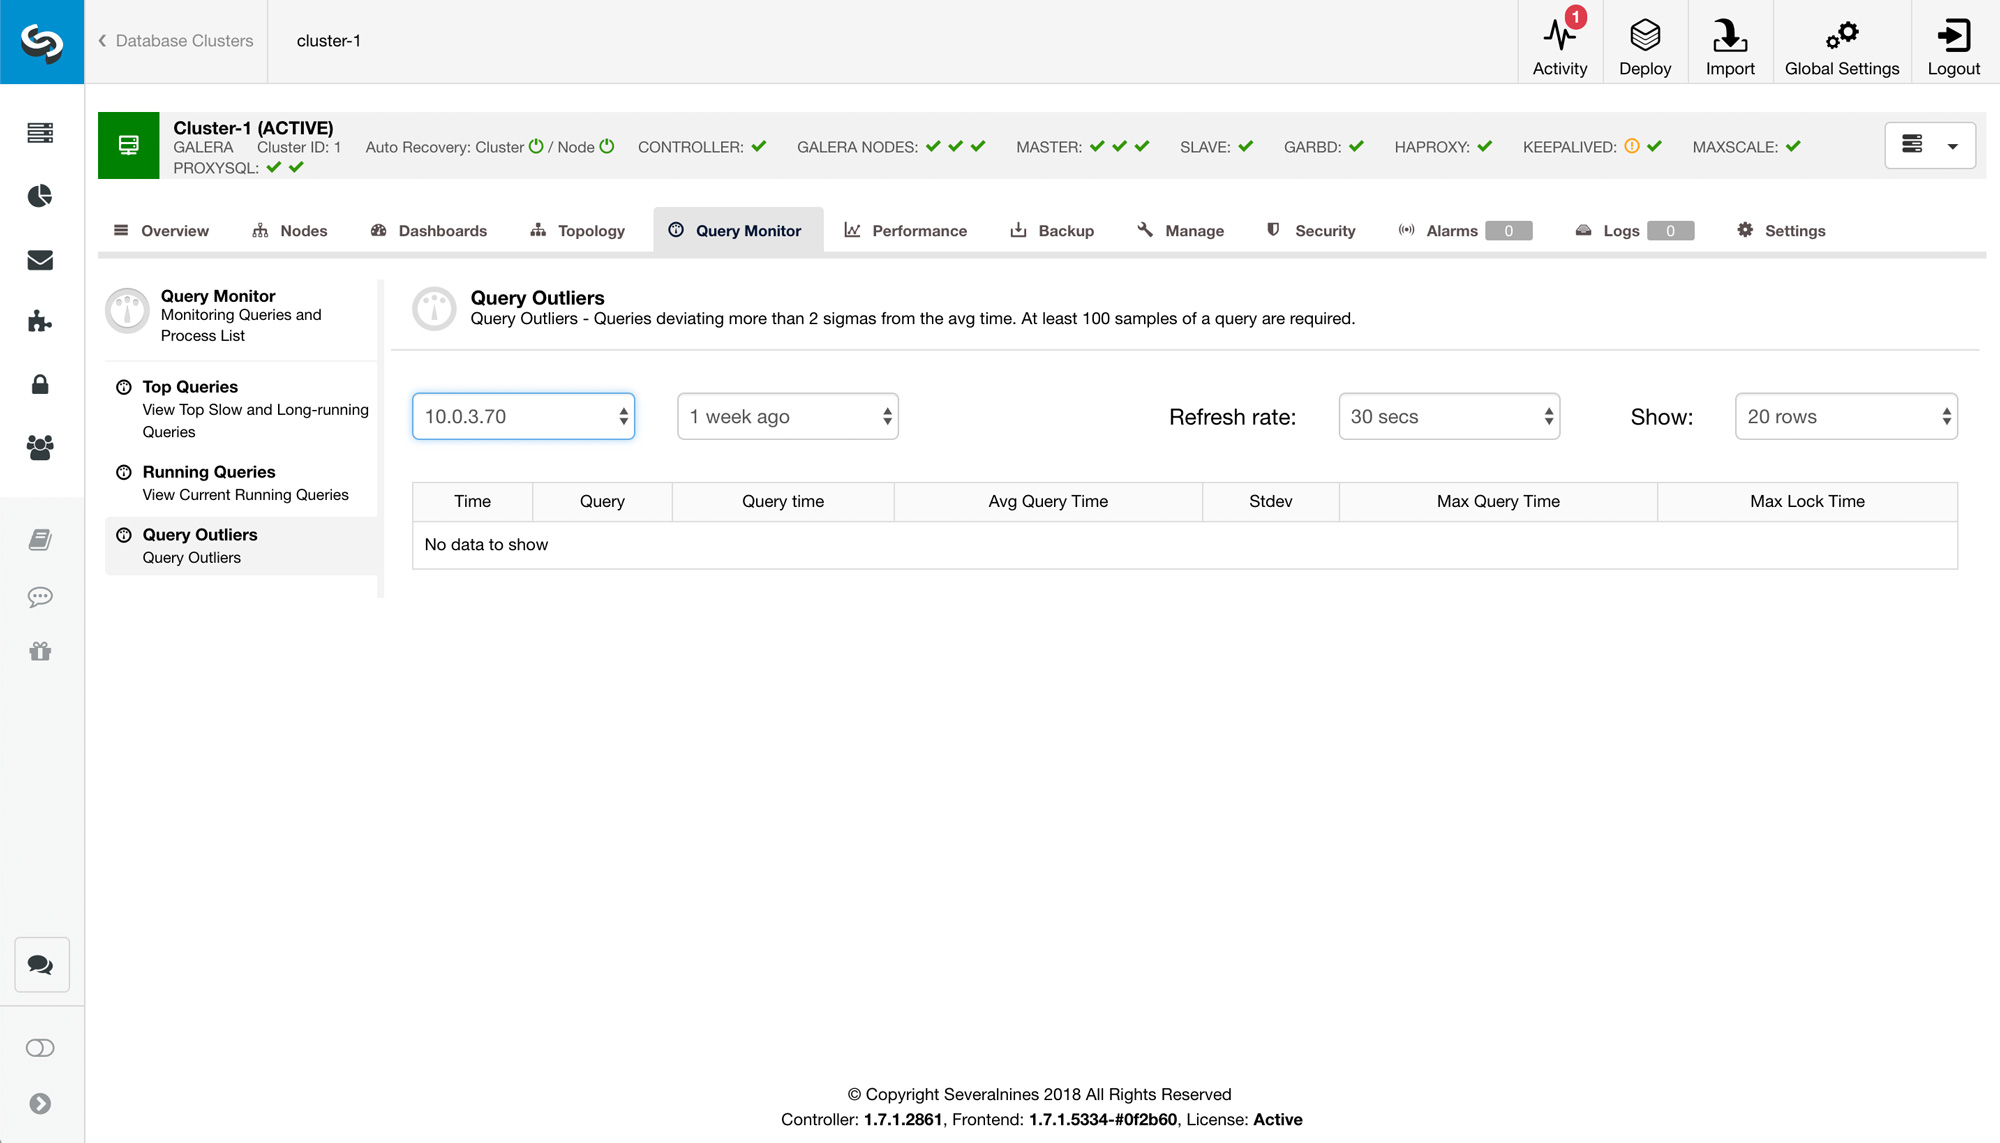
The query outliers page shows queries that are regarded as “outliers”. In other words, this page shows all queries that take more time to execute than a normal query of that type, longer being defined as a latency deviation of 2 sigmas + average_query_time. This page displays:
- The exact time the query was captured.
- The query itself.
- The time that the SQL query took to execute.
- The average execution time of the SQL query.
- The standard deviation execution time (microseconds).
- The query’s maximum execution time (microseconds).
- The query’s lock time (microseconds).
The query monitor tab provides a summary of query processing across all nodes in the cluster.
Summary
When it comes to monitoring the performance of your MySQL databases, ClusterControl can do wonders. ClusterControl can make the deployment of load balancers simple, it can help you easily manage your queries and monitor their performance, ClusterControl can also calculate expected query performance based on historical data.


