blog
Integrating ClusterControl with SNMP : Part Two

This blog post is a continuation of the previous part 1, where we have covered the basics of SNMP integration with ClusterControl.
In this blog post, we are going to focus on SNMP traps and alerting. SNMP traps are the most frequently used alert messages sent from a remote SNMP-enabled device (an agent) to a central collector, the “SNMP manager.” In the case of ClusterControl, a trap could be an alert after the critical alarm for a cluster is not 0, indicating something bad is happening.
As shown in the previous blog post, for the purpose of this proof-of-concept, we have two SNMP trap notifications definition:
criticalAlarmNotification NOTIFICATION-TYPE
    OBJECTS { totalCritical, clusterId }
    STATUS current
    DESCRIPTION
        "Notification if critical alarm is not 0"
    ::= { alarmNotification 1 }

criticalAlarmNotificationEnded NOTIFICATION-TYPE
    OBJECTS { totalCritical, clusterId }
    STATUS  current
    DESCRIPTION
        "Notification ended - Critical alarm is 0"
    ::= { alarmNotification 2 }
The notifications (or traps) are criticalAlarmNotification and criticalAlarmNotificationEnded. Both notification events can be used to signal our Nagios service, whether the cluster is actively having critical alarms or not. In Nagios, the term for this is passive check, whereby Nagios does not attempt to determine whether or host/service is DOWN or UNREACHABLE. We will also configure the active checks, where checks are initiated by the check logic in the Nagios daemon by using the service definition to also monitor the critical/warning alarms reported by our cluster.
Take note that this blog post requires the Severalnines MIB and SNMP agent configured correctly as shown in the first part of this blog series.
Installing Nagios Core
Nagios Core is the free version of the Nagios monitoring suite. First and foremost, we have to install it and all necessary packages, followed by the Nagios plugins, snmptrapd and snmptt. Note that instructions in this blog post are assuming all nodes are running on CentOS 7.
Install the necessary packages to run Nagios:
$ yum -y install httpd php gcc glibc glibc-common wget perl gd gd-devel unzip zip sendmail net-snmp-utils net-snmp-perlCreate a nagios user and nagcmd group for allowing the external commands to be executed through the web interface, add the nagios and apache user to be a part of the nagcmd group:
$ useradd nagios
$ groupadd nagcmd
$ usermod -a -G nagcmd nagios
$ usermod -a -G nagcmd apache
Download the latest version of Nagios Core from here, compile and install it:
$ cd ~
$ wget https://assets.nagios.com/downloads/nagioscore/releases/nagios-4.4.6.tar.gz
$ tar -zxvf nagios-4.4.6.tar.gz
$ cd nagios-4.4.6
$ ./configure --with-nagios-group=nagios --with-command-group=nagcmd
$ make all
$ make install
$ make install-init
$ make install-config
$ make install-commandmode
Install the Nagios web configuration:
$ make install-webconfOptionally, install the Nagios exfoliation theme (or you could stick to the default theme):
$ make install-exfoliationCreate a user account (nagiosadmin) for logging into the Nagios web interface. Remember the password that you assign to this user:
$ htpasswd -c /usr/local/nagios/etc/htpasswd.users nagiosadminRestart Apache webserver to make the new settings take effect:
$ systemctl restart httpd
$ systemctl enable httpd
Download the Nagios Plugins from here, compile and install it:
$ cd ~
$ wget https://nagios-plugins.org/download/nagios-plugins-2.3.3.tar.gz
$ tar -zxvf nagios-plugins-2.3.3.tar.gz
$ cd nagios-plugins-2.3.3
$ ./configure --with-nagios-user=nagios --with-nagios-group=nagios
$ make
$ make install
Verify the default Nagios configuration files:
$ /usr/local/nagios/bin/nagios -v /usr/local/nagios/etc/nagios.cfg

Nagios Core 4.4.6
Copyright (c) 2009-present Nagios Core Development Team and Community Contributors
Copyright (c) 1999-2009 Ethan Galstad
Last Modified: 2020-04-28
License: GPL
Website: https://www.nagios.org
Reading configuration data...
   Read main config file okay...
   Read object config files okay...
Running pre-flight check on configuration data...
Checking objects...
Checked 8 services.
Checked 1 hosts.
Checked 1 host groups.
Checked 0 service groups.
Checked 1 contacts.
Checked 1 contact groups.
Checked 24 commands.
Checked 5 time periods.
Checked 0 host escalations.
Checked 0 service escalations.
Checking for circular paths...
Checked 1 hosts
Checked 0 service dependencies
Checked 0 host dependencies
Checked 5 timeperiods
Checking global event handlers...
Checking obsessive compulsive processor commands...
Checking misc settings...
Total Warnings: 0
Total Errors:   0
Things look okay - No serious problems were detected during the pre-flight check
If everything looks okay, start Nagios and configure it to start on boot:
$ systemctl start nagios
$ systemctl enable nagios
Open the browser and go to http://{IPaddress}/nagios and you should see an HTTP basic authentication pops up where you need to specify the username as nagiosadmin with your chosen password created earlier.
Adding ClusterControl server into Nagios
Create a Nagios host definition file for ClusterControl:
$ vim /usr/local/nagios/etc/objects/clustercontrol.cfgAnd add the following lines:
define host {
        use                     linux-server
        host_name               clustercontrol.local
        alias                   clustercontrol.mydomain.org
        address                 192.168.10.50
}

define service {
        use                     generic-service
        host_name               clustercontrol.local
        service_description     Critical alarms - ClusterID 23
        check_command           check_snmp! -H 192.168.10.50 -P 2c -C private -o .1.3.6.1.4.1.57397.1.1.1.2 -c0
}

define service {
        use                     generic-service
        host_name               clustercontrol.local
        service_description     Warning alarms - ClusterID 23
        check_command           check_snmp! -H 192.168.10.50 -P 2c -C private -o .1.3.6.1.4.1.57397.1.1.1.3 -w0
}


define service {
        use                     snmp_trap_template
        host_name               clustercontrol.local
        service_description     Critical alarm traps
        check_interval          60 ; Don't clear for 1 hour
}
Some explanations:
-
In the first section, we define our host, with the hostname and address of the ClusterControl server.
-
The service sections where we put our service definitions to be monitored by the Nagios. The first two is basically telling the service to check the SNMP output for a particular object ID. The first service is about the critical alarm, therefore we add -c0 in the check_snmp command to indicate that it should be a critical alert in Nagios if the value goes beyond 0. While for the warning alarms, we will indicate it with a warning if the value is 1 and higher.
-
The last service definition is about the SNMP traps that we would expect coming from the ClusterControl server if the critical alarm raised is higher than 0. This section will use the snmp_trap_template definition, as shown in the next step.
Configure the snmp_trap_template by adding the following lines into /usr/local/nagios/etc/objects/templates.cfg:
define service {
        name                            snmp_trap_template
        service_description             SNMP Trap Template
        active_checks_enabled           1       ; Active service checks are enabled
        passive_checks_enabled          1       ; Passive service checks are enabled/accepted
        parallelize_check               1       ; Active service checks should be parallelized
        process_perf_data               0
        obsess_over_service             0       ; We should obsess over this service (if necessary)
        check_freshness                 0       ; Default is to NOT check service 'freshness'
        notifications_enabled           1       ; Service notifications are enabled
        event_handler_enabled           1       ; Service event handler is enabled
        flap_detection_enabled          1       ; Flap detection is enabled
        process_perf_data               1       ; Process performance data
        retain_status_information       1       ; Retain status information across program restarts
        retain_nonstatus_information    1       ; Retain non-status information across program restarts
        check_command                   check-host-alive      ; This will be used to reset the service to "OK"
        is_volatile                     1
        check_period                    24x7
        max_check_attempts              1
        normal_check_interval           1
        retry_check_interval            1
        notification_interval           60
        notification_period             24x7
        notification_options            w,u,c,r
        contact_groups                  admins       ; Modify this to match your Nagios contactgroup definitions
        register                        0
}
Include the ClusterControl configuration file into Nagios, by adding the following line inside
/usr/local/nagios/etc/nagios.cfg:
cfg_file=/usr/local/nagios/etc/objects/clustercontrol.cfg
Run a pre-flight configuration check:
$ /usr/local/nagios/bin/nagios -v /usr/local/nagios/etc/nagios.cfgMake sure you get the following line at the end of the output:
"Things look okay - No serious problems were detected during the pre-flight check"Restart Nagios to load the change:
$ systemctl restart nagiosNow if we look at the Nagios page under the Service section (left-side menu), we would see something like this:
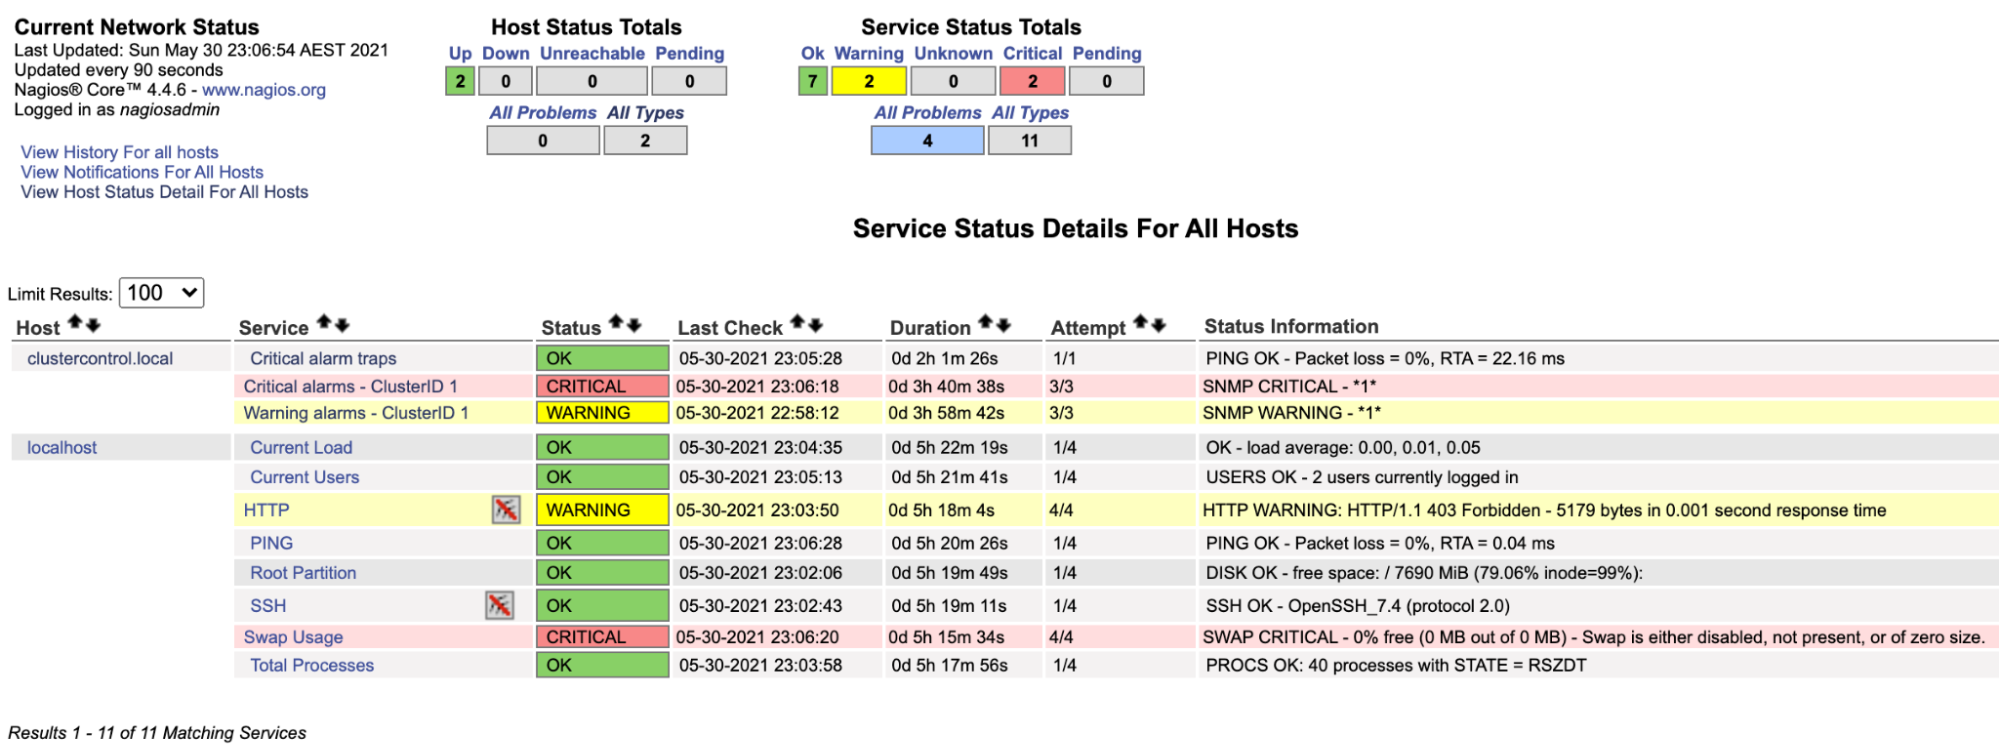
Notice the “Critical alarms – ClusterID 1” row turns red if the critical alarm value reported by ClusterControl is bigger than 0, while the “Warning alarms – ClusterID 1” is yellow, indicating that there is a warning alarm raised. In case if nothing interesting happens, you would see everything is green for clustercontrol.local.
Configuring Nagios to receive a trap
Traps are sent by remote devices to the Nagios server, this is called a passive check. Ideally, we don’t know when a trap will be sent as it depends on the sending device decides it will send a trap. For example with a UPS (battery backup), as soon as the device loses power, it will send a trap to say “hey, I lost power”. This way Nagios is informed immediately.
In order to receive SNMP traps, we need to configure the Nagios server with the following things:
-
snmptrapd (SNMP trap receiver daemon)
-
snmptt (SNMP Trap Translator, the trap handler daemon)
After the snmptrapd receives a trap, it will pass it to snmptt where we will configure it to update the Nagios system and then Nagios will send out the alert according to the contact group configuration.
Install EPEL repository, followed by the necessary packages:
$ yum -y install epel-release
$ yum -y install net-snmp snmptt net-snmp-perl perl-Sys-Syslog
Configure the SNMP trap daemon at /etc/snmp/snmptrapd.conf and set the following lines:
disableAuthorization yes
traphandle default /usr/sbin/snmptthandler
The above simply means traps received by the snmptrapd daemon will be passed over to /usr/sbin/snmptthandler.
Add the SEVERALNINES-CLUSTERCONTROL-MIB.txt into /usr/share/snmp/mibs by creating /usr/share/snmp/mibs/SEVERALNINES-CLUSTERCONTROL-MIB.txt:
$ ll /usr/share/snmp/mibs/SEVERALNINES-CLUSTERCONTROL-MIB.txt
-rw-r--r-- 1 root root 4029 May 30 20:08 /usr/share/snmp/mibs/SEVERALNINES-CLUSTERCONTROL-MIB.txt
Create /etc/snmp/snmp.conf (notice without the “d”) and add our custom MIB there:
mibs +SEVERALNINES-CLUSTERCONTROL-MIBStart the snmptrapd service:
$ systemctl start snmptrapd
$ systemctl enable snmptrapd
Next, we need to configure the following configuration lines inside /etc/snmp/snmptt.ini:
net_snmp_perl_enable = 1
snmptt_conf_files = <
Note that we enabled the net_snmp_perl module and have added another configuration path, /etc/snmp/snmptt-cc.conf inside snmptt.ini. We need to define ClusterControl snmptt events here so they can be passed to Nagios. Create a new file at /etc/snmp/snmptt-cc.conf and add the following lines:
MIB: SEVERALNINES-CLUSTERCONTROL-MIB (file:/usr/share/snmp/mibs/SEVERALNINES-CLUSTERCONTROL-MIB.txt) converted on Sun May 30 19:17:33 2021 using snmpttconvertmib v1.4.2

EVENT criticalAlarmNotification .1.3.6.1.4.1.57397.1.1.3.1 "Status Events" Critical
FORMAT Notification if the critical alarm is not 0
EXEC /usr/local/nagios/share/eventhandlers/submit_check_result $aA "Critical alarm traps" 2 "Critical - Critical alarm is $1 for cluster ID $2"
SDESC
Notification if critical alarm is not 0
Variables:
  1: totalCritical
  2: clusterId
EDESC

EVENT criticalAlarmNotificationEnded .1.3.6.1.4.1.57397.1.1.3.2 "Status Events" Normal
FORMAT Notification if the critical alarm is not 0
EXEC /usr/local/nagios/share/eventhandlers/submit_check_result $aA "Critical alarm traps" 0 "Normal - Critical alarm is $1 for cluster ID $2"
SDESC
Notification ended - critical alarm is 0
Variables:
  1: totalCritical
  2: clusterId
EDESC
Some explanations:
-
We have two traps defined – criticalAlarmNotification and criticalAlarmNotificationEnded.
-
The criticalAlarmNotification simply raises a critical alert and passes it to the “Critical alarm traps” service defined in Nagios. The $aA means to return the trap agent IP address. The value 2 is the check result value which in this case is critical (0=OK, 1=WARNING, 2=CRITICAL, 3=UNKNOWN).
-
The criticalAlarmNotificationEnded simply raises an OK alert and passes it to the “Critical alarm traps” service, to cancel the previous trap after everything backs to normal. The $aA means to return the trap agent IP address. The value 0 is the check result value which in this case is OK. For more details on string substitutions recognized by snmptt, check out this article under the “FORMAT” section.
-
You may use snmpttconvertmib to generate snmptt event handler file for a particular MIB.
Note that by default, the eventhandlers path is not provided by the Nagios Core. Therefore, we have to copy that eventhandlers directory from the Nagios source under the contrib directory, as shown below:
$ cp -Rf nagios-4.4.6/contrib/eventhandlers /usr/local/nagios/share/
$ chown -Rf nagios:nagios /usr/local/nagios/share/eventhandlers
We also need to assign snmptt group as part of the nagcmd group, so it can execute the nagios.cmd inside the submit_check_result script:
$ usermod -a -G nagcmd snmpttStart the snmptt service:
$ systemctl start snmptt
$ systemctl enable snmptt
The SNMP Manager (Nagios server) is now ready to accept and process our incoming SNMP traps.
Sending a trap from the ClusterControl server
Suppose one wants to send an SNMP trap to the SNMP manager, 192.168.10.11 (Nagios server) because the total number of critical alarms has reached 2 for cluster ID 1, one would run the following command on the ClusterControl server (client-side), 192.168.10.50:
$ snmptrap -v2c -c private 192.168.10.11 '' SEVERALNINES-CLUSTERCONTROL-MIB::criticalAlarmNotification
SEVERALNINES-CLUSTERCONTROL-MIB::totalCritical i 2
SEVERALNINES-CLUSTERCONTROL-MIB::clusterId i 1
Or, in OID format (recommended):
$ snmptrap -v2c -c private 192.168.10.11 '' .1.3.6.1.4.1.57397.1.1.3.1
.1.3.6.1.4.1.57397.1.1.1.2 i 2
.1.3.6.1.4.1.57397.1.1.1.4 i 1
Where, .1.3.6.1.4.1.57397.1.1.3.1 is equal to criticalAlarmNotification trap event, and the subsequent OIDs are representations of the total number of the current critical alarms and the cluster ID, respectively.
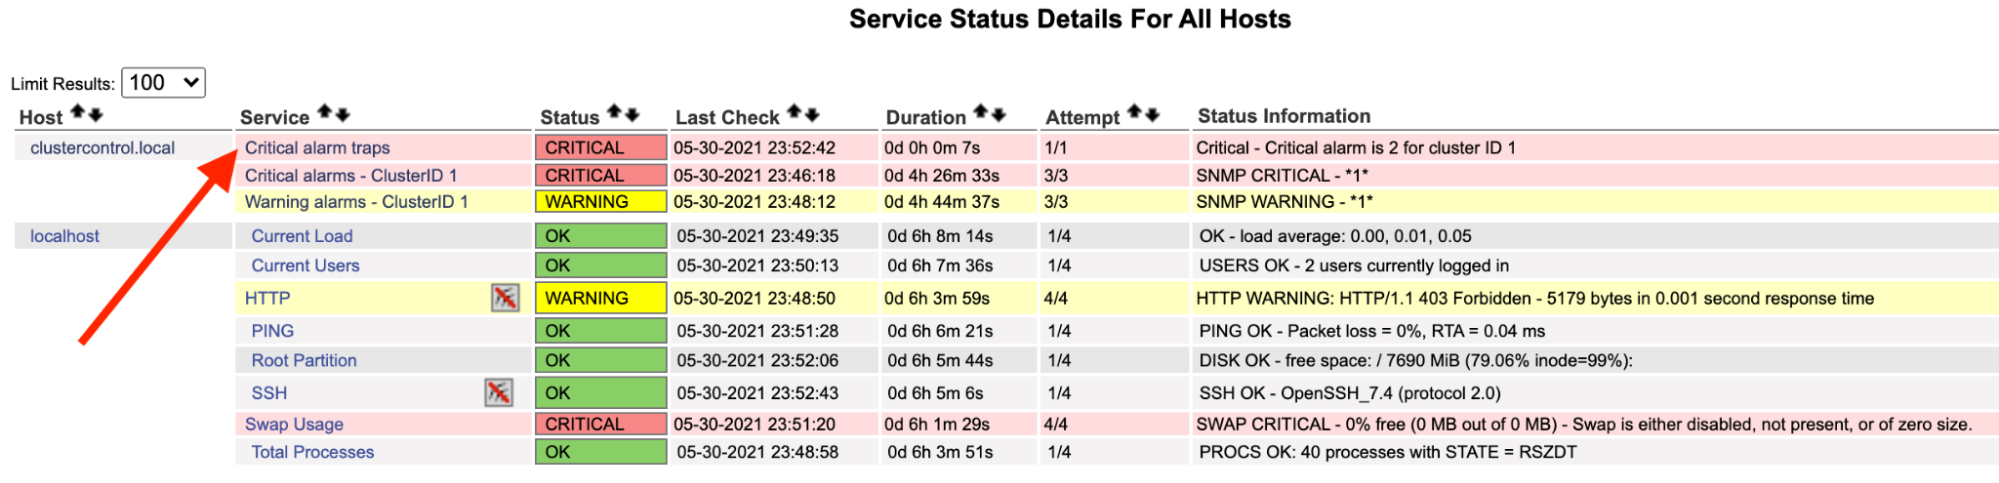
On the Nagios server, you should notice the trap service has turned red:
You can also see it in the /var/log/messages of the following line:
May 30 23:52:39 ip-10-15-2-148 snmptrapd[27080]: 2021-05-30 23:52:39 UDP: [192.168.10.50]:33151->[192.168.10.11]:162 [UDP: [192.168.10.50]:33151->[192.168.10.11]:162]:#012DISMAN-EVENT-MIB::sysUpTimeInstance = Timeticks: (2423020) 6:43:50.20#011SNMPv2-MIB::snmpTrapOID.0 = OID: SEVERALNINES-CLUSTERCONTROL-MIB::criticalAlarmNotification#011SEVERALNINES-CLUSTERCONTROL-MIB::totalCritical = INTEGER: 2#011SEVERALNINES-CLUSTERCONTROL-MIB::clusterId = INTEGER: 1
May 30 23:52:42 nagios.local snmptt[29557]: .1.3.6.1.4.1.57397.1.1.3.1 Critical "Status Events" UDP192.168.10.5033151-192.168.10.11162 - Notification if critical alarm is not 0
May 30 23:52:42 nagios.local nagios: EXTERNAL COMMAND: PROCESS_SERVICE_CHECK_RESULT;192.168.10.50;Critical alarm traps;2;Critical - Critical alarm is 2 for cluster ID 1
May 30 23:52:42 nagios.local nagios: PASSIVE SERVICE CHECK: clustercontrol.local;Critical alarm traps;0;PING OK - Packet loss = 0%, RTA = 22.16 ms
May 30 23:52:42 nagios.local nagios: SERVICE NOTIFICATION: nagiosadmin;clustercontrol.local;Critical alarm traps;CRITICAL;notify-service-by-email;Critical - Critical alarm is 2 for cluster ID 1
May 30 23:52:42 nagios.local nagios: SERVICE ALERT: clustercontrol.local;Critical alarm traps;CRITICAL;HARD;1;Critical - Critical alarm is 2 for cluster ID 1
Once the alarm has resolved, to send a normal trap, we may execute the following command:
$ snmptrap -c private -v2c 192.168.10.11 '' .1.3.6.1.4.1.57397.1.1.3.2
.1.3.6.1.4.1.57397.1.1.1.2 i 0
.1.3.6.1.4.1.57397.1.1.1.4 i 1
Where, .1.3.6.1.4.1.57397.1.1.3.2 is equal to criticalAlarmNotificationEnded event, and the subsequent OIDs are representations of the total number of the current critical alarms (should be 0 for this case) and the cluster ID, respectively.
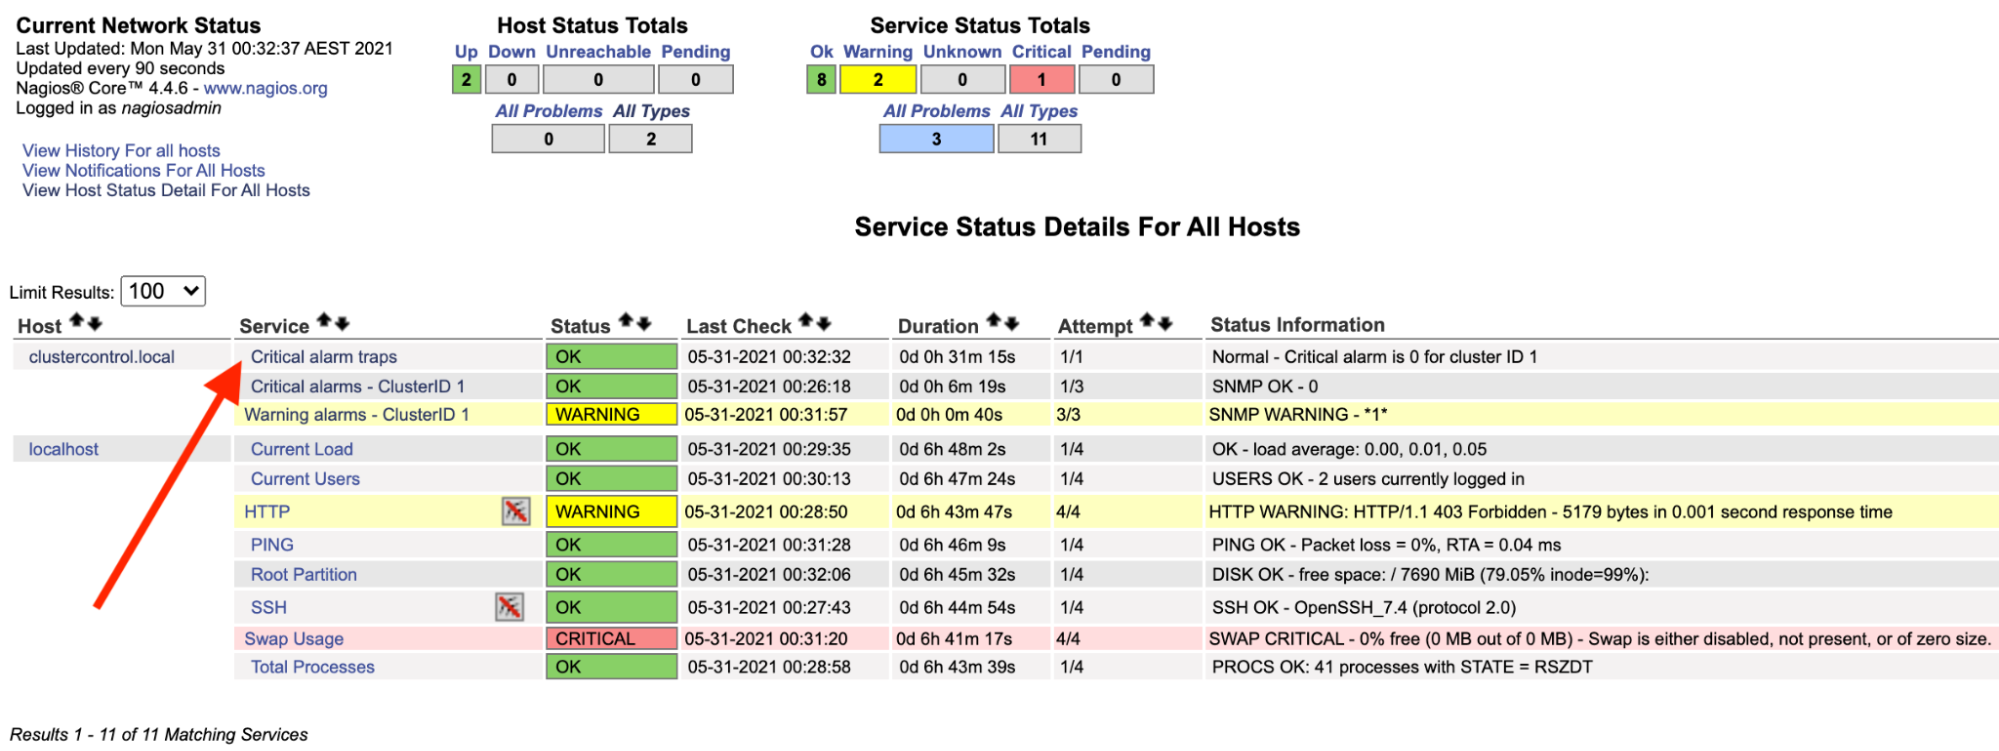
On the Nagios server, you should notice the trap service is back to green:
The above can be automated with a simple bash script:
#!/bin/bash
# alarmtrapper.bash - SNMP trapper for ClusterControl alarms

CLUSTER_ID=1
SNMP_MANAGER=192.168.10.11
INTERVAL=10

send_critical_snmp_trap() {
        # send critical trap
        local val=$1
        snmptrap -v2c -c private ${SNMP_MANAGER} '' .1.3.6.1.4.1.57397.1.1.3.1 .1.3.6.1.4.1.57397.1.1.1.1 i ${val} .1.3.6.1.4.1.57397.1.1.1.4 i ${CLUSTER_ID}
}

send_zero_critical_snmp_trap() {
        # send OK trap
        snmptrap -v2c -c private ${SNMP_MANAGER} '' .1.3.6.1.4.1.57397.1.1.3.2 .1.3.6.1.4.1.57397.1.1.1.1 i 0 .1.3.6.1.4.1.57397.1.1.1.4 i ${CLUSTER_ID}
}

while true; do
        count=$(s9s alarm --list --long --cluster-id=${CLUSTER_ID} --batch | grep CRITICAL | wc -l)
        [ $count -ne 0 ] && send_critical_snmp_trap $count || send_zero_critical_snmp_trap
        sleep $INTERVAL
done
To run the script in the background, simply do:
$ bash alarmtrapper.bash &At this point, we should be able to see Nagios’s “Critical alarm traps” service in action if there is a failure in our cluster automatically.
Final Thoughts
In this blog series, we have shown a proof-of-concept on how ClusterControl can be configured for monitoring, generating/processing traps and alerting using SNMP protocol. This also marks the beginning of our journey to incorporate SNMP in our future releases. Stay tuned as we will bring more updates on this exciting feature.


