blog
How to Monitor Your Databases with ClusterControl and VictorOps

ClusterControl is used for monitoring and managing open source databases, and it does not live on its own island. There are options to integrate with external tools and extend what you can achieve using those dedicated tools. In this blog, we are going to explain one of the integrations that is directly supported in ClusterControl – VictorOps (which is not part of the splunk family of products)
What is VictorOps ?
VictorOps is an incident response software that automates alerts, centralizes information and supports critical documentation for ops teams. We can integrate with log management, monitoring, chat tools and more, for a single-pane of glass into system health.
prerequisites
As part of this integration, we need to do the below action items.
- Create a required team along with members.
- Configure REST API on VictorOps.
Once it’s done, the next step will be to set up the integration in ClusterControl.
Go to ClusterControl Dashboards –>Integrations.
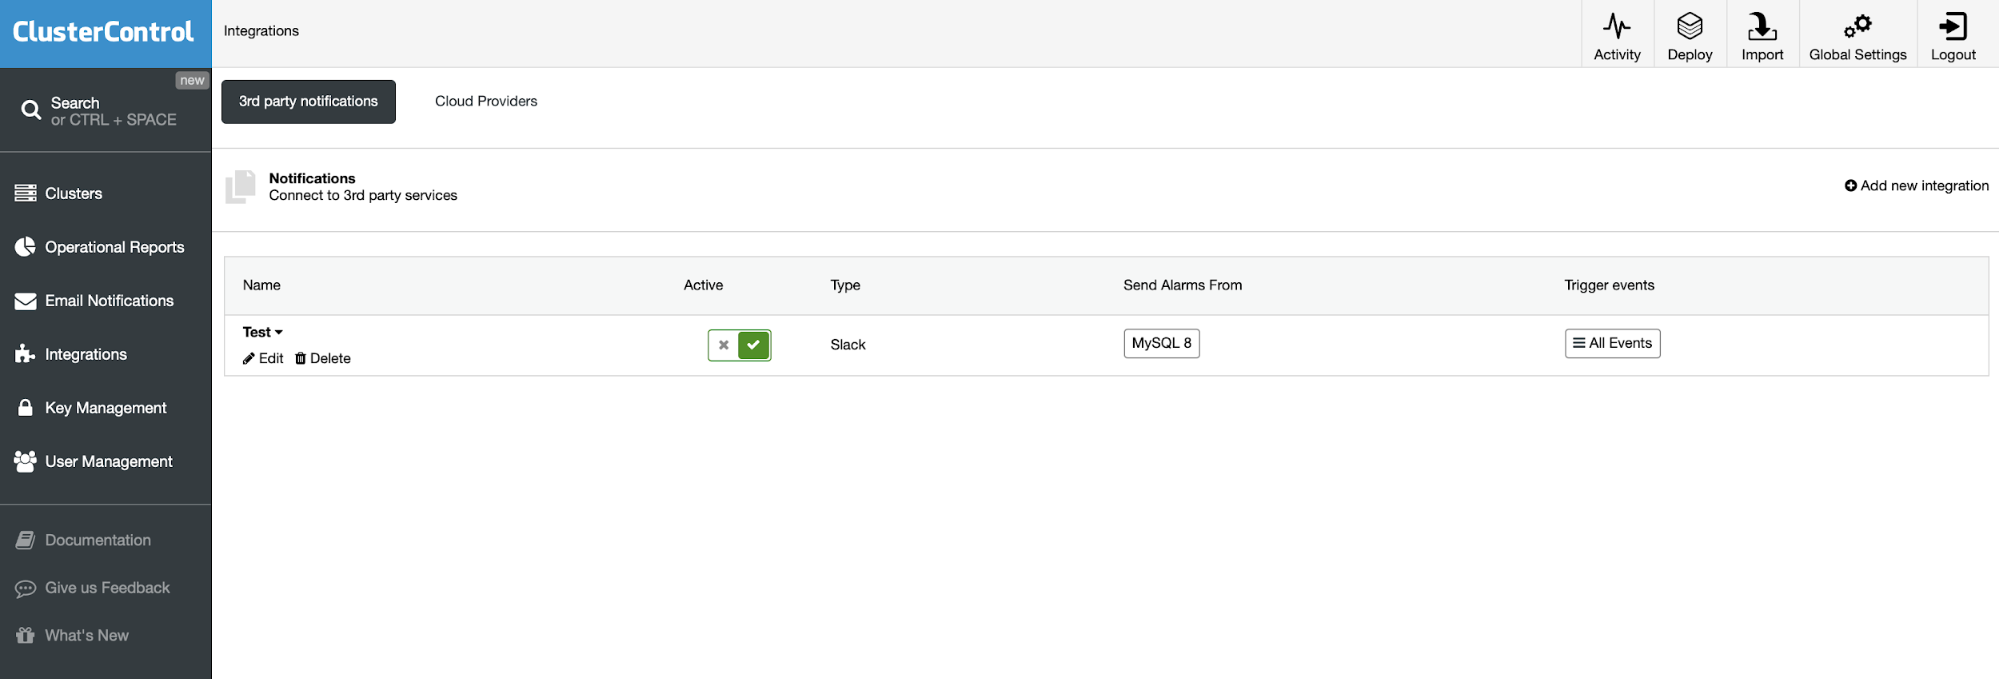
You can click it in the “Integrations” section in the left hand side menu. We already have one existing integration with slack channel.

The above alert is a sample for slack notifications.
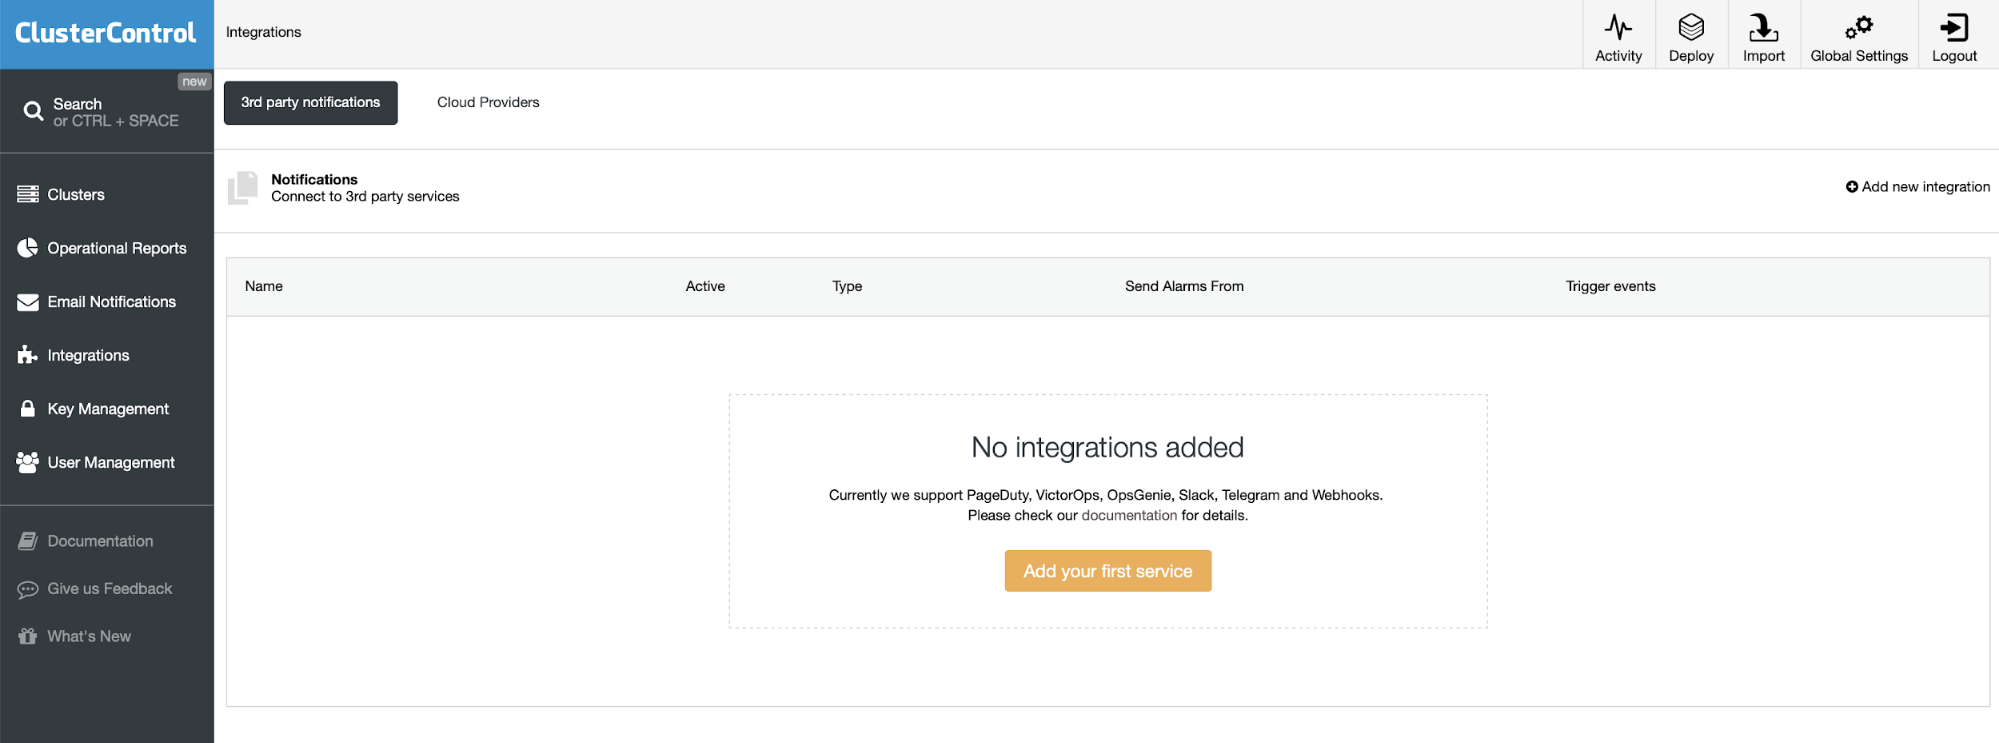
If you don’t have any existing integration, you will see the screen exactly as in the screenshot above. Just click to “Add your first service” and we can proceed further.
If you have already configured other services, on your right side, there will be one more option called “Add new integration”. Click on this menu and we can proceed further.
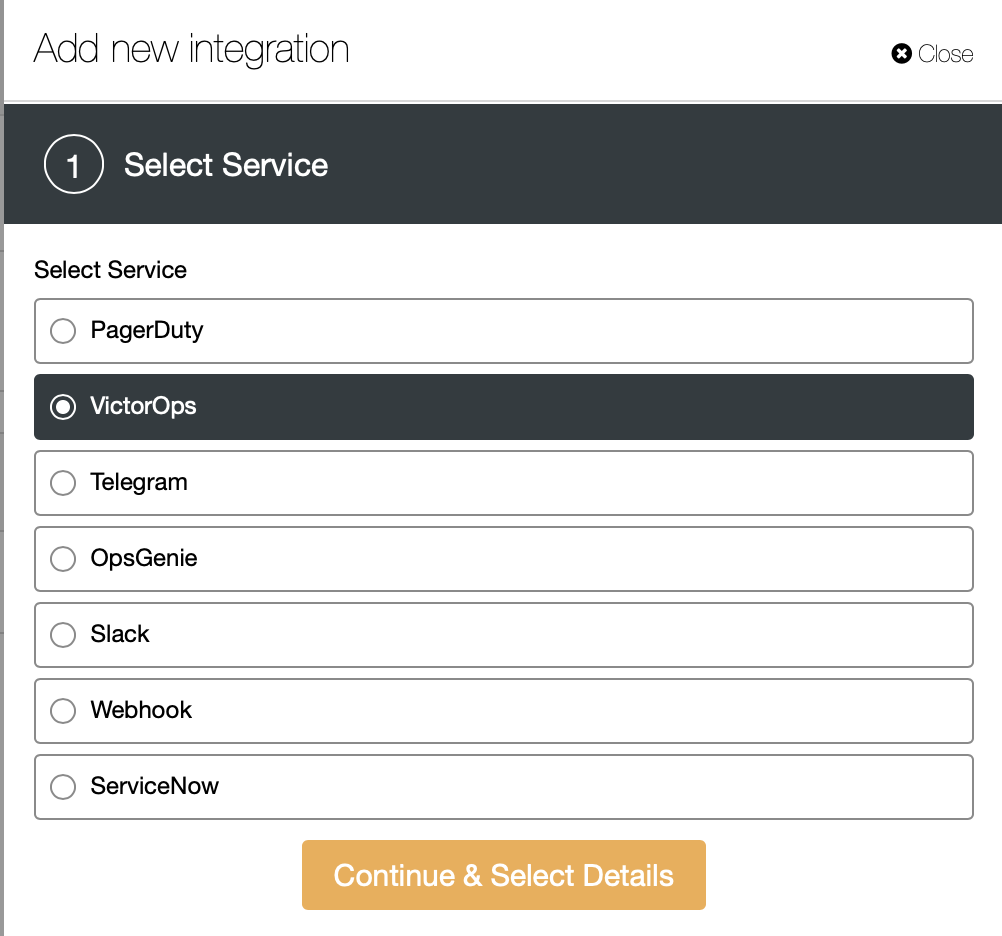
Then choose which option you need, here we are going to use VictorOps. Before configuring VictorOps, first we need to enable REST API. If you already enabled this, ignore this step.
Go to your VictorOps GUI and click on “Integrations”. It will display a list of available API’s. Now we can choose the REST API and click the “Enable Integration” button.
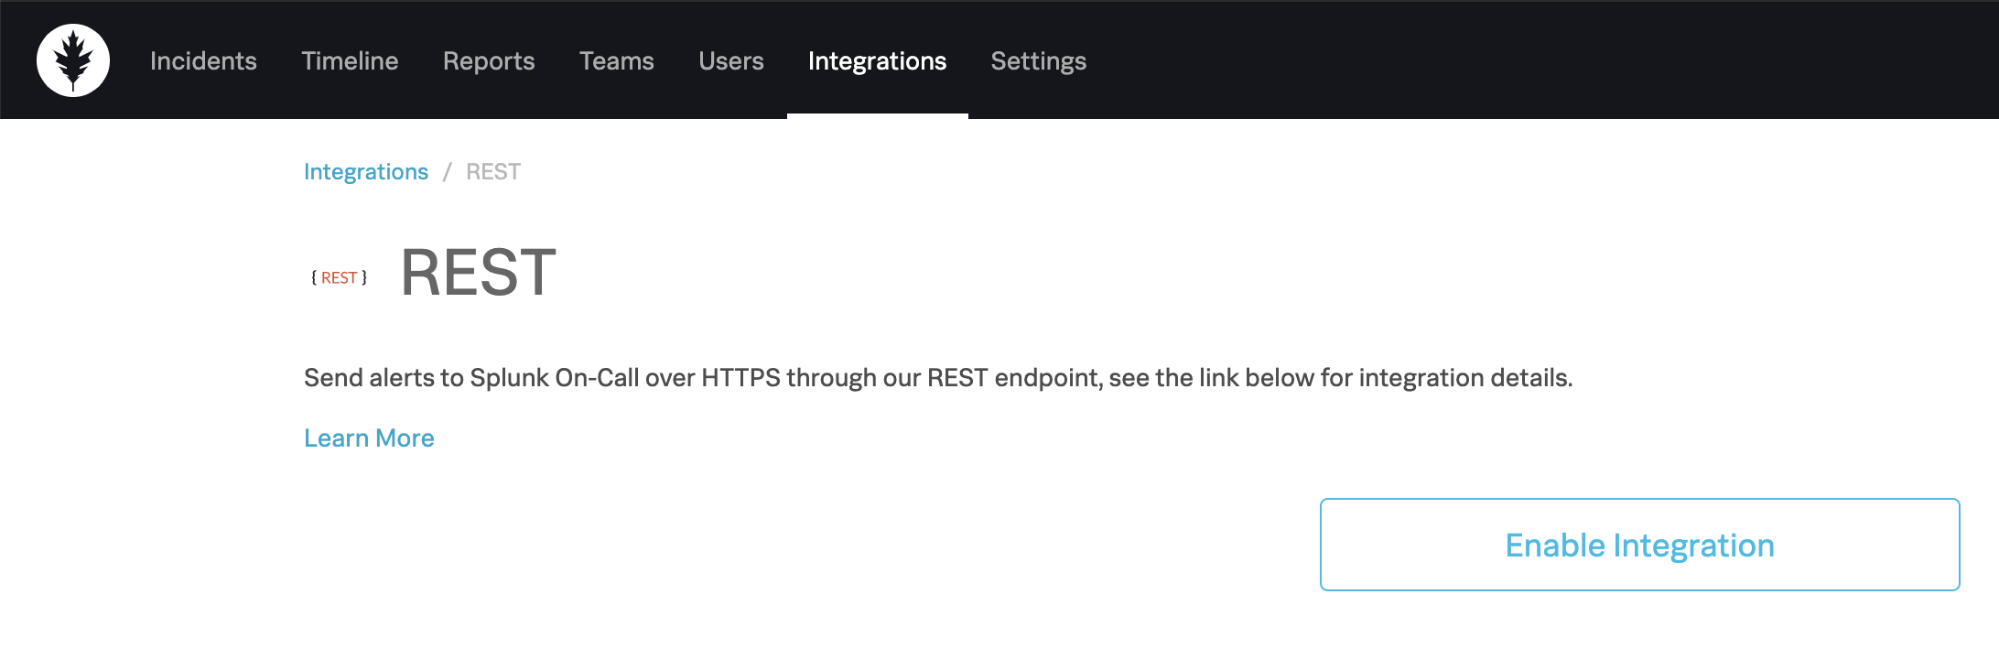
After clicking the enable integration button, it will generate an API Key.
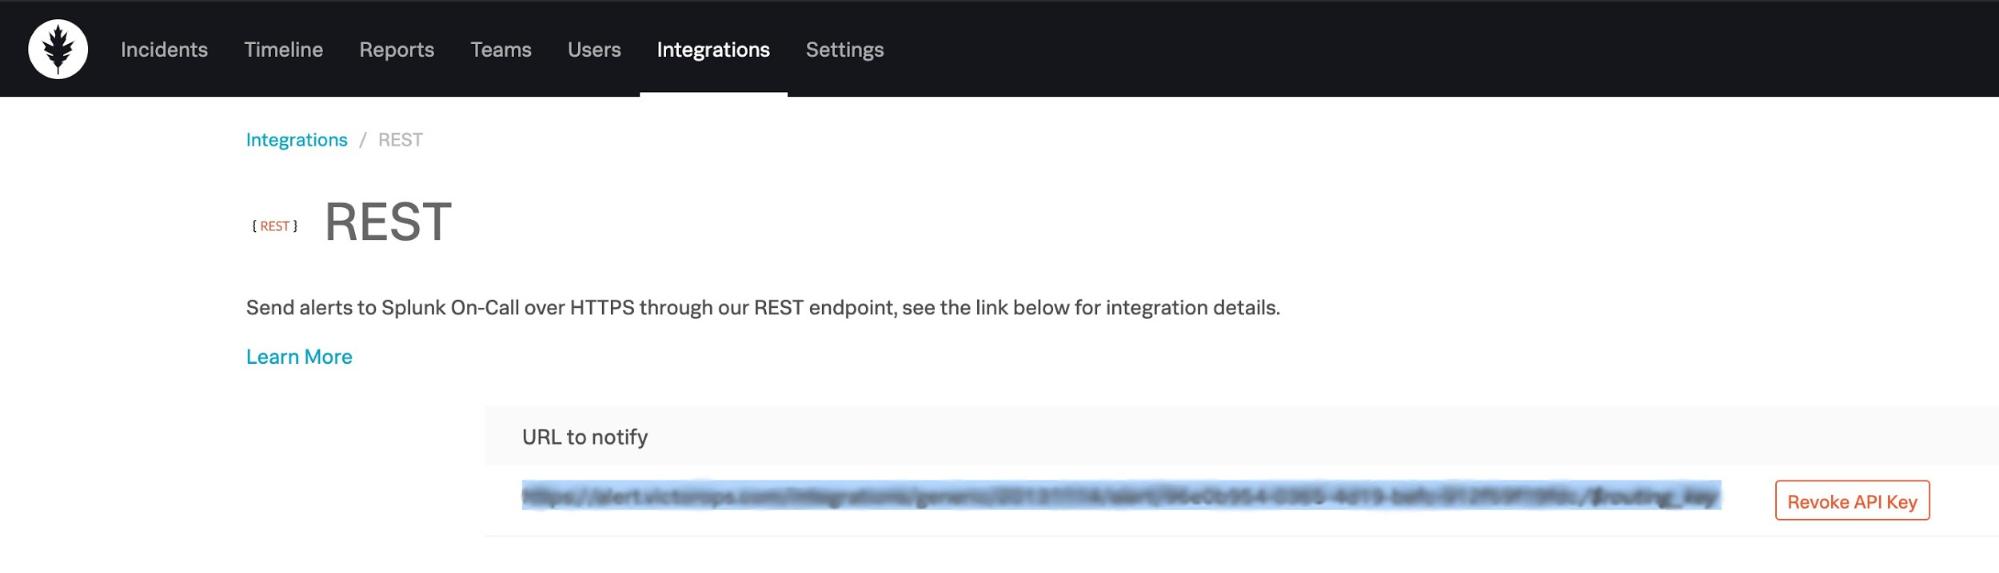
Lets copy this key and add it into ClusterControl VictorOps service configuration.
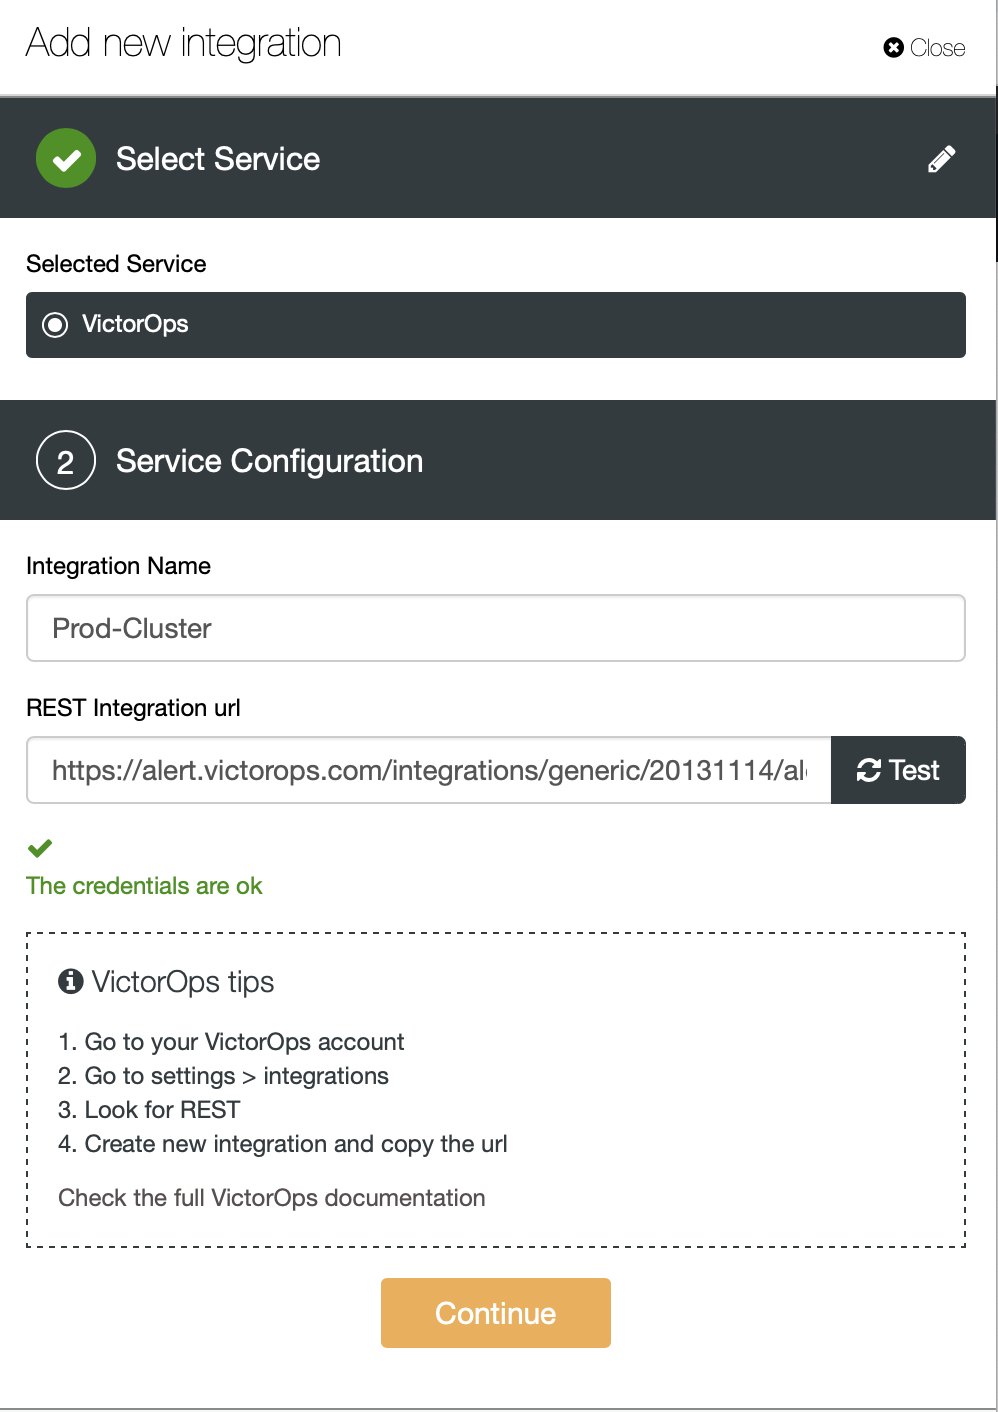
Then click the “Test” button ClusterControl validate whether this URL is valid or not. Once the credentials are valid, then click and continue.
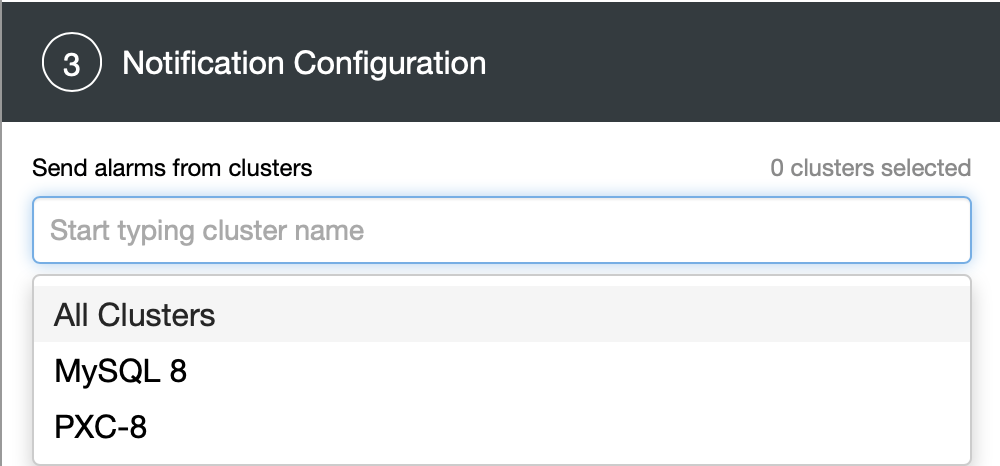
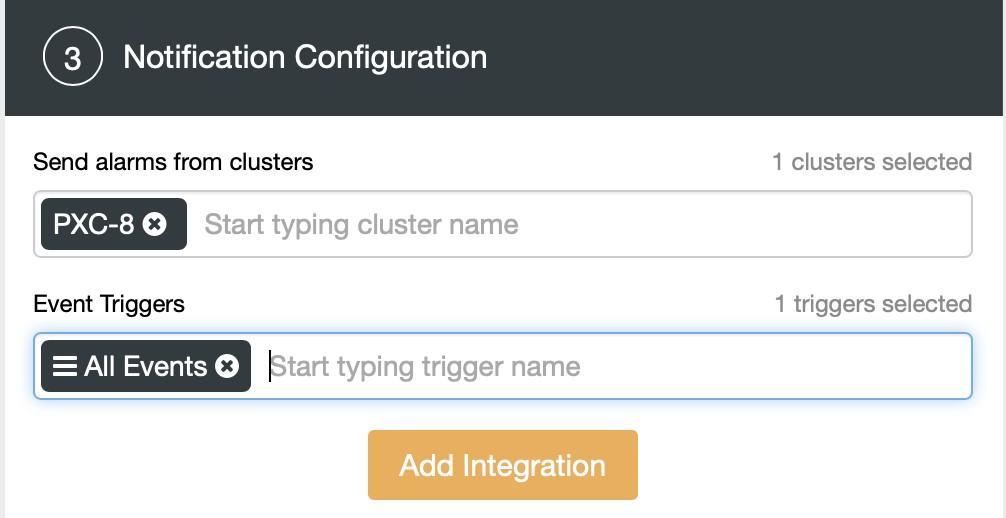
Choose the cluster which needs to add the notifications and decide which alerts will be sent to VictorOps, e.g. Warning & Critical. Here we are choosing All Events for my PXC-8 cluster. Then click the Add Integration button.
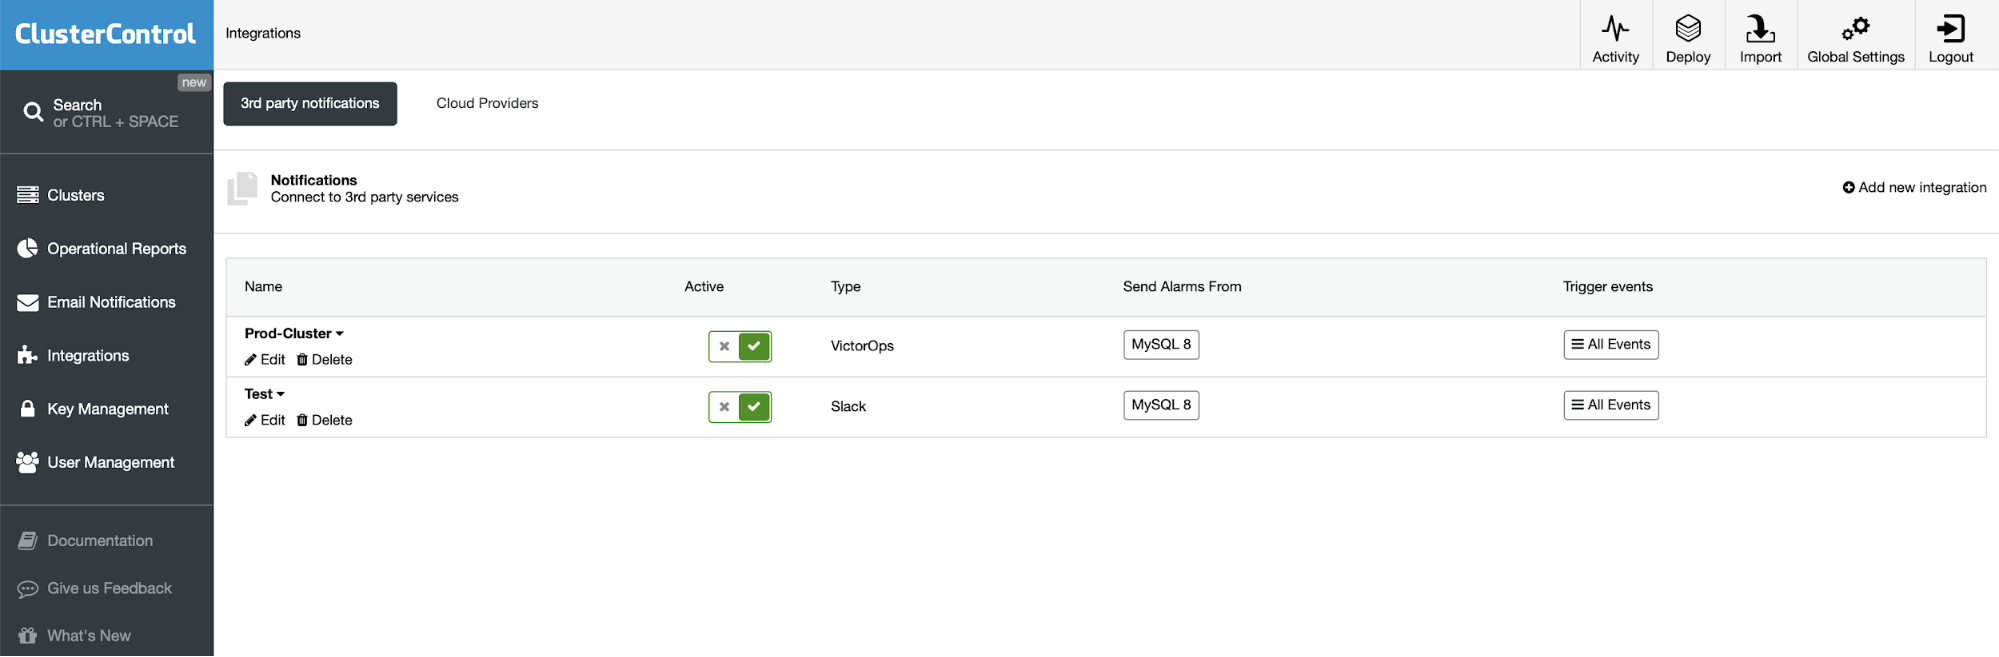
Now you can see in the above screenshot that the new integration was added to ClusterControl.
We are going to simulate a master failure on our PXC-8 cluster and watch VictorOps as ClusterControl is triggering the notifications.
Currently hostgroup-10 is a write node (192.168.33.14) in our ProxySQL.
mysql> select hostgroup_id,hostname,status from runtime_mysql_servers;
+--------------+---------------+---------+
| hostgroup_id | hostname | status |
+--------------+---------------+---------+
| 20 | 192.168.33.12 | ONLINE |
| 40 | 192.168.33.12 | ONLINE |
| 40 | 192.168.33.13 | ONLINE |
| 10 | 192.168.33.14 | ONLINE |
| 20 | 192.168.33.13 | ONLINE |
+--------------+---------------+---------+
5 rows in set (0.00 sec)Let’s stop the mysqld service on (192.168.33.14) server.
[root@centos14 log]# service mysqld stop

Redirecting to /bin/systemctl stop mysqld.service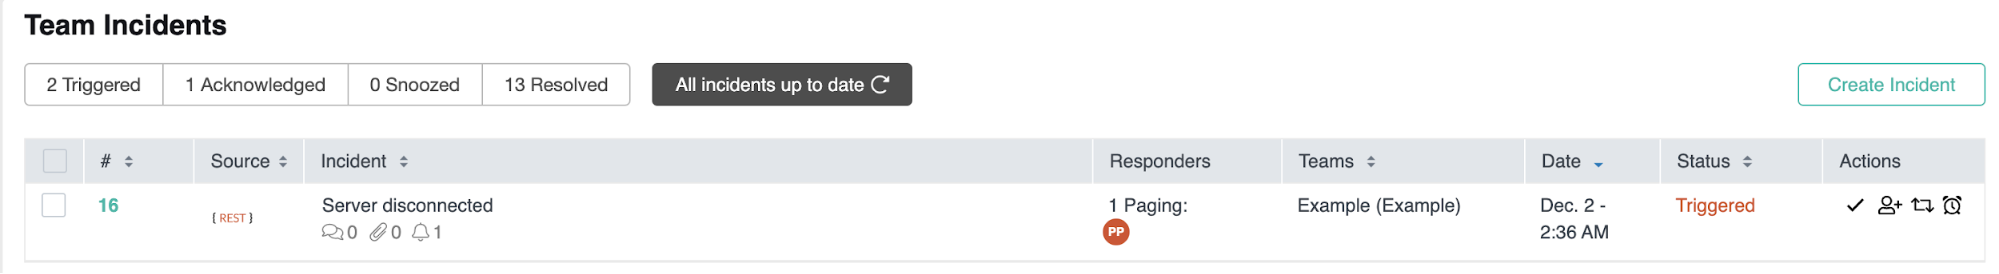
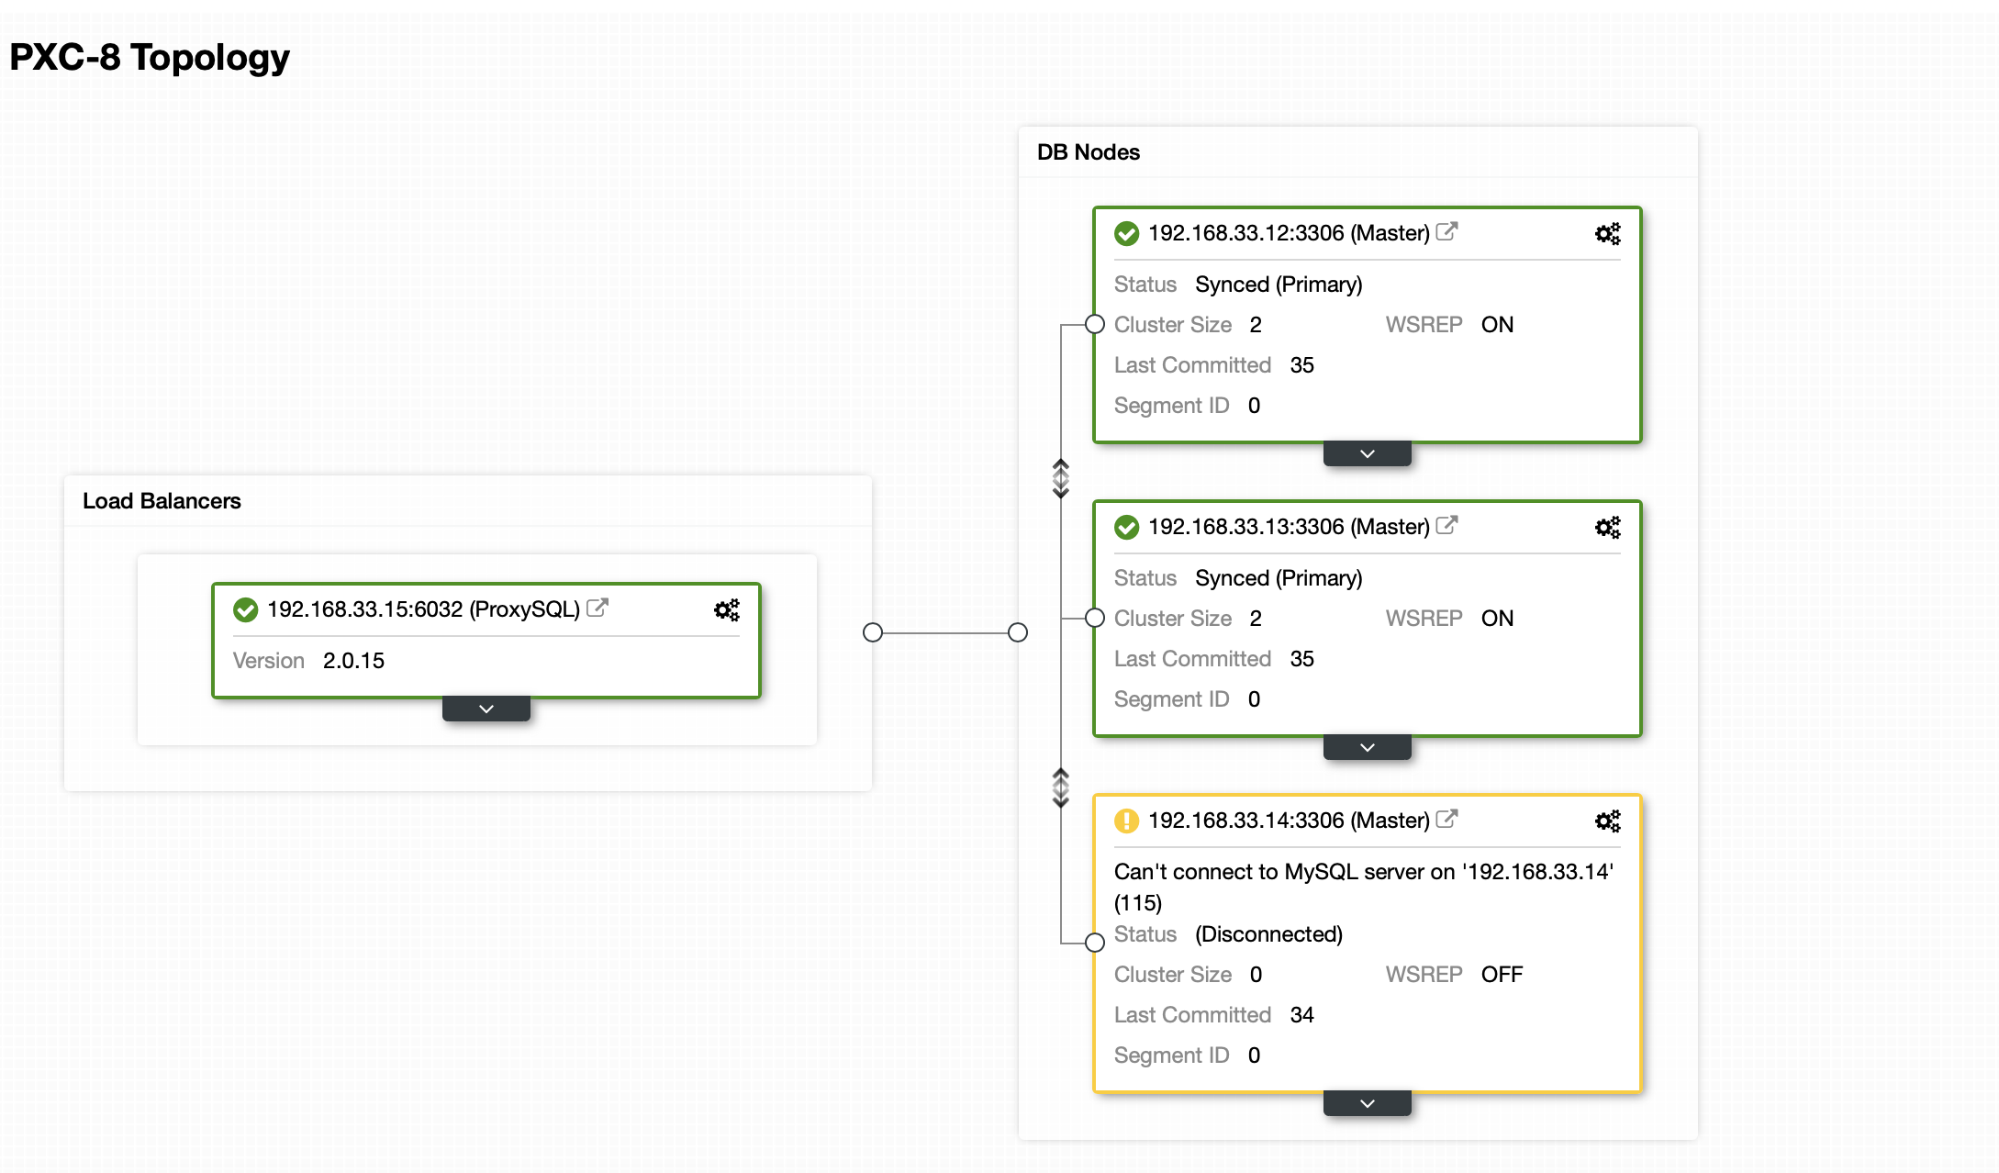
Now you can see in the above screenshot that alerts starts to be triggered. Those are related to the failed master. We can check the state of the cluster in ClusterControl.
mysql> select hostgroup_id,hostname,status from runtime_mysql_servers;

+--------------+---------------+---------+

| hostgroup_id | hostname      | status  |

+--------------+---------------+---------+

| 20           | 192.168.33.12 | ONLINE  |

| 50           | 192.168.33.14 | ONLINE  |

| 40           | 192.168.33.12 | ONLINE  |

| 10           | 192.168.33.14 | SHUNNED |

| 10           | 192.168.33.13 | ONLINE  |

+--------------+---------------+---------+

5 rows in set (0.00 sec)
Now my writer node is switched to (192.168.33.13) server.
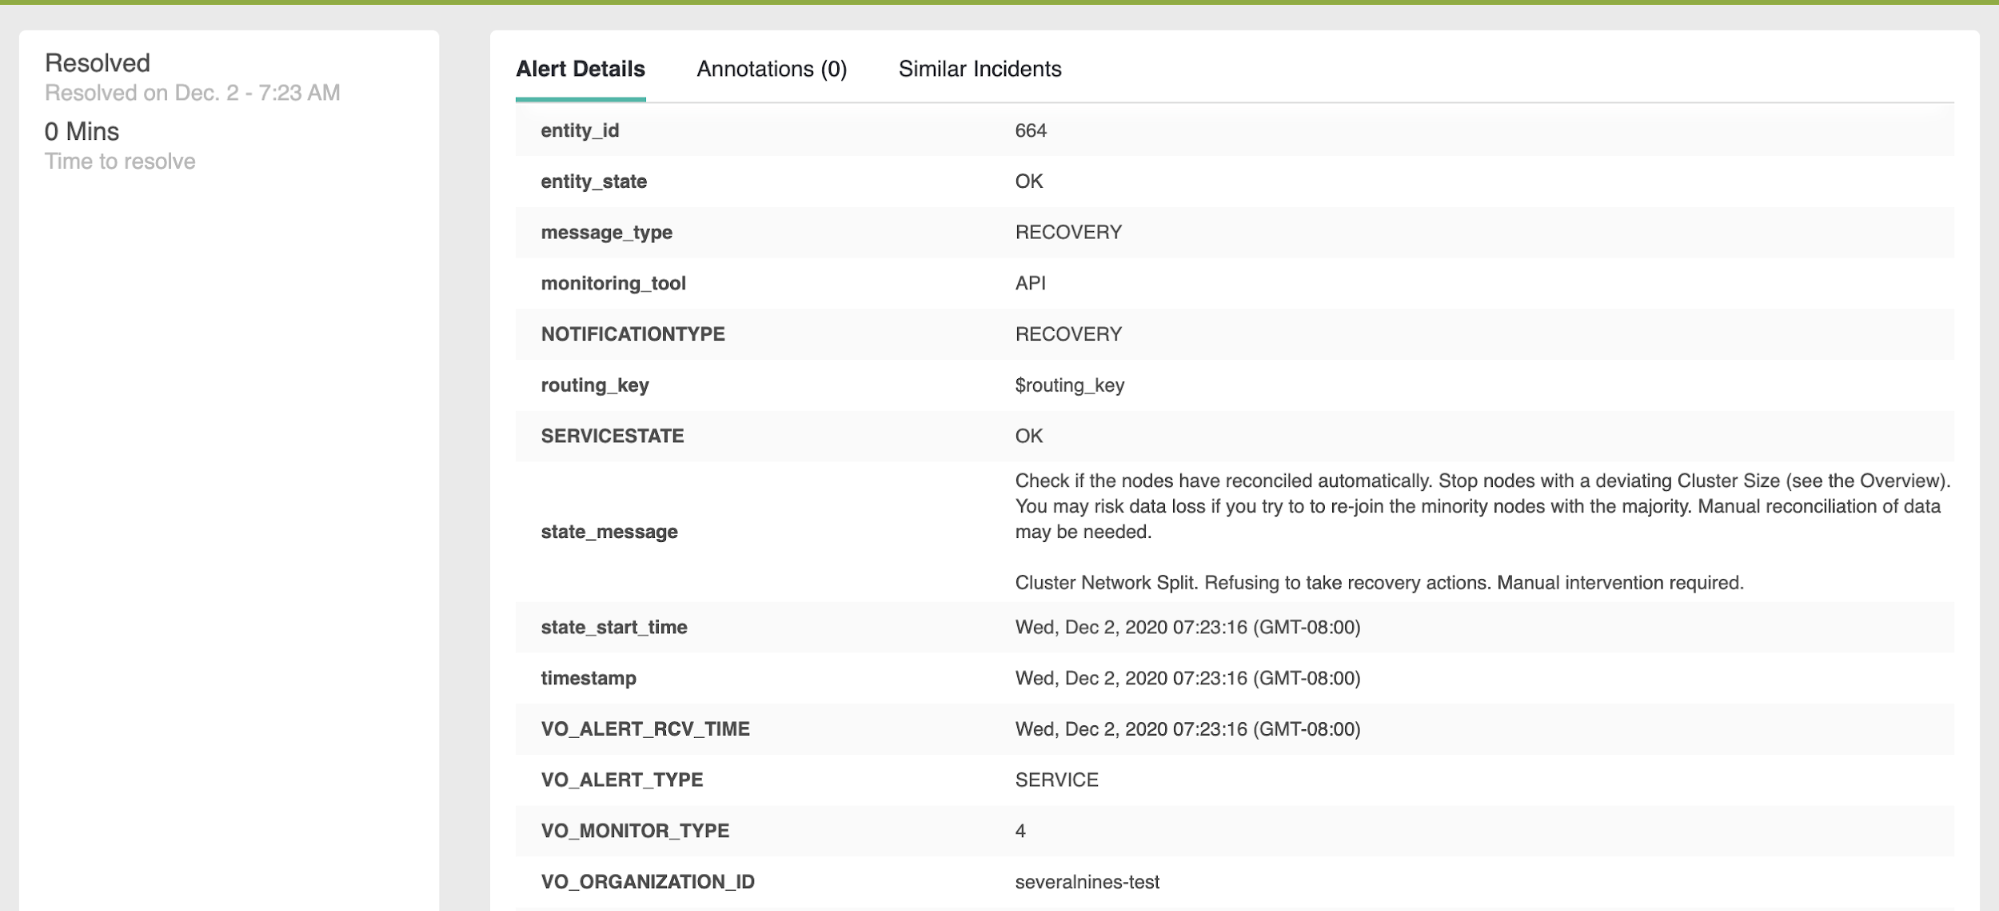
VictorOps will provide detailed info about every alert. For example, the above screenshot illustrates the current status of the node.

On the right side, a few options are available. It will help us to take necessary action for each alert. For example it’s easy to acknowledge and snooze alerts. We can assign to other teams to work on specific alerts.
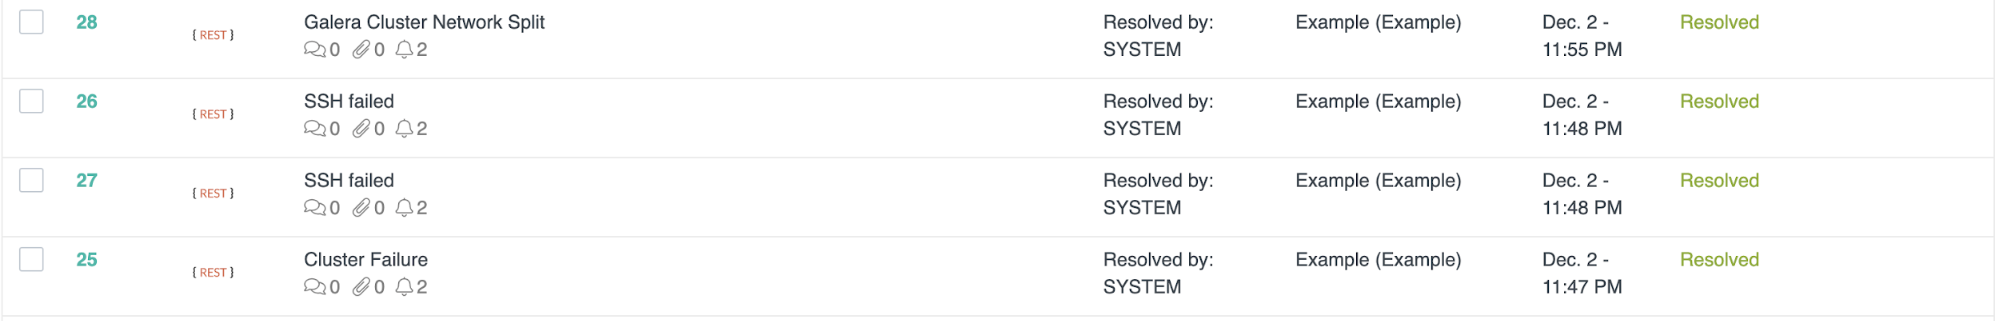
Once the server is back to online the alerts will be resolved automatically. The integration with VictorOps is really easy to set up and it will allow your team to develop and manage the on-call rotation while using ClusterControl to manage your databases.


