blog
How to Monitor Your Databases with ClusterControl and PagerDuty

ClusterControl is used by Ops teams to monitor and manage their open source databases. There are several options to integrate with external tools to achieve proactive monitoring for the database servers. In my previous blog, we wrote about how to Monitor Your Databases with ClusterControl and VictorOps.
In this blog, we are going to explain one of the SaaS-based platform integrations that is directly supported in ClusterControl called PagerDuty.
Overview
The PagerDuty is an incident management platform that provides reliable notifications, automatic escalations, on-call scheduling, and other functionality to help the Ops team to detect and fix infrastructure problems quickly.
PagerDuty is Great for Ops
PagerDuty allows us to customize notification rules for your existing monitoring tools (i.e. text or call me if it’s high-urgency, send me a push notification or email if it’s low-urgency). You can view the overall health of your systems and operations, no matter how many databases, or applications your team is managing. So being able to integrate ClusterControl with a tool like PagerDuty allows database-related issues to be surfaced to the entire Ops team.
Prerequisites
As part of this integration, we need to perform the below action items.
- Create a new team and add respective members
- Configure API service on PagerDuty
- Generate a service key and add this key needs to be added on ClusterControl PagerDuty integration.
Once it’s done, the next step will be to set up the integration in ClusterControl.
Go to ClusterControl Dashboards –>Integrations.
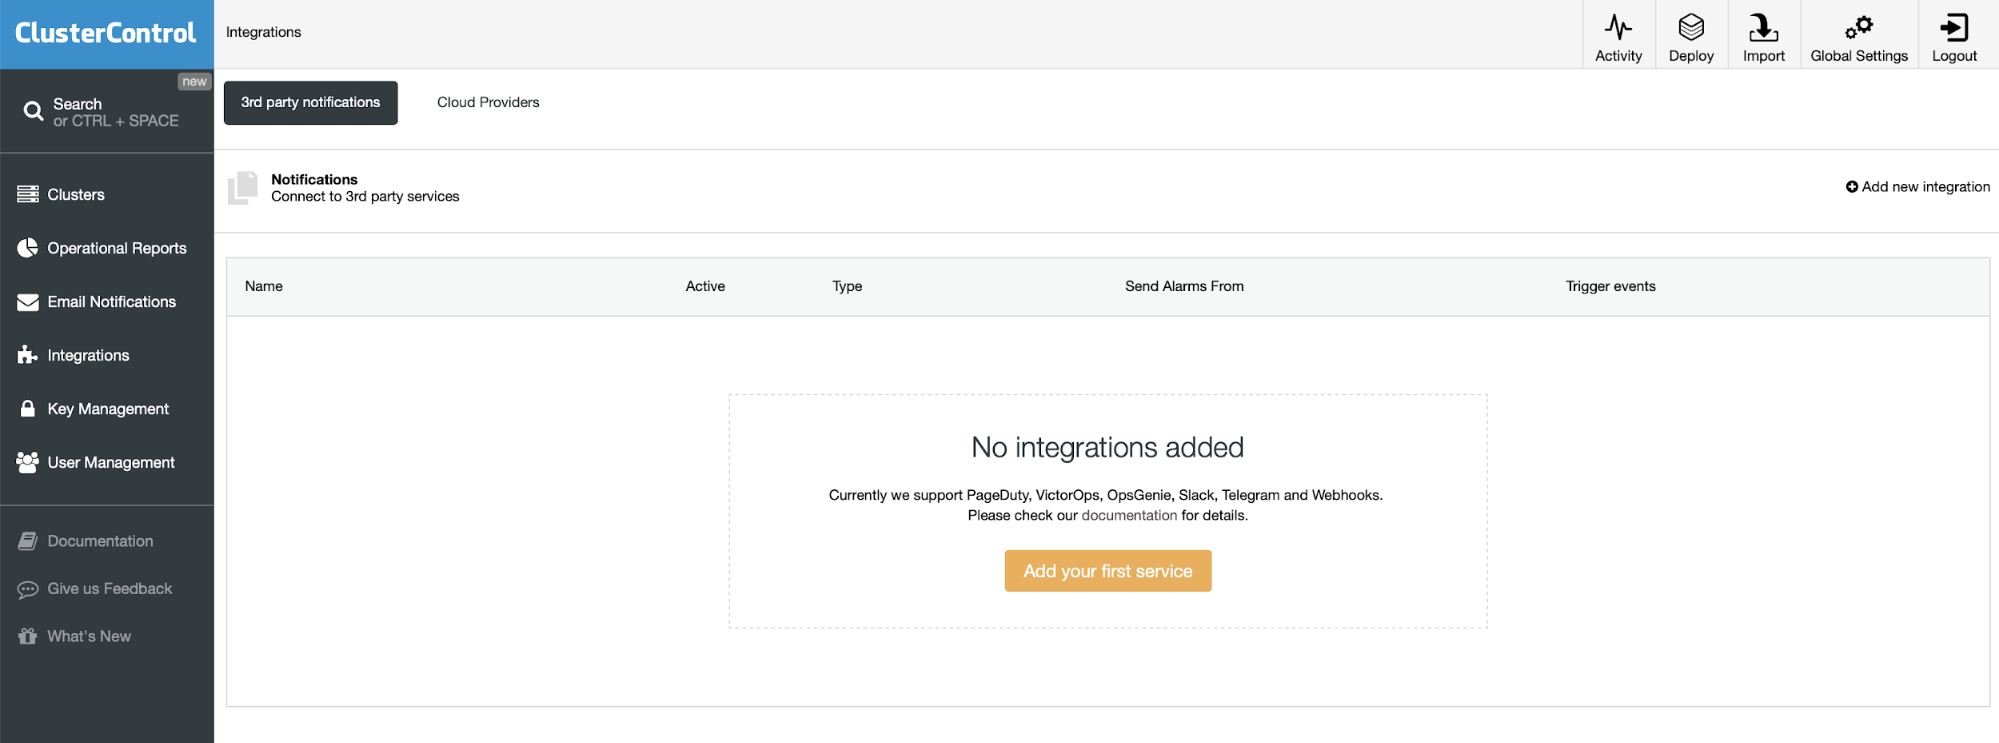
If you don’t have any existing integration, you will see the screen exactly as in the screenshot above. Just click to “Add your first service” and we can proceed further.
If you have already configured other services, on your right side, there will be one more option called “Add new integration”. Click on this menu item and we can proceed further.
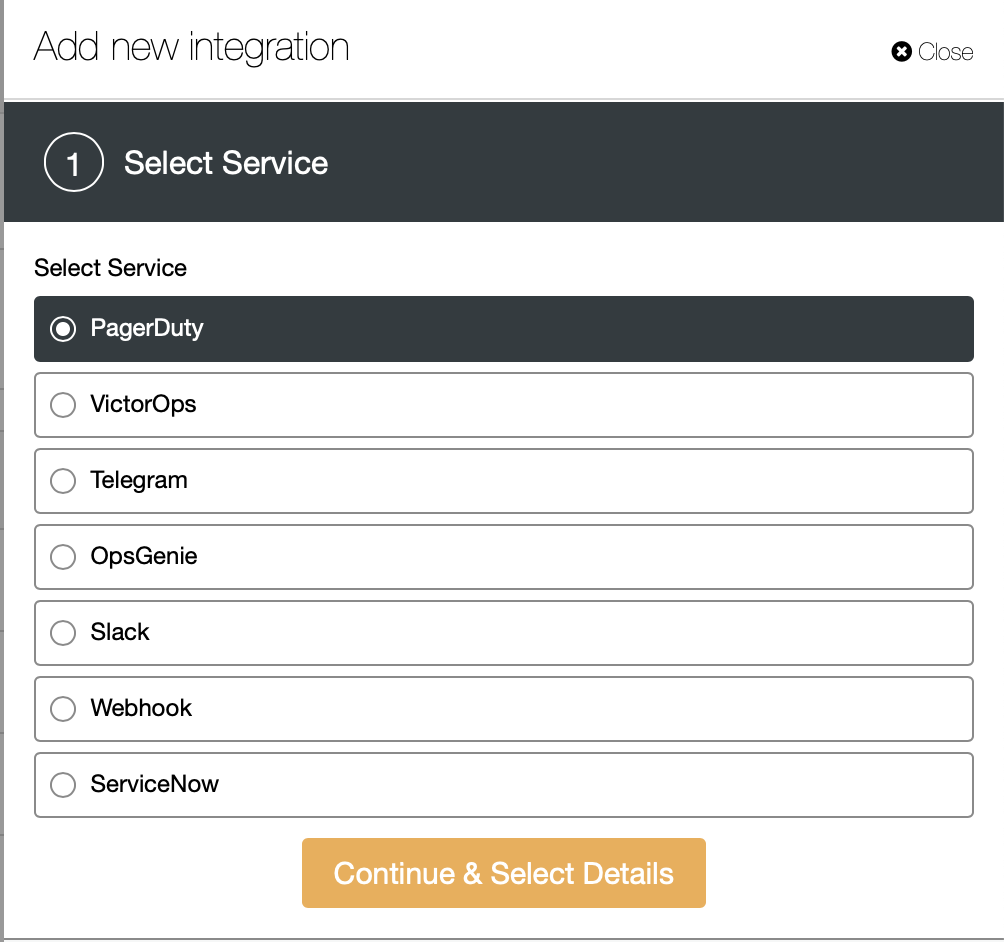
Then choose which option you need, here we are going to use PagerDuty. Before configuring PagerDuty, first we need to enable service API. If you already enabled this, ignore this step.
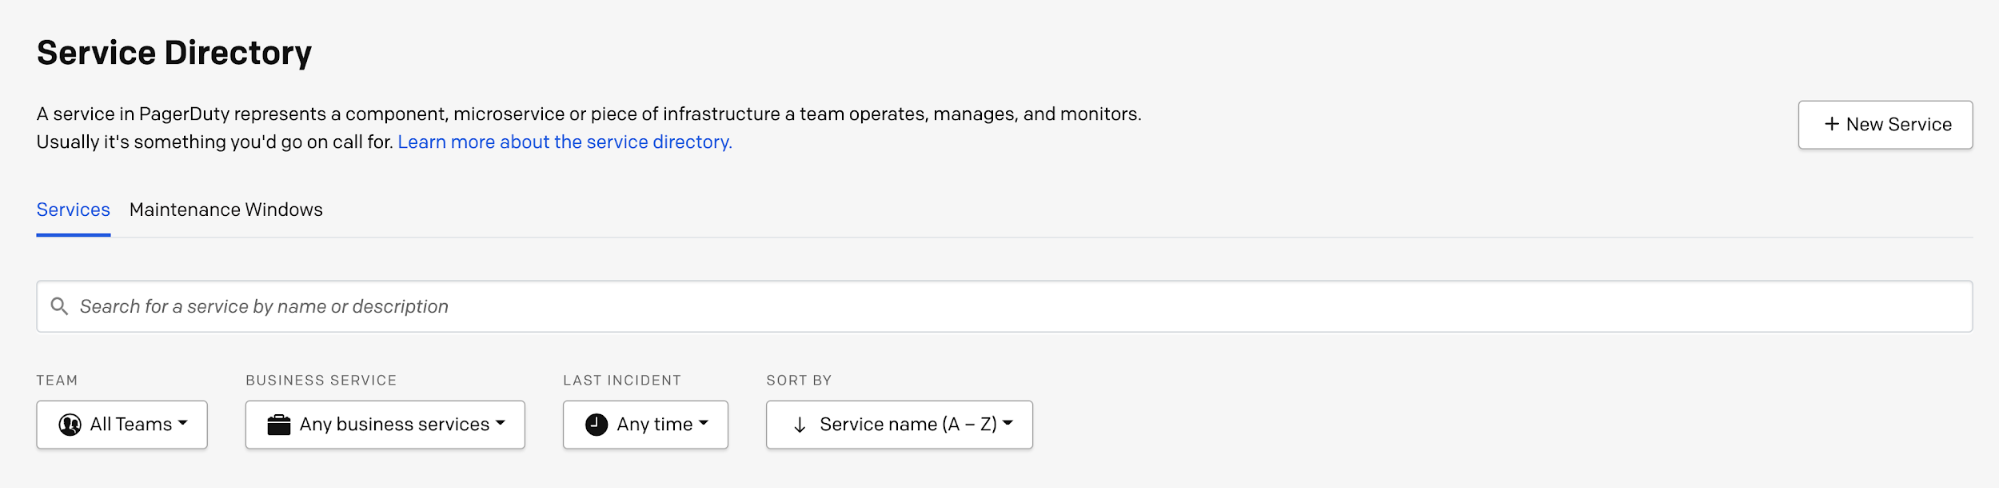
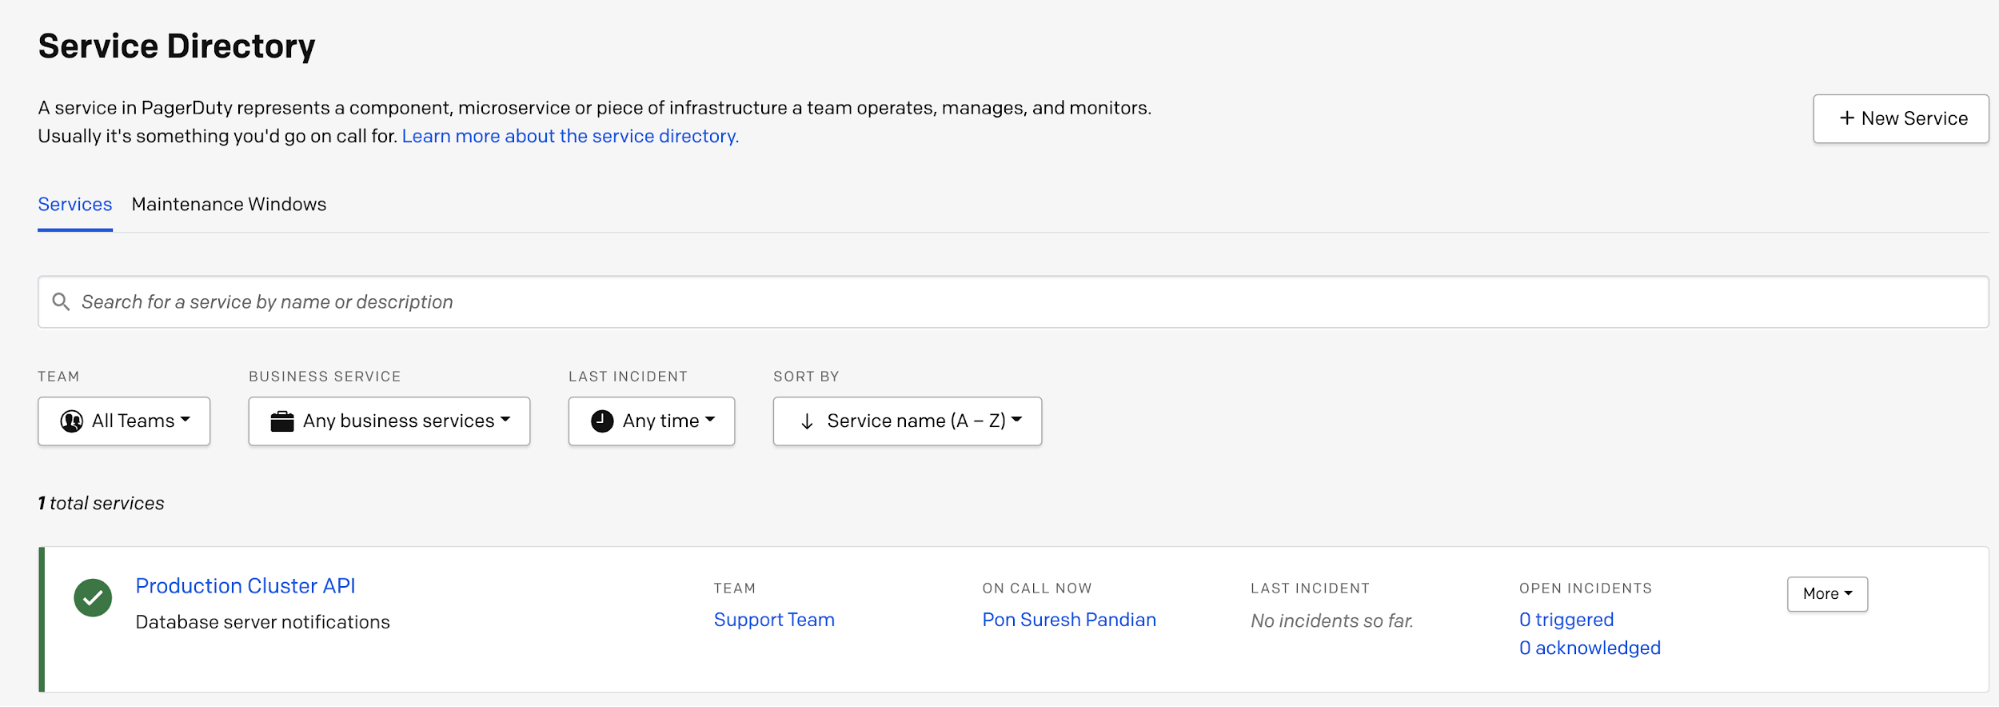
Go to your PagerDuty GUI and click on “Services”. It will display a list of available services. Now we can choose the “Service Directory”.

Currently there are no services enabled, now you can click on “+ New Service” button on your right side.
Then add name and description to general settings, the next important step is “Integration Settings”. In this “Integration Settings” we need to choose “Use our API directly” radio button and select the “Events API V2” option.
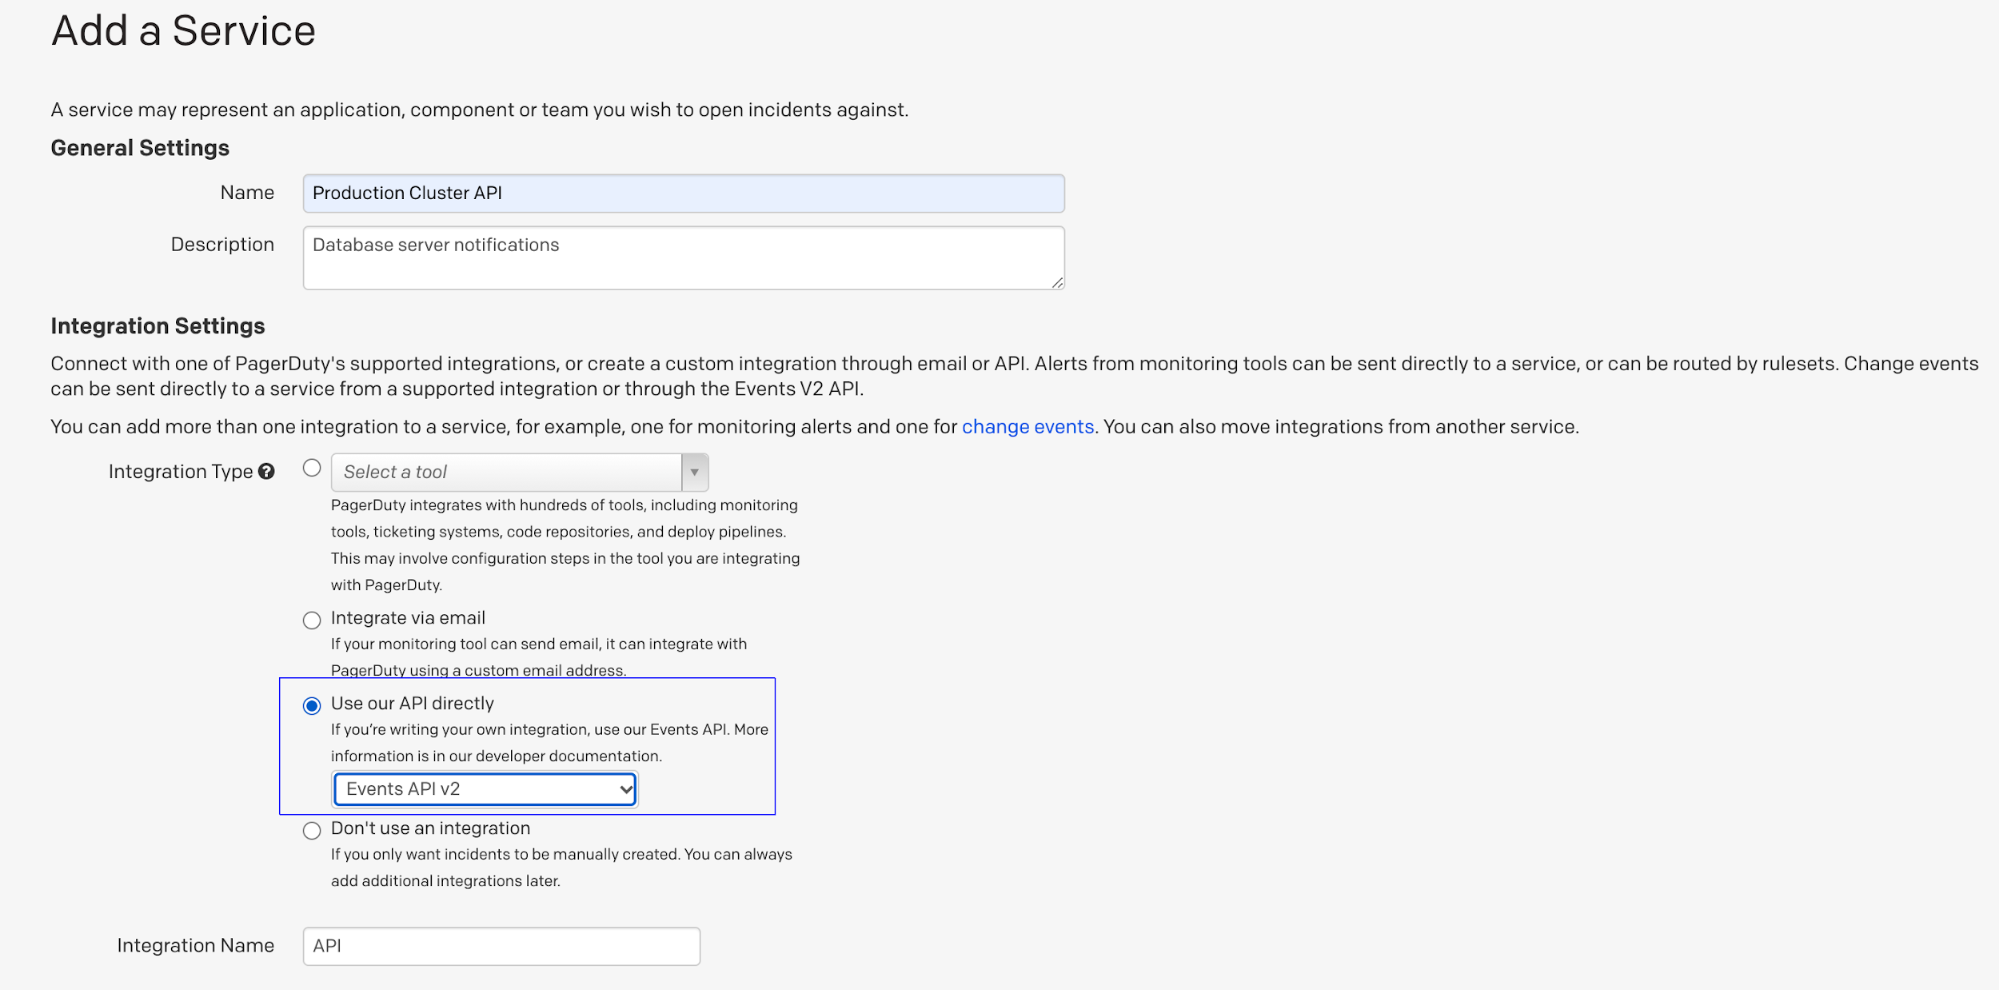
If needed then enable other notification changes like response time and acknowledgement timeout settings finally click the “Add Service” button.
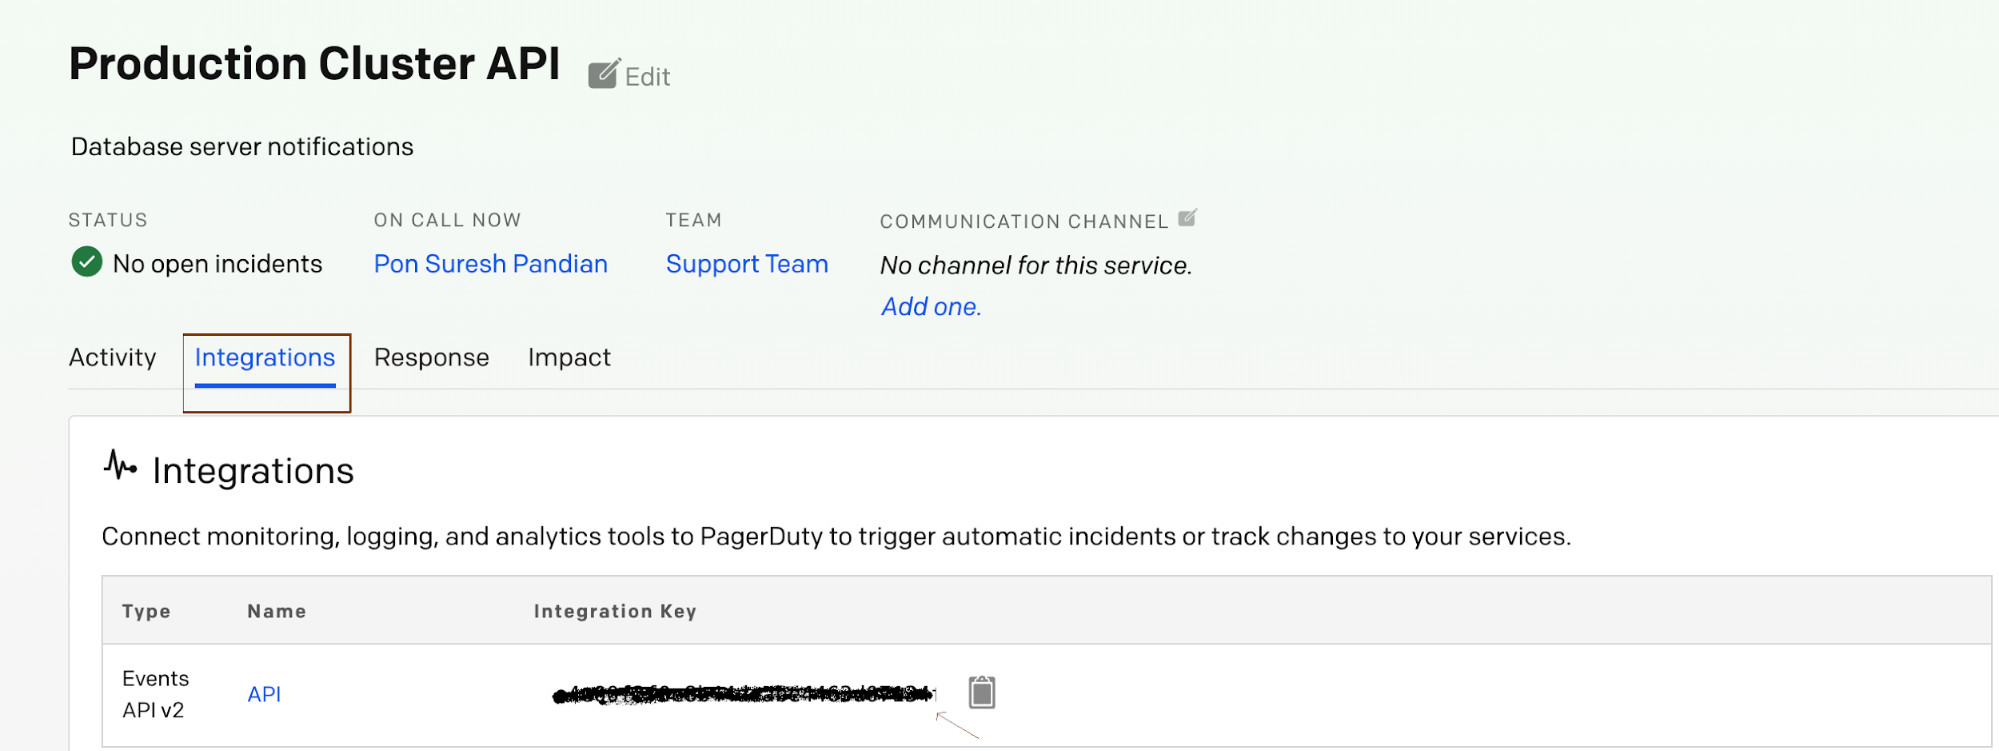
Now you can see the new service directory was created, then click on that “Production Cluster API” directory.
Go to “integrations” where you can find the API key. Lets copy this key and add it into ClusterControl PagerDuty service configuration.
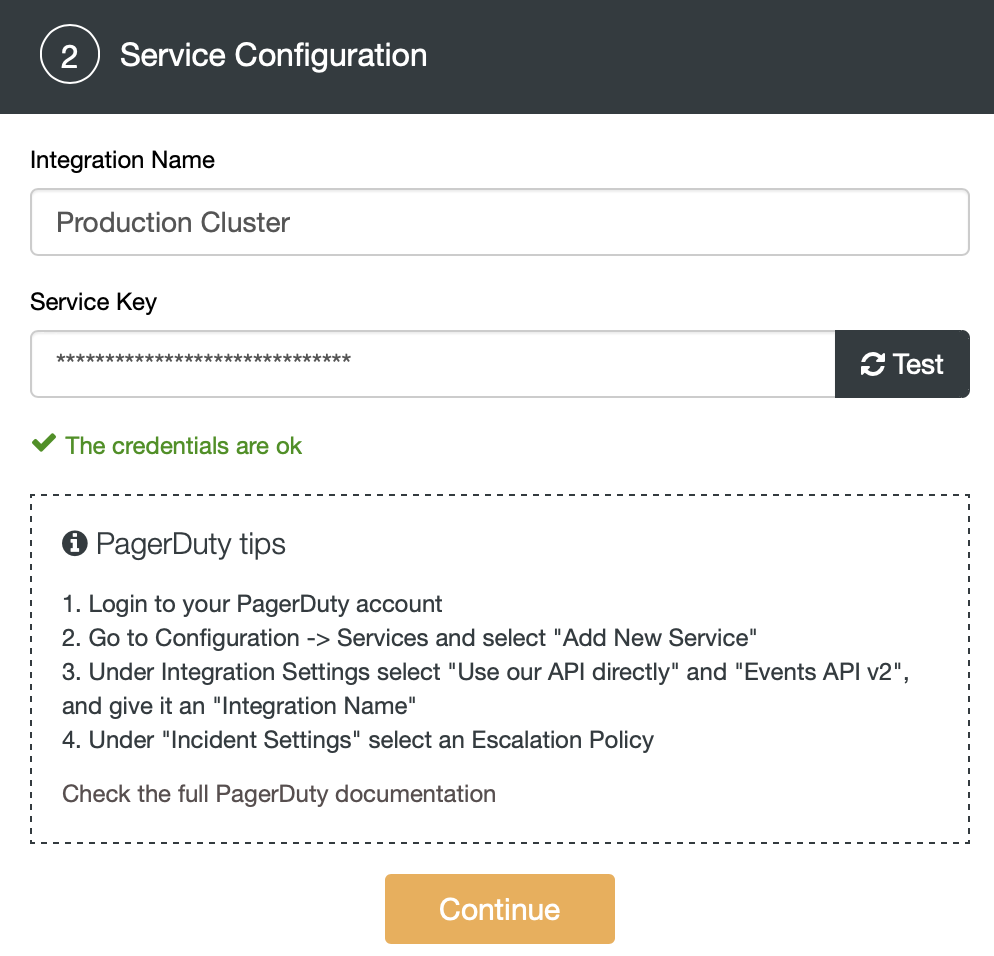
Then click the “Test” button ClusterControl validate whether this service key is valid or not. Once the credentials are valid, then click and continue.
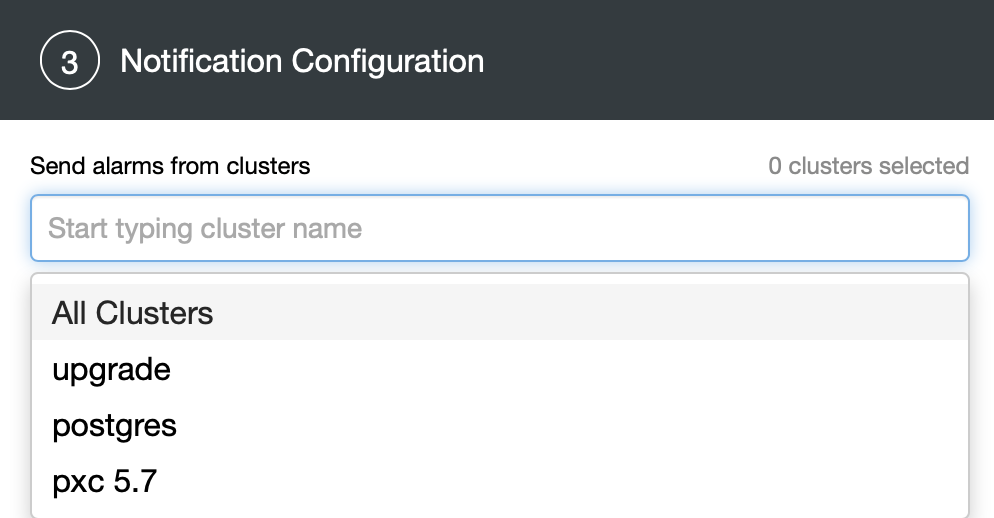
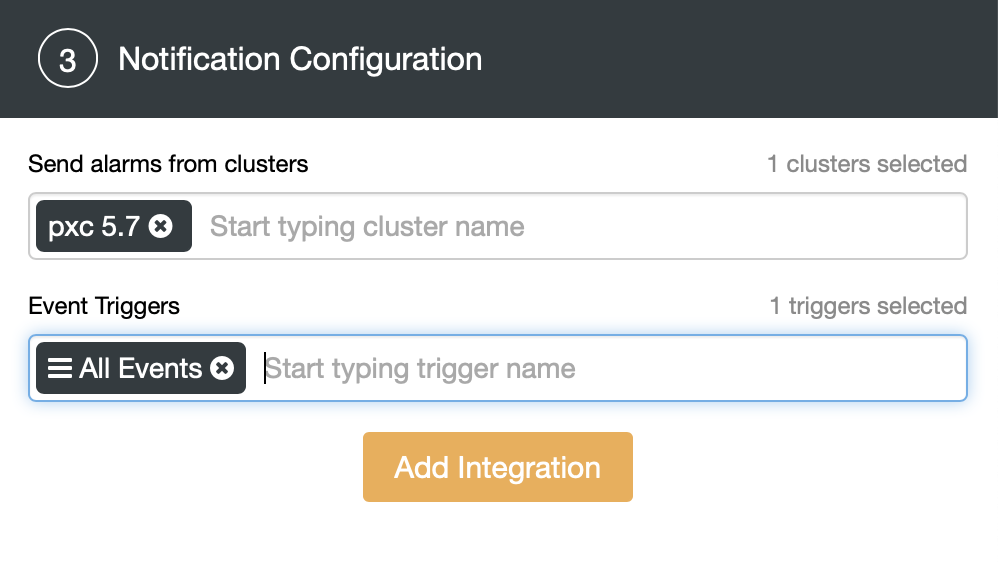
Choose the cluster which needs to add the notifications and decide which alerts will be sent to PagerDuty, e.g. Warning & Critical. Here we are choosing All Events for my PXC-5.7 cluster. Then click the Add Integration button.
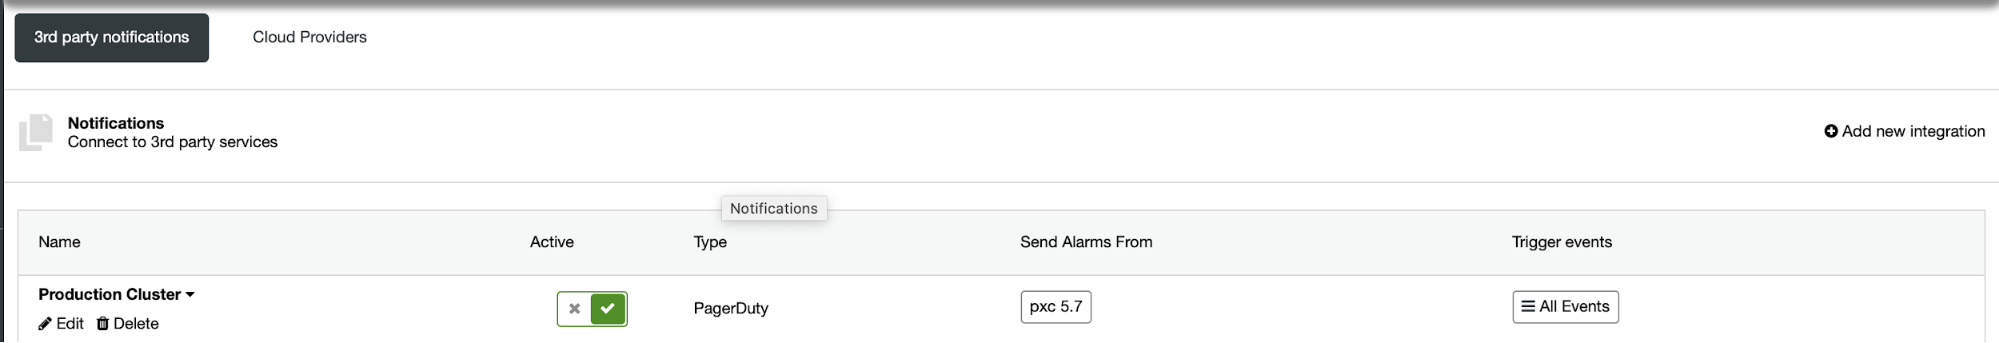
Now you can see in the above screenshot that the new integration was added to ClusterControl.
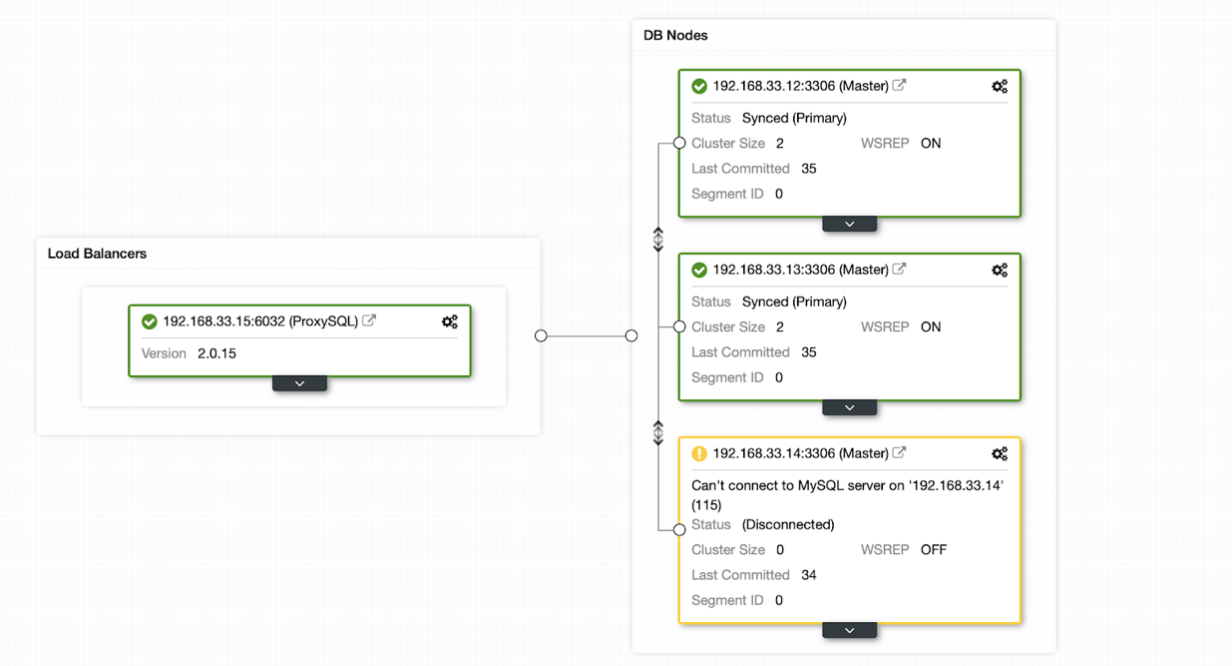
We are going to simulate a master failure on our PXC-5.7 cluster and watch PagerDuty as ClusterControl is triggering the notifications.
Currently hostgroup-10 is a write node (192.168.33.14) in our ProxySQL.
mysql> select hostgroup_id,hostname,status from runtime_mysql_servers;
+--------------+---------------+---------+
| hostgroup_id | hostname | status |
+--------------+---------------+---------+
| 20 | 192.168.33.12 | ONLINE |
| 40 | 192.168.33.12 | ONLINE |
| 40 | 192.168.33.13 | ONLINE |
| 10 | 192.168.33.14 | ONLINE |
| 20 | 192.168.33.13 | ONLINE |
+--------------+---------------+---------+
5 rows in set (0.00 sec)Let’s stop the mysqld service on (192.168.33.14) server.
[root@centos14 lib]# service mysqld stop

Redirecting to /bin/systemctl stop mysqld.service
Now you can see in the above screenshot that alerts are started to get triggerred. Those are related to the failed master. We can check the state of the cluster in ClusterControl.
mysql> select hostgroup_id,hostname,status from runtime_mysql_servers;

+--------------+---------------+---------+

| hostgroup_id | hostname      | status  |

+--------------+---------------+---------+

| 20           | 192.168.33.12 | ONLINE  |

| 50           | 192.168.33.14 | ONLINE  |

| 40           | 192.168.33.12 | ONLINE  |

| 10           | 192.168.33.14 | SHUNNED |

| 10           | 192.168.33.13 | ONLINE  |

+--------------+---------------+---------+

5 rows in set (0.00 sec)
Now my writer node is switched to (192.168.33.13) server.
Workflow
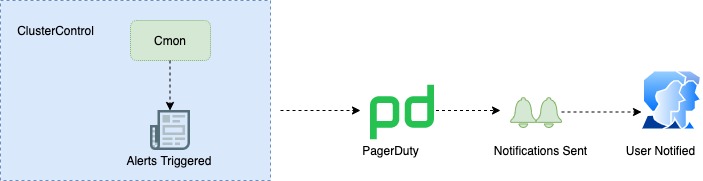
Basically the cmon controller will trigger the alert to PagerDuty, the PagerDuty automatically groups related alerts into a single incident to minimize noise while centralizing relevant context. Incident notifications are automatically sent using any preferred combination of phone calls, SMS, push notifications and emails.
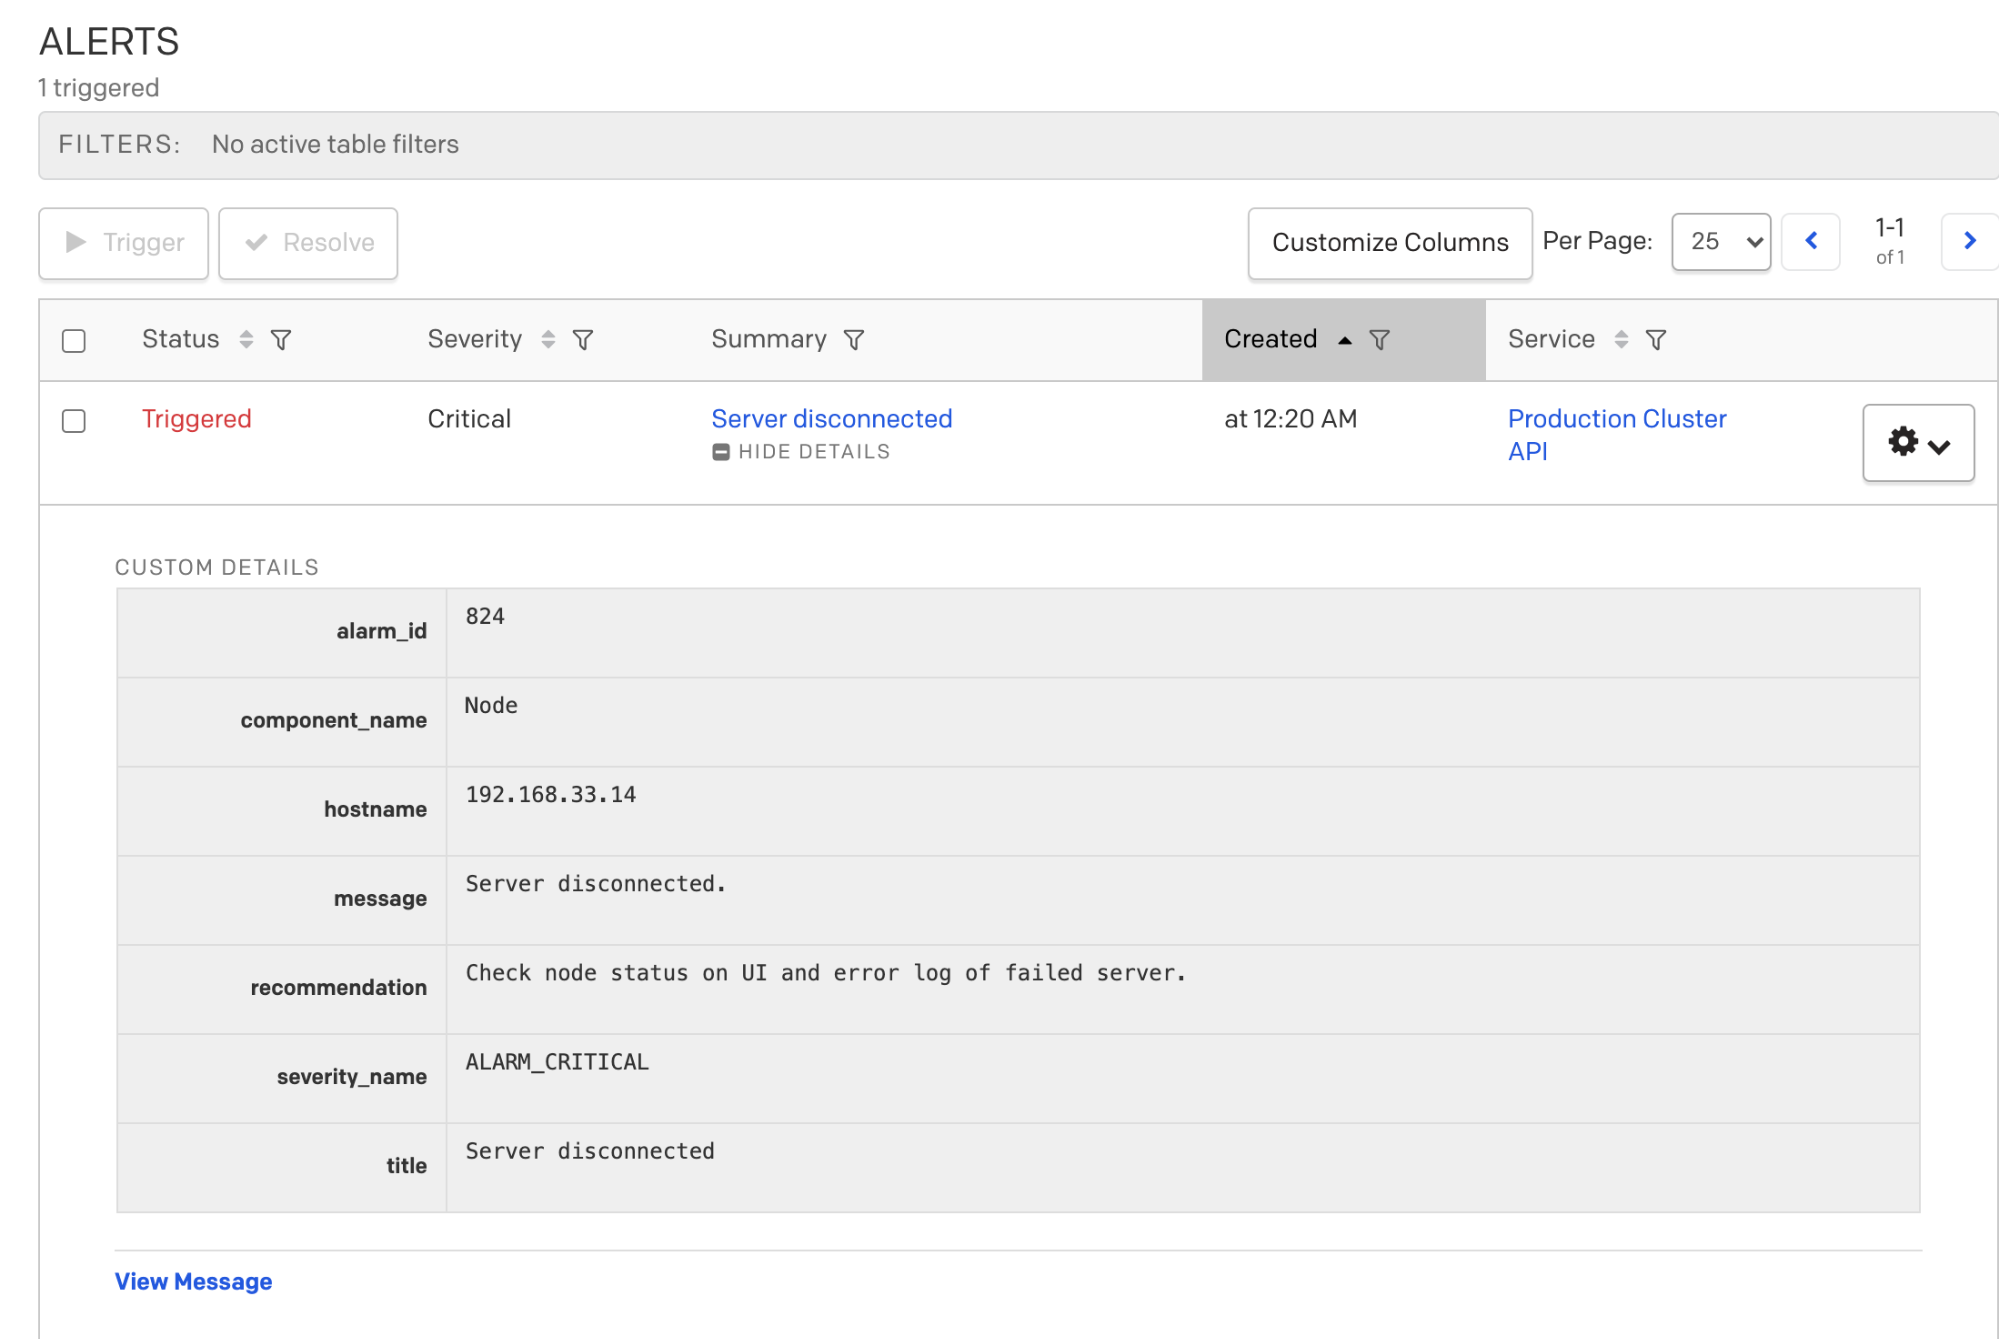
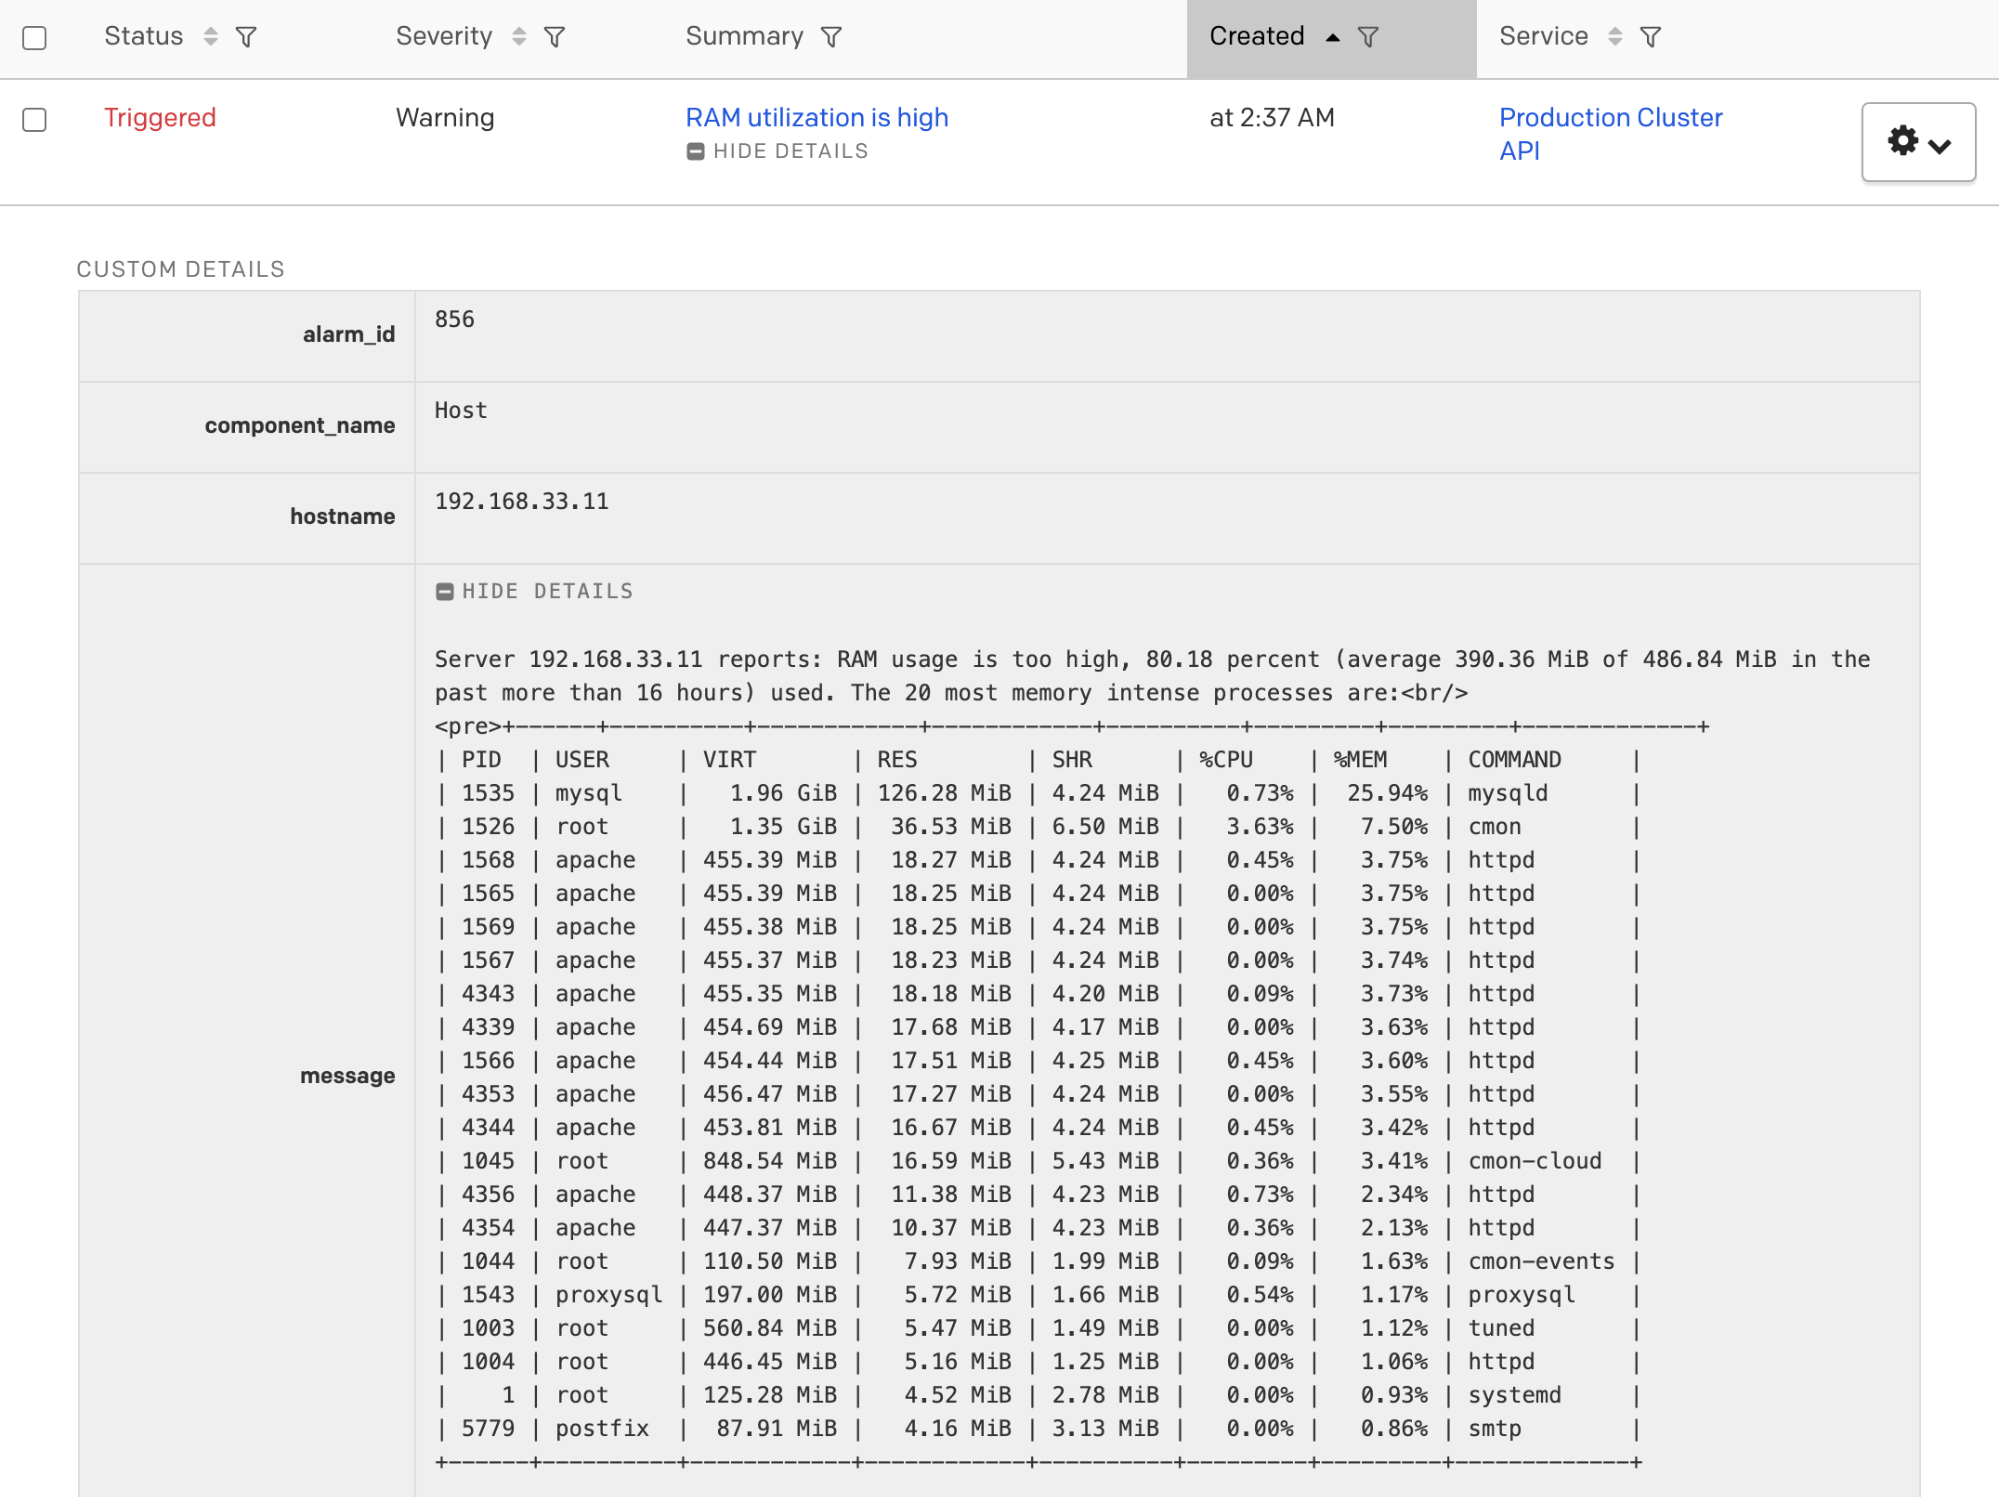
PagerDuty will provide detailed info about every alert.
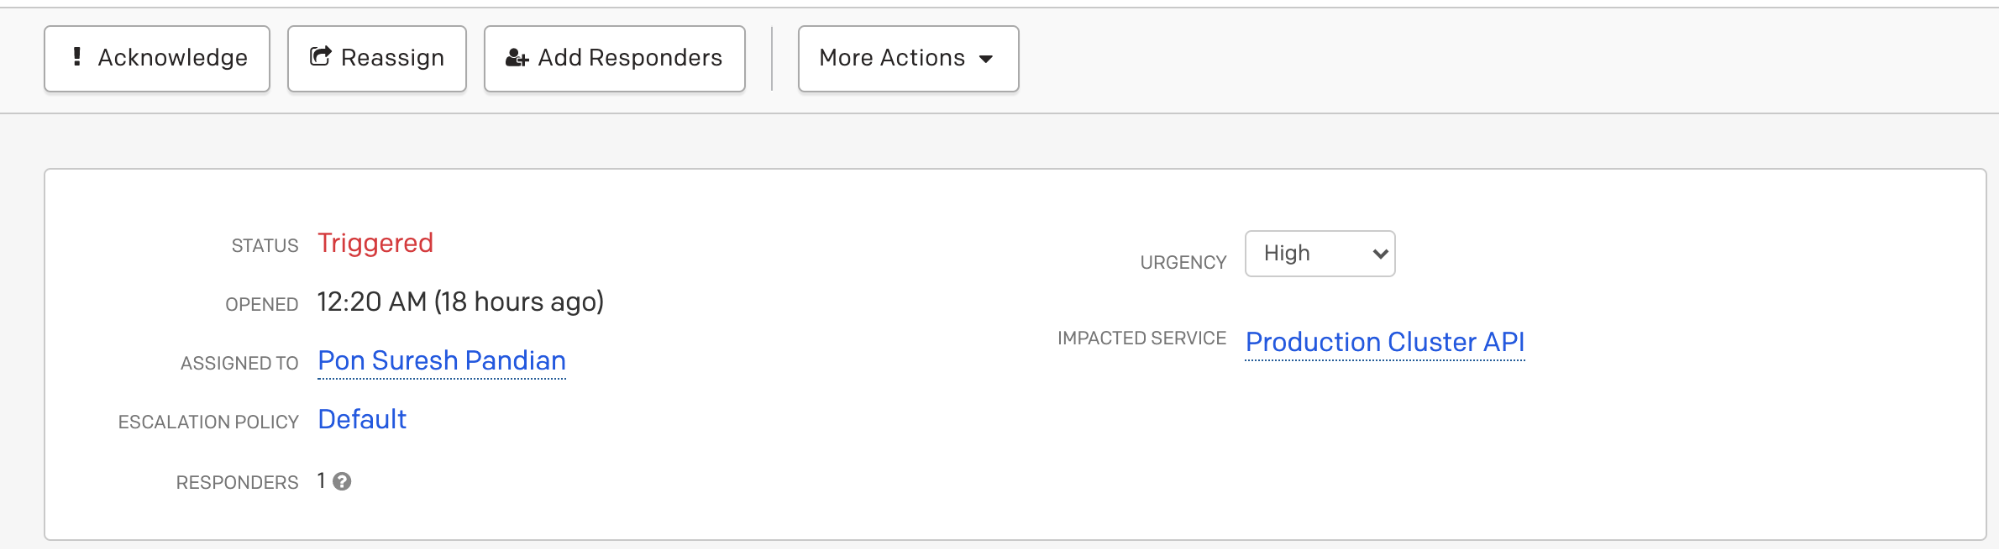
At the top, a few options are available. It will help us take necessary action for each alert. For example it’s easy to acknowledge we can assign to other teams to work on specific alerts.
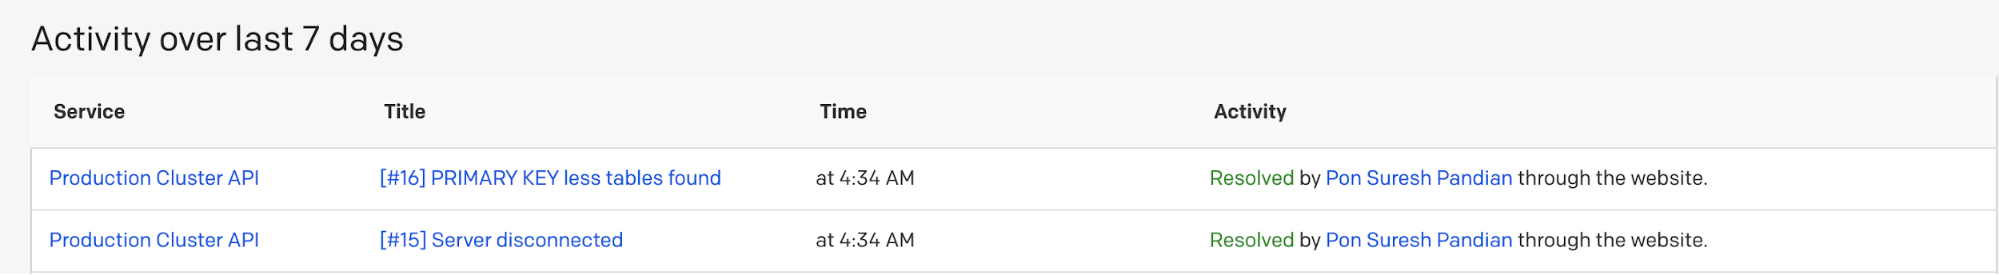
Once the server is back online, just select the alerts in PagerDuty and resolve them. The integration with PagerDuty is really easy to set up and it will allow your team to develop and manage the on-call rotation while using ClusterControl to manage your databases.


