blog
How to Monitor MongoDB with Prometheus & ClusterControl

SCUMM (Severalnines ClusterControl Unified Monitoring & Management) is an agent-based solution with agents installed on the database nodes. It provides a set of monitoring dashboards, that have Prometheus as the data store with its elastic query language and multi-dimensional data model. Prometheus scrapes metrics data from exporters running on the database hosts.
ClusterControl SCUMM architecture was introduced with version 1.7.0 extending monitoring functionality for MySQL, Galera Cluster, PostgreSQL & ProxySQL.
The new ClusterControl 1.7.1 adds high-resolution monitoring for MongoDB systems.
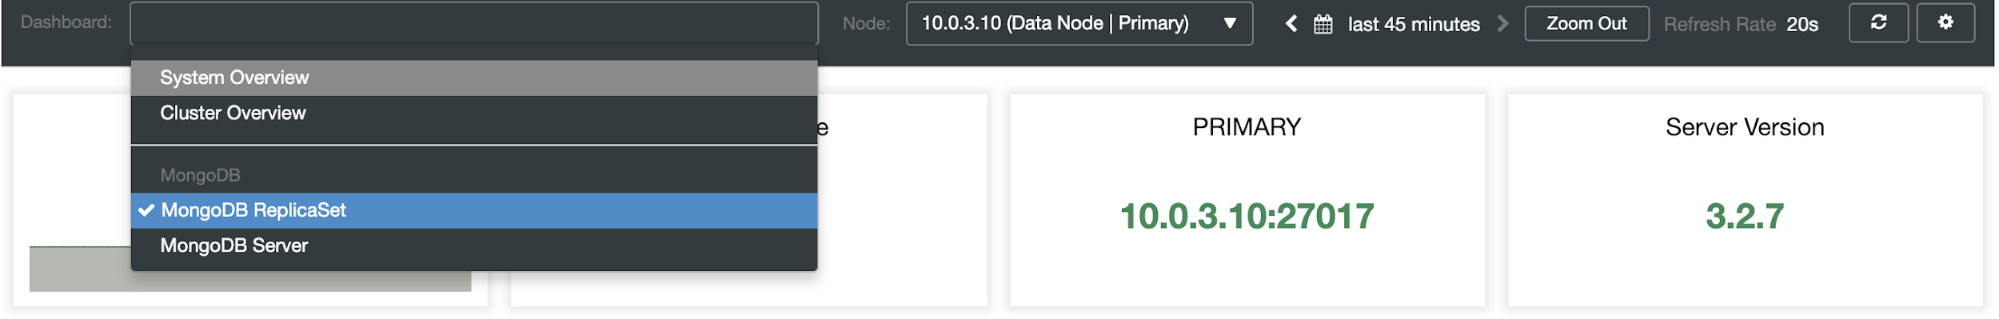
In this article, we will describe the two main dashboards for MongoDB environments. MongoDB Server and MongoDB Replicaset.
Dashboard and Metrics List
The list of dashboards and their metrics:
| MongoDB Server | |
|---|---|
| Name ReplSet Name Server Uptime OpsCounters Connections WT – Concurrent Tickets (Read) WT – Concurrent Tickets (Write) WT – Cache Global Lock Asserts |
| MongoDB ReplicaSet | |
|---|---|
| ReplSet Size ReplSet Name PRIMARY Server Version Replica Sets and Members Oplog Window per ReplSet Replication Headroom Total of PRIMARY/SECONDARY online per ReplSet Open Cursors per ReplSet ReplSet – Timed-out Cursors per Set Max Replication Lag per ReplSet Oplog Size OpsCounters Ping Time to Replica Set Members from PRIMARY(s) |
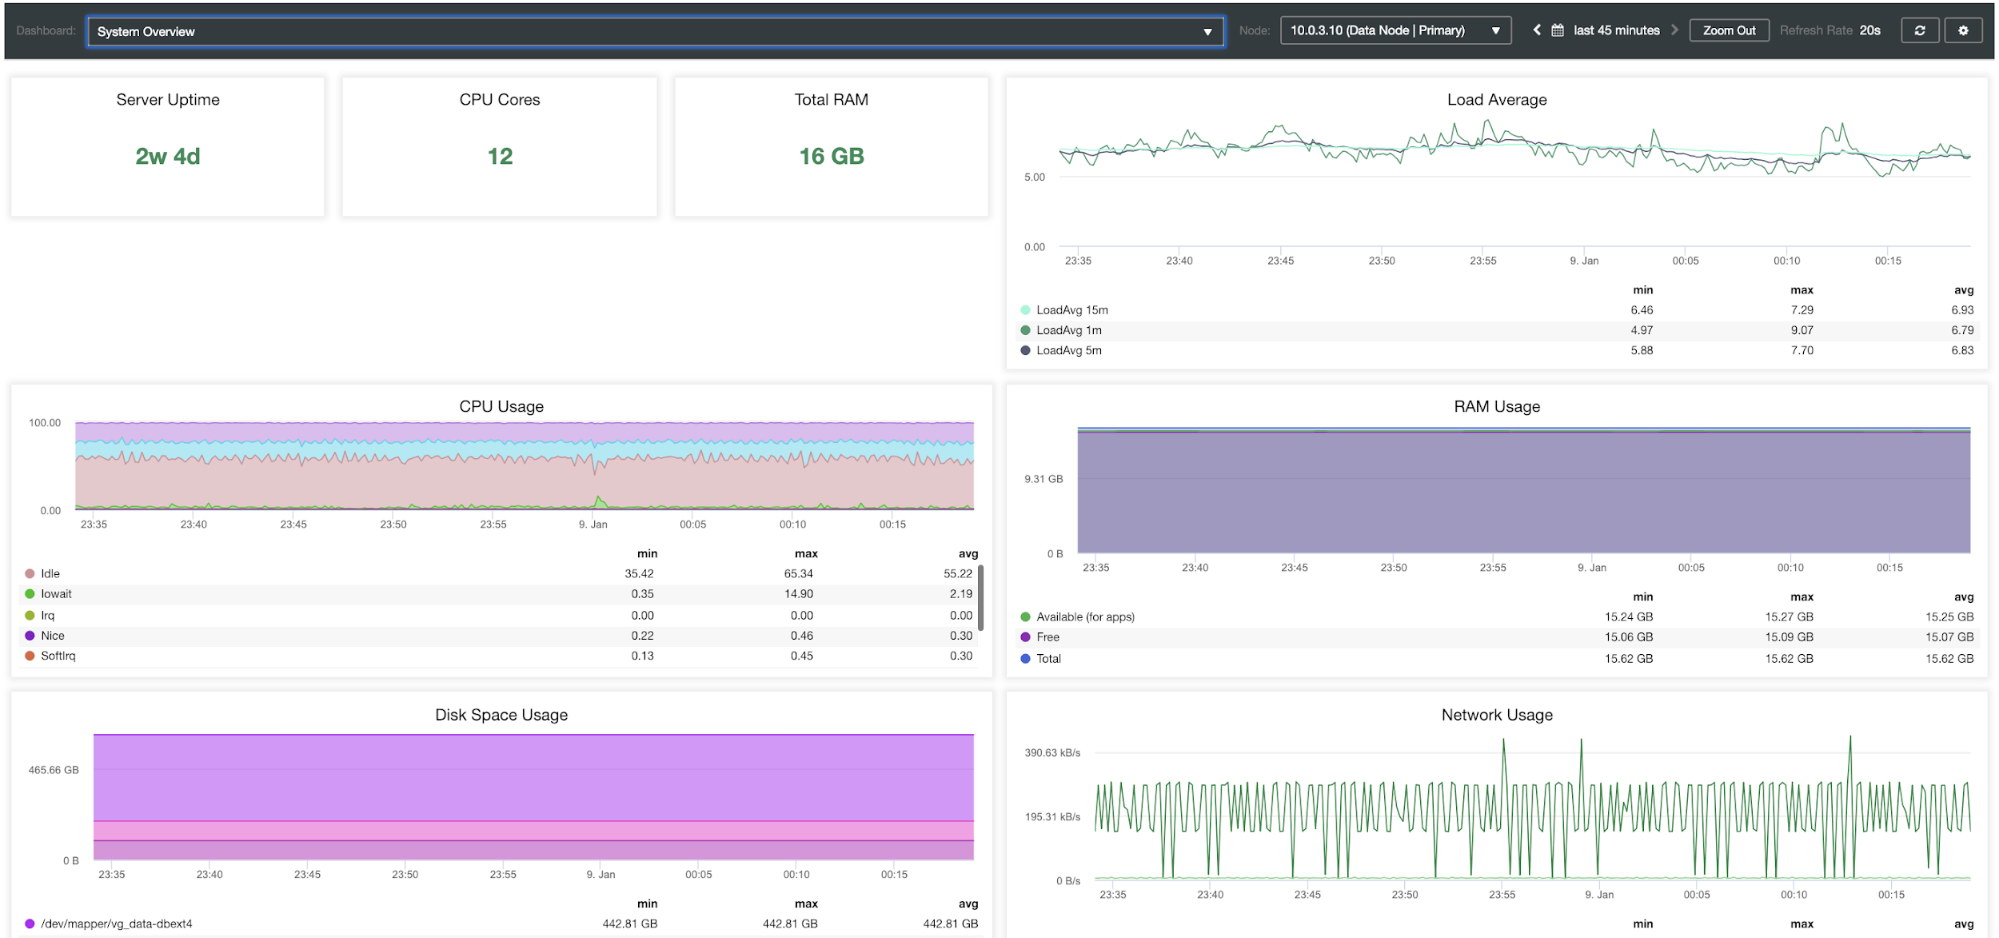
Database systems heavily depend on OS resources, so you can also find two additional dashboards for System Overview and Cluster Overview of your MongoDB environment.
| System Overview | |
|---|---|
| Server Uptime CPU Cores Total RAM Load Average CPU Usage RAM Usage Disk Space Usage Network Usage Disk IOPS Disk IO Util % Disk Throughput |
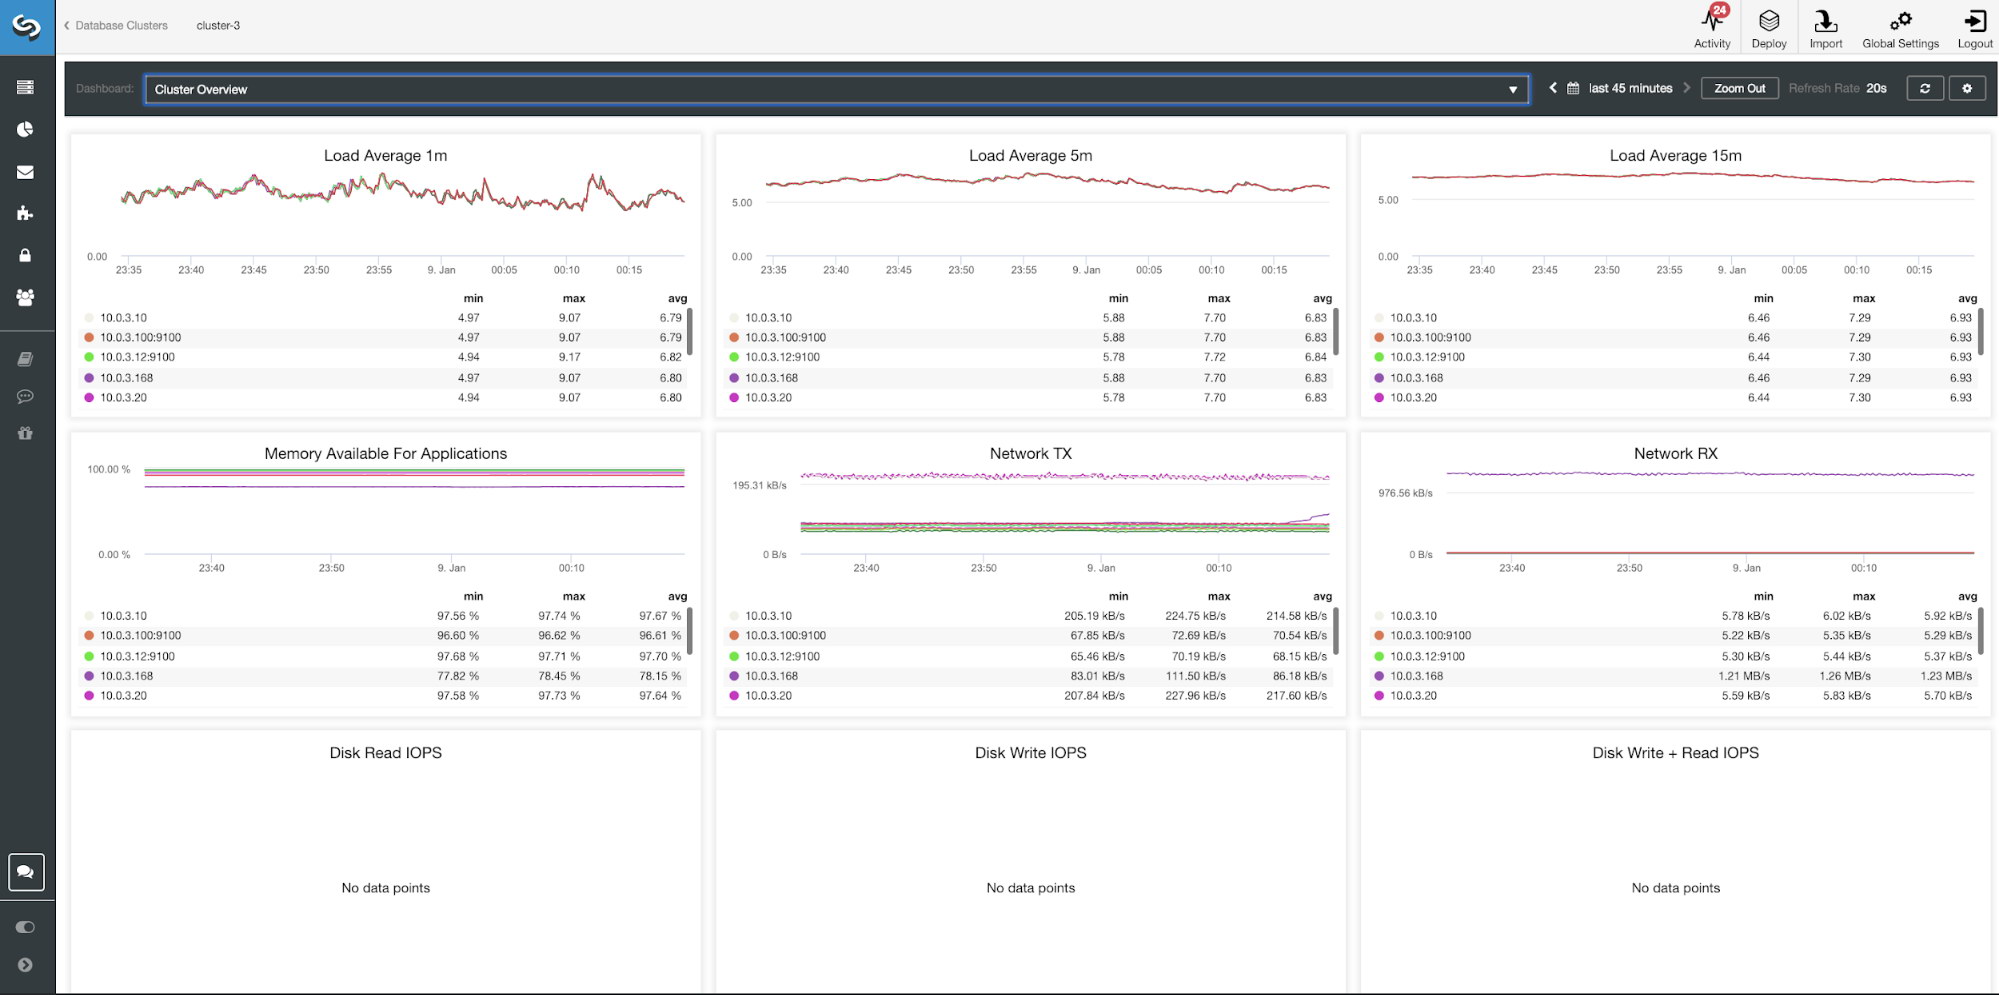
| Cluster Overview | |
|---|---|
| Load Average 1m Load Average 5m Load Average 15m Memory Available For Applications Network TX Network RX Disk Read IOPS Disk Write IOPS Disk Write + Read IOPS |
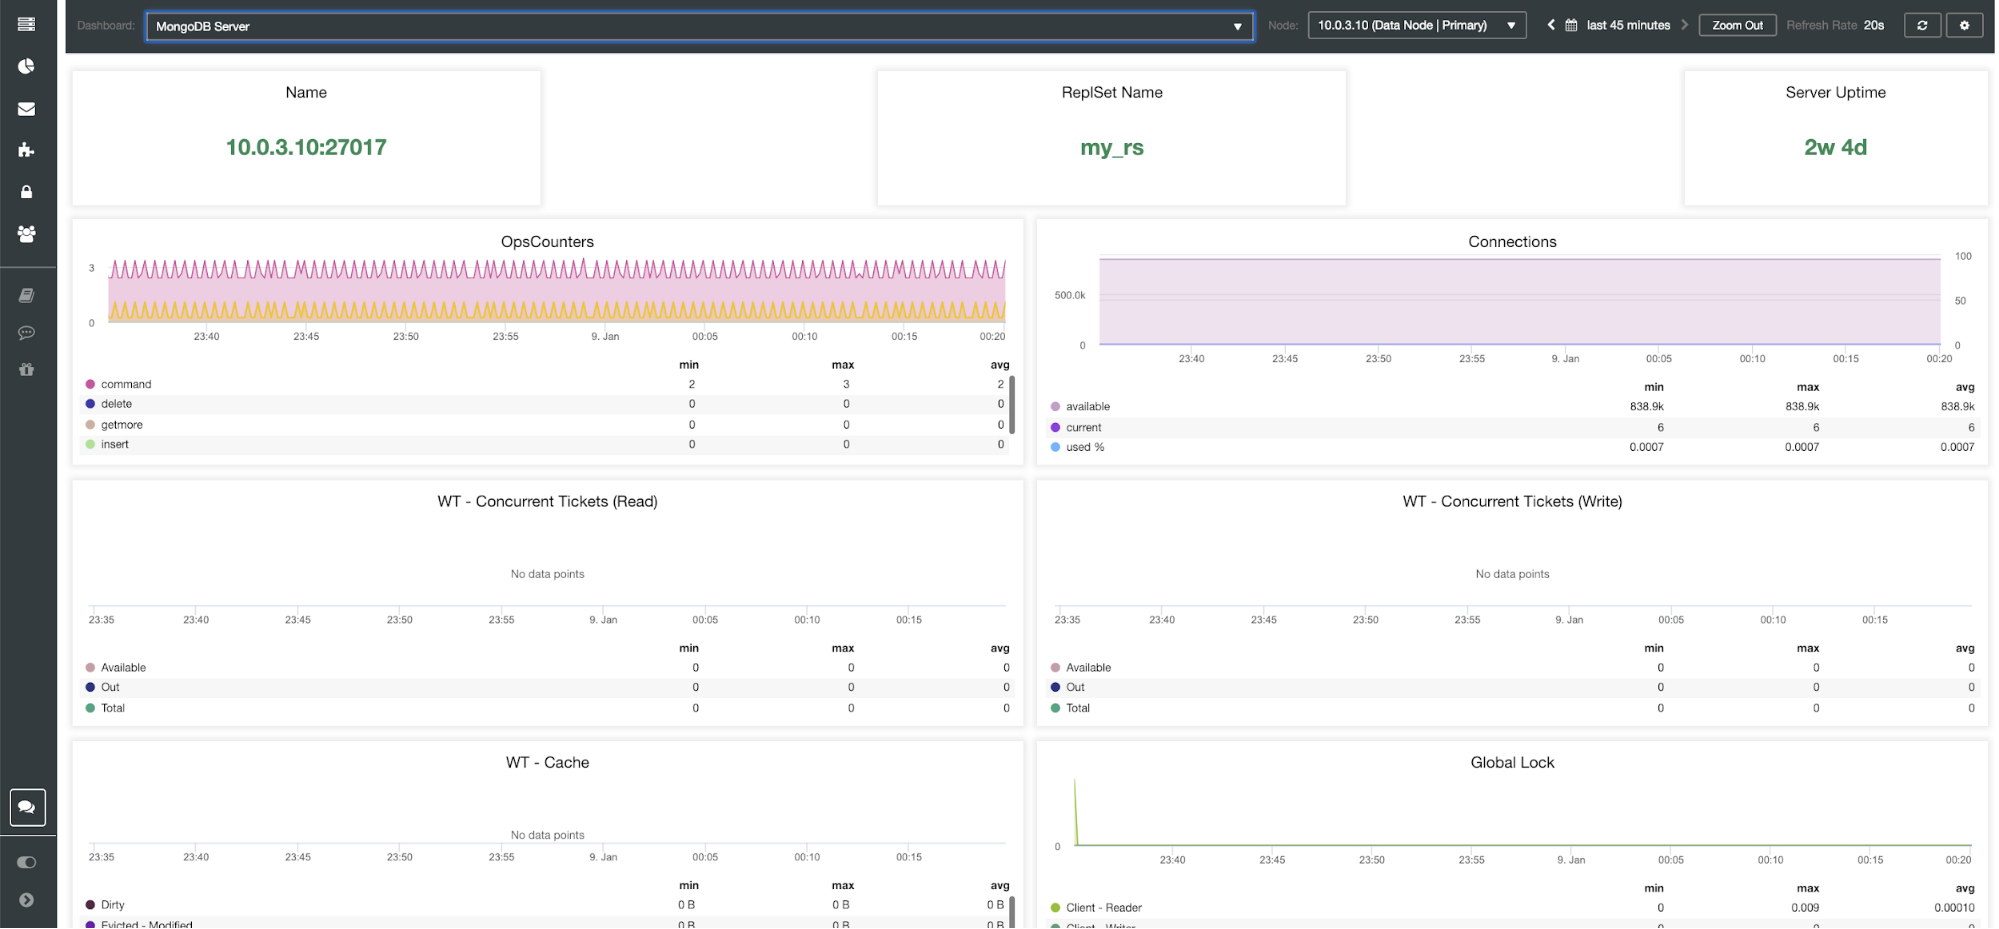
MongoDB Server Dashboard
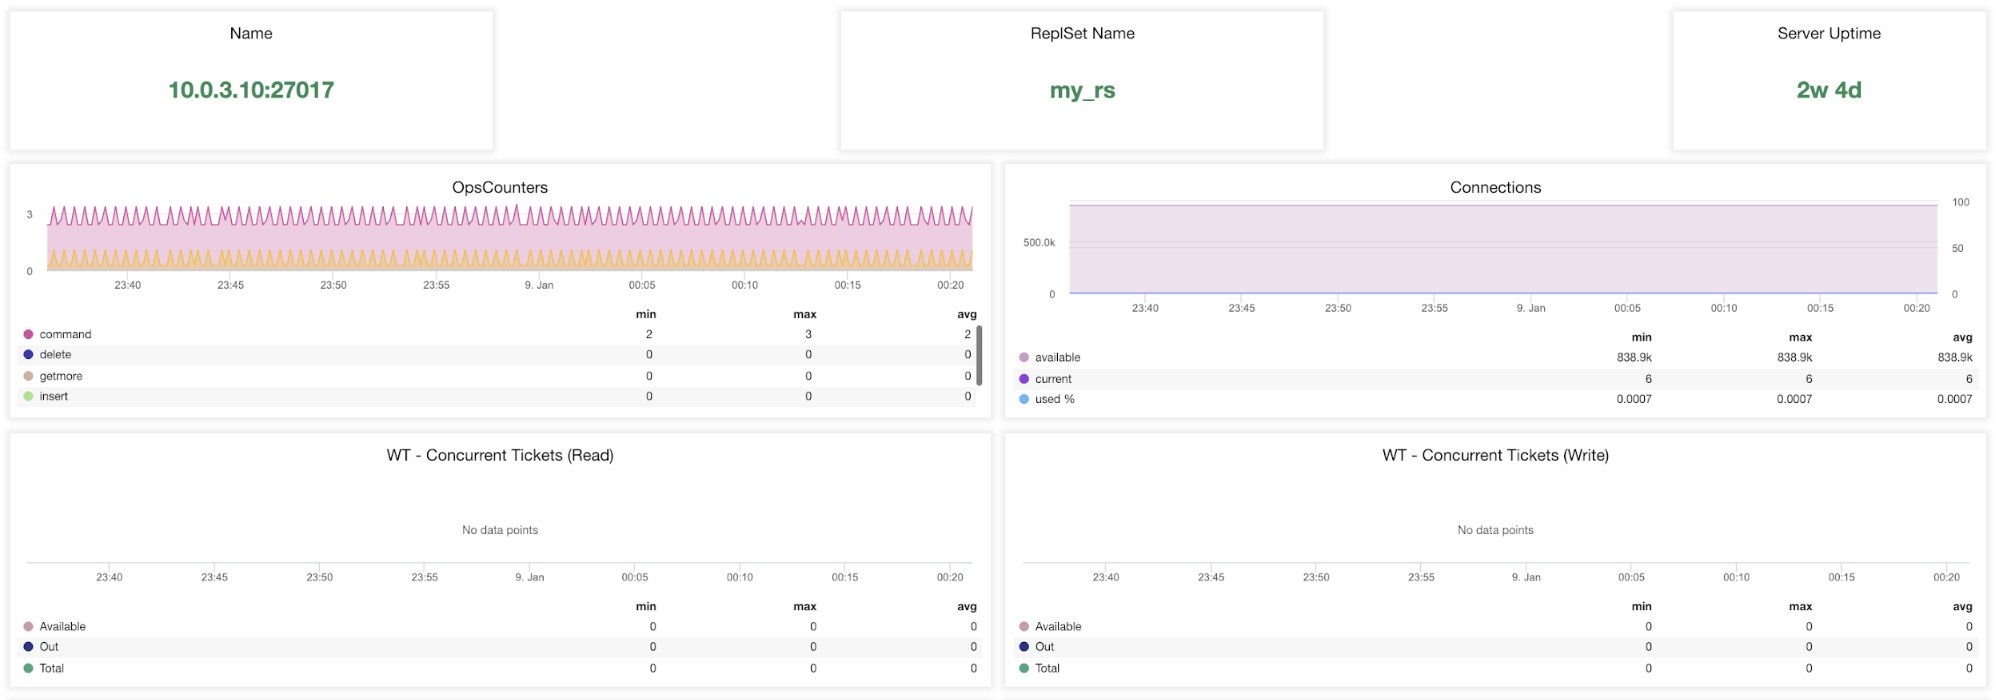
Name – Server address and the port.
ReplsSet Name – Presents the name of the replica set where the server belongs to.
Server Uptime – Time since last server restart.
Ops Couters – Number of requests received during the selected time period broken up by the type of the operation. These counts include all received operations, including ones that were not successful.
Connections – This graph shows one of the most important metrics to watch – the number of connections received during the selected time period including unsuccessful requests. Abnormal traffic loads can lead to performance issues. If MongoDB runs low on connections, it may not be able to handle incoming requests in a timely manner.
WT – concurrent Tickets (Read) / WT – concurrent TIckets (Write) These two graphs show read and write tickets which control concurrency in WiredTiger (WT). WT tickets control how many read and write operations can execute on the storage engine at the same time. When available read and write tickets drop to zero, the number of concurrent running operations is equal to the configured read/write values. This means that any other operations must wait until one of the running threads finishes its work on the storage engine before executing.
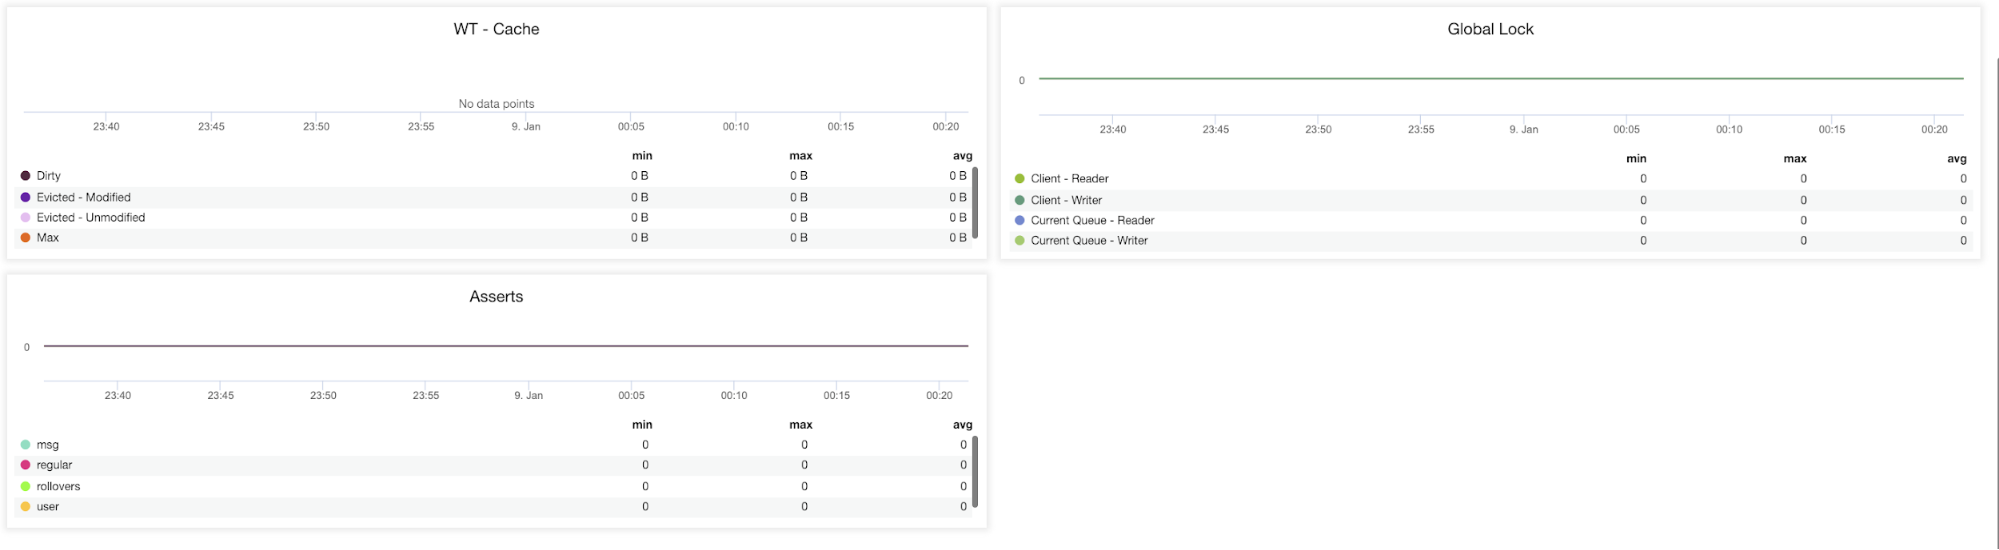
WT – Cache (Dirty, Evicted – Modified, Evicted – Unmodified, Max) – The size of the cache is the single most important knob for WiredTiger. By default, MongoDB 3.x reserves 50% (60% in 3.2) of the available memory for its data cache.
Global Lock (Client-Read, Client – Write, Current Queue – Reader, Current Queue – Writer) – Poor schema design patterns or heavy read and write requests from many clients may cause extensive locking. When this occurs, there is a need to maintain consistency and avoid write conflicts.
To achieve this MongoDB uses multi-granularity-locking which enables locking operations to happen at different levels, such as a global, database, or collection level.
Asserts (msg, regular, rollovers, user) – This graph shows the number of asserts that are raised each second. High values and deviations from trends should be reviewed.
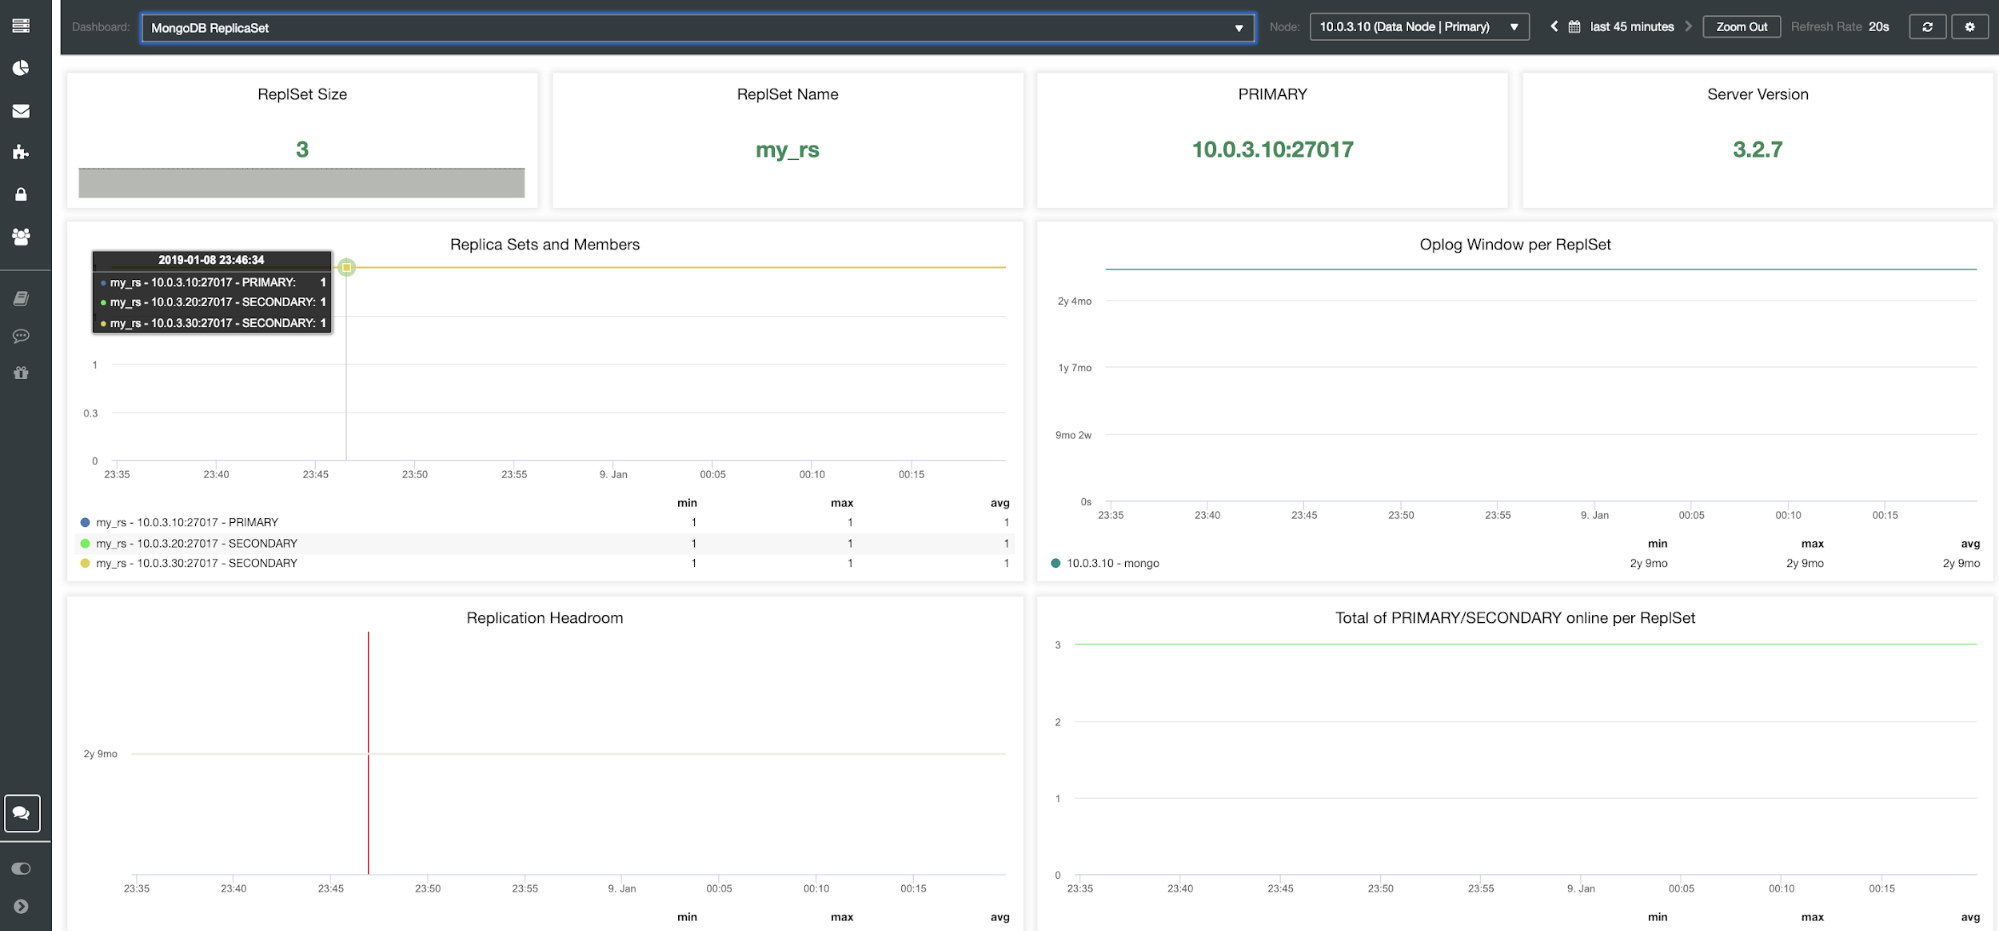
MongoDB ReplicaSet Dashboard
The metrics that are shown in this dashboard matter only if you use a replica set.
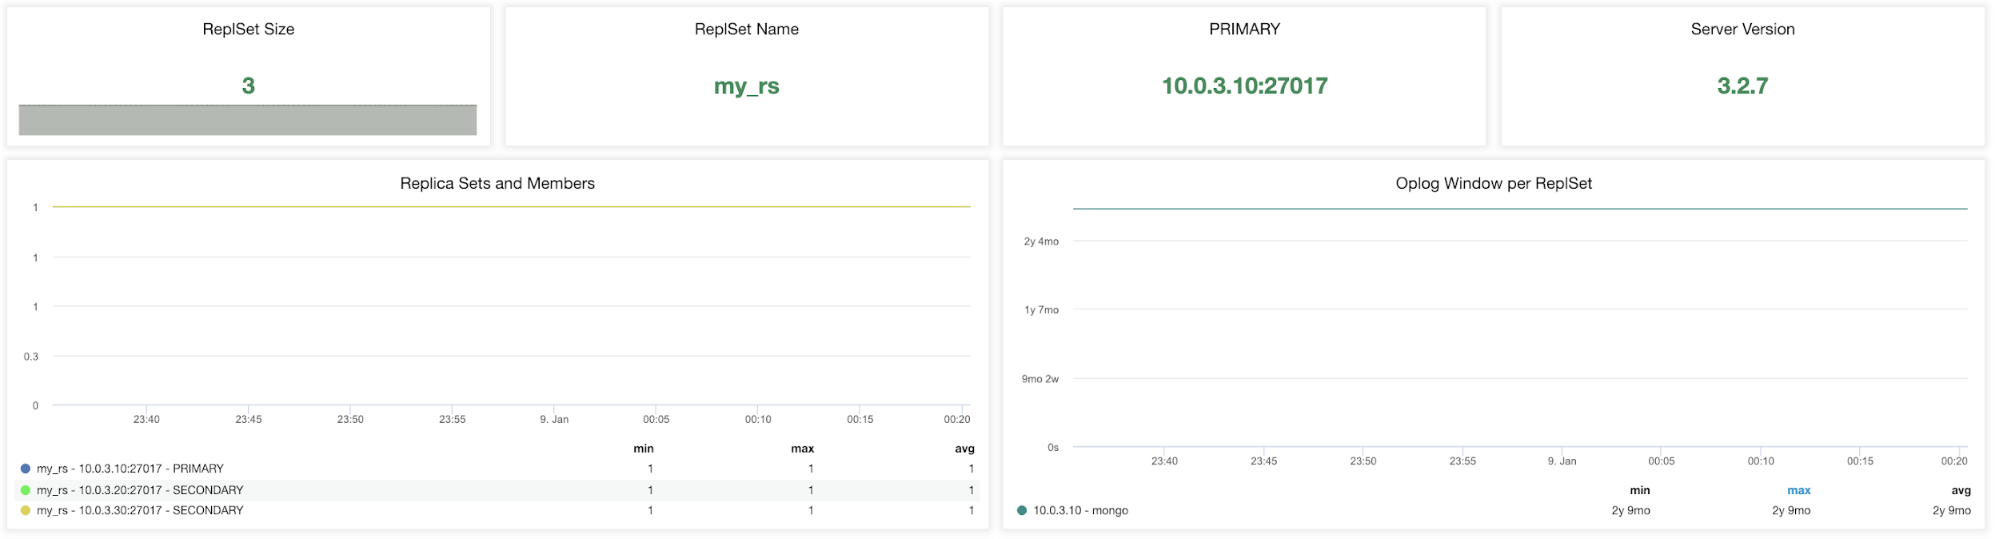
ReplicaSet Size – The number of members in the replica set. The standard replica set deployment for the production system is a three-member replica set. Generally speaking, it is recommended that a replica set has an odd number of voting members. Fault tolerance for a replica set is the number of members that can become unavailable and still leave enough members in the set to elect a primary. The fault tolerance for three members is one, for five it is two etc.
ReplSet Name – It is the name assigned in the MongoDB configuration file. The name refers to /etc/mongod.conf replSet value.
PRIMARY – The primary node receives all the write operations and records all other changes to its data set in its operation log. The value is to identify the IP and port of your primary node in the MongoDB replica set cluster.
Server Version – Identify the server version. ClusterControl version 1.7.1 supports MongoDB versions 3.2/3.4/3.6/4.0.
Replica Sets and Members (min, max, avg) – This graph can help you to identify active members over the time period. You can track the minimum, maximum and average numbers of primary and secondary nodes and how these numbers changed over time. Any deviation may affect fault tolerance and cluster availability.
Oplog Window per ReplSet – Replication window is an essential metric to watch. The MongoDB oplog is a single collection that has been limited in a (preset) size. It can be described as the difference between the first and the last timestamp in the oplog.rs. It is the amount of time a secondary can be offline before initial sync is needed to sync the instance. These metrics inform you how much time you have left before our next transaction is dropped from the oplog.
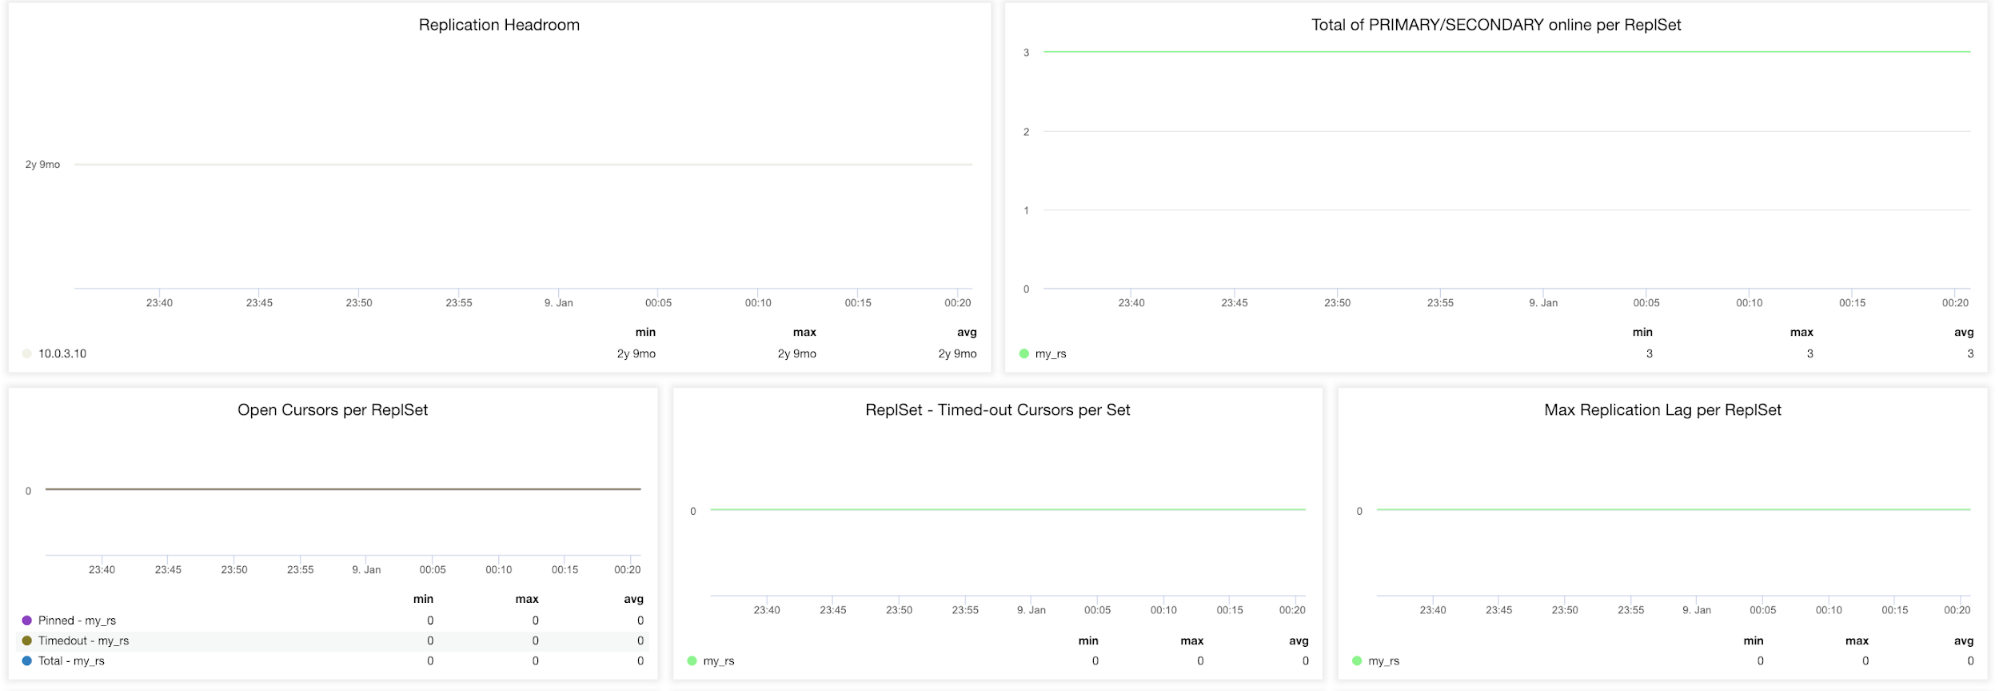
Replication Headroom – This graph presents the difference between the primary’s oplog window and the replication lag of the secondary nodes. The MongoDB oplog is limited in size and If the node lags too far, it won’t be able to catch up. If this happens, full sync will be issued and this is an expensive operation that has to be avoided at all times.
Total of PRIMARY/SECONDARY online per ReplSet – Total number of cluster nodes over the time period.
Open Cursors per ReplSet (Pinned, Timeout, Total) – A read request comes with a cursor which is a pointer to the data set of the result. It will remain open on the server and hence consume memory unless it is terminated by the default MongoDB setting. You should be identifying non-active cursors and cut them off to save on memory.
ReplSet – Timeout Cursors per SetsMax Replication Lag per ReplSet – Replication lag is very important to keep an eye on if you are scaling out reads via adding more secondaries. MongoDB will only use these secondaries if they don’t lag too far behind. If the secondary has replication lag, you risk serving out stale data that already has been overwritten on the primary.
OplogSize – Certain workloads might require larger oplog size. Updates to multiple documents at once, deletions equal the same amount of data as an insert or the significant number of in-place updates.
OpsConters – This graph shows the number of queries executions.
Ping Time to Replica Set Member from Primary – This lets you discover replica set members that are down or unreachable from the primary node.
Closing Remarks
The new ClusterControl 1.7.1 MongoDB dashboard feature is available in the Community Edition for free. Database ops teams can profit from it by using the high-resolution graphs, especially when performing their daily routines as root cause analyzes and capacity planning.
It’s just a matter of one click to deploy new monitoring agents. ClusterControl installs Prometheus agents, configures metrics and maintains access to Prometheus exporters configuration via its GUI, so you can better manage parameter configuration like collector flags for the exporters (Prometheus).
By adequately monitoring the number of reads and write requests you can prevent resource overload, quickly find the origin of potential overloads, and know when to scale up.