blog
Elasticsearch performance optimization

Performance optimization, or “performance tuning,” is an ongoing process, not a one-time task. After making changes and testing them, continuous monitoring is essential to determine if further adjustments are necessary. This applies to Elasticsearch and any software or system that requires optimization.
Performance tuning should not be overlooked in any organization. A dedicated engineering or development team or a technical expert must oversee the performance of your Elasticsearch cluster.
Elasticsearch is widely recognized for its ability to manage large volumes of data and deliver fast search results. It’s specifically designed to handle massive datasets and high-speed transactions. Over time, as your data grows, you may notice performance degradation. This is a natural consequence as data increases in size and complexity.
This blog will explore the key areas to consider when optimizing the performance of your Elasticsearch cluster.
What performance issues can arise in Elasticsearch?
Performance degradation in Elasticsearch is inevitable as data grows, especially when the data becomes more complex and diverse. Over time, you may notice a decline in performance. Various factors, including the nature of the data, configuration settings, and hardware resources, can cause this. Changes in how you use the cluster and the volume and types of data being processed can also contribute to performance issues.
It’s crucial to monitor the health of your Elasticsearch cluster regularly to maintain optimal performance. Setting up alerts helps you proactively address potential issues before they impact the system, allowing for better maintenance or adjustment planning.
Misconfiguration, setup, and inadequate resources
Lack of familiarity with Elasticsearch can lead to misconfigurations that hurt performance and may even cause system failures. Understanding how to configure Elasticsearch properly is crucial for fully utilizing its capabilities and ensuring optimal performance.
When setting up your nodes, it’s essential to define their roles. Is the node intended to be a master node, or is it just for storing data? If it’s a data node, is it a hot or cold node? You may also need nodes dedicated to machine learning (ML), ingest, or transform. Assigning the correct role to each node is vital based on the resources available. Using the default settings, which assigns all node roles, can strain resources and degrade performance.
Elasticsearch relies on JVM technology, meaning it can be memory-intensive. To ensure optimal performance, allocate at least 50% of the system’s total memory to the JVM heap. However, it’s important to leave enough memory for the operating system (OS) to function properly. Any memory not assigned to the JVM heap is used by the OS for running processes and file system caching, both of which affect Elasticsearch’s performance. Allocating too much memory to the JVM heap can starve the OS, potentially triggering out-of-memory (OOM) errors on Linux systems.
Sufficient CPU resources also benefit Elasticsearch. A minimum of 4 CPU cores is recommended, though more may be necessary as your production environment grows. Along with powerful CPUs, sufficient disk space and high disk throughput are critical, as Elasticsearch is highly I/O-intensive. SSDs with high throughput are ideal for handling Elasticsearch’s heavy read and write traffic.
Shards and replicas
Choosing the wrong number of shards and replicas can severely impact your Elasticsearch performance. As of Elasticsearch version 7, the default number of primary shards per index is 1, whereas, in versions prior to 7, the default was 5. The default number of replicas is now set to 1. Using too many shards or replicas can degrade performance, so it’s essential to configure them according to your specific requirements.
Imagine you have 5 primary shards and send a bulk request with 1000 documents. In this case, each shard will index 200 documents in parallel. Once all documents are indexed, Elasticsearch sends the response back to the client, and the next batch of documents can be indexed.
This process, depending on the nature and size of your data, can impact your Elasticsearch performance. The more documents you index, the more load you place on each shard, potentially leading to slower indexing times or higher resource usage.
To optimize performance, it’s essential to adjust your configuration based on your actual needs. This requires benchmarking and testing. Running queries and experiments will help you understand how your data and queries impact your cluster. By doing so, you can fine-tune your number of shards and replicas to ensure optimal performance.
To check the current shard and replica settings for your indices, you can run:
GET /_all/_settings
or
GET /my-index/_settings
where my-index is the name of your specific index.
Although adjusting the number of replicas is possible, changing the number of primary shards for existing indices is not. This requires reindexing, which means you’ll need to recreate the index. Otherwise, you’ll encounter an error like the one shown below:
PUT /hello_world/_settings
{
     "number_of_replicas": 3,
     "number_of_shards": 3
}

output below,
{
  "error": {
    "root_cause": [
      {
        "type": "illegal_argument_exception",
        "reason": "final hello_world setting [index.number_of_shards], not updateable"
      }
    ],
    "type": "illegal_argument_exception",
    "reason": "final hello_world setting [index.number_of_shards], not updateable"
  },
  "status": 400
}
In this case, you may need to re-create or re-index your current index. However, if you’re creating a new index, ensure that you set the number of shards and replicas according to your desired configuration:
PUT /my-index
{
  "settings": {
    "number_of_shards": 3,
    "number_of_replicas": 2
  }
}
Having too many replicas can lead to increased resource usage, negatively affecting the performance of your Elasticsearch cluster. If the number of replicas significantly exceeds your needs, it can slow down indexing operations, ultimately reducing the overall throughput and performance of your cluster.
Having too many replicas requires more storage space, leading to higher storage costs. Additionally, unnecessary resource usage from excessive replicas can cause instability in your Elasticsearch cluster.
In this case, it’s essential to use the right tools and approaches, such as benchmarking and following best practices. The optimal number of primary shards and replicas, as well as the appropriate shard size, depends on various factors, including the size of your data, your use cases, query patterns, document complexity, and your Service Level Agreements (SLAs).
If you’re just starting out, we recommend starting with a minimal configuration and adjusting it as needed in the future.
Identifying the necessary caches
By default, Elasticsearch has query caching enabled and allocates 10% of the memory for the filter cache. It uses an LRU (Least Recently Used) eviction policy, meaning that when the cache is full, the least recently used data is evicted to make room for new data. This can lead to issues where the filesystem cache doesn’t have enough memory to store frequently queried parts of the index.
Set aside at least 50% of the physical RAM for the filesystem cache. The more memory allocated, the more data can be cached, especially if the cluster is experiencing I/O issues. Assuming the heap size is properly configured, any remaining physical RAM used for the filesystem cache will significantly improve search performance.
For example, on a server with 128GB of RAM, you might allocate 30GB for the heap, leaving the remaining memory for the filesystem cache (also known as OS cache). The OS cache stores recently accessed 4KB blocks of data, so if the same files are read repeatedly, the system can serve the data directly from memory instead of accessing the disk, improving read performance.
In addition to the filesystem cache, Elasticsearch uses query and request caches to speed up searches. These caches can be optimized using the search_request_preference setting, which routes specific search requests to the same set of shards each time. This ensures better utilization of the request cache, node query cache, and filesystem cache, improving overall search performance.
Elasticsearch also uses a concept called Field Data, which essentially inverts the reverse index. For example, if you need to search for all the values of a particular field, such as http_status_code, and want to retrieve all occurrences of 200s, 4xxs, 5xxs, etc., Elasticsearch creates the reverse of the reverse index, known as field data. This data is generated at query time and stored in memory – specifically, in the heap. Since this process is resource-intensive, the field data remains in heap memory for the duration of the segment’s lifecycle by default. If not managed properly, this can quickly consume a large portion of your heap memory. To avoid this issue, consider the following:
Limit the amount of heap memory used by field data by configuring the indices.fielddata.cache.size setting. This can be defined either as a percentage or a static value.
While doc values are the default for most fields, some fields may require manual mapping. It’s important to note that text fields do not support doc values.
Best practices for performance optimization in Elasticsearch
Ensure you follow best practices for optimizing your Elasticsearch cluster. While managing such a complex technology can be challenging, benchmarking and testing should always be conducted before implementing any changes or improvements.
Keep track of metrics
This advice focuses on Elasticsearch monitoring. To ensure efficient site search performance, it’s important to understand the current performance level. Elasticsearch is made up of multiple components, each influencing the overall system performance. Below are some key indicators to monitor closely.
- Cluster Health: This metric provides a quick overview of your cluster’s configuration and overall health. It can be used to assess the status of the entire cluster or specific indices and shards. There are three health statuses:
- Red: A specific shard is not allocated in the cluster.
- Yellow: The primary shard is allocated, but the replicas are not.
- Green: All shards, including replicas, are successfully allocated.
- Indexing Rate: This metric measures how many documents are being added to the index over a specific period of time. A higher indexing rate increases the likelihood that your infrastructure can handle the growing demands of your workload.
- Query Rate and Latency: The query rate indicates how many requests per second your Elasticsearch installation can process, while query latency measures the delays in processing those requests. The ideal scenario is a high query rate with low latency, ensuring efficient and fast search performance.
- Refresh Time: Refresh time refers to how long it takes for a page to reload after being refreshed. Shorter refresh times are preferable, as very long refresh times can indicate performance issues and should be addressed to maintain optimal system responsiveness.
- CPU Usage and Disk Space: As more data is generated over time, you will need to allocate additional storage space. Similarly, a more powerful CPU is required to handle the increased volume of data and requests. It’s important to monitor CPU usage and disk space to ensure that resources are sufficient. If either of these becomes inadequate, additional hardware may be necessary.
To check some of the metrics, enable developer mode on your e-commerce platform and start by analyzing any issues or warnings generated by your code. Use your web browser’s developer tools to debug client-side JavaScript issues via the console, and leverage the network tab to monitor the loading speed and sequence of scripts, images, and other files on your site.
Hardware
Hardware plays a crucial role in search performance tuning. While adding more hardware can help scale Elasticsearch, it’s not the only solution. Even the best optimization efforts can be ineffective without the right hardware. When handling large volumes of data and providing fast access to your users, ensuring you have the proper hardware is essential.
Here are some suggestions for expanding your Elasticsearch installation:
- Basic Considerations: To maximize Elasticsearch performance, focus on optimizing key hardware aspects such as cache, storage space, CPUs, and RAM.
- Scaling: Scaling Elasticsearch isn’t just about adding more powerful hardware. It’s important to address performance issues first to avoid wasting resources. Technological success depends on your ability to innovate quickly, scale your computing power effectively, and leverage new content delivery channels.
- Performance Testing: Regular performance testing is essential to assess your hardware requirements. It helps you understand how your application will perform under increased traffic, slow server speeds, or network issues. By conducting these tests, you can make necessary hardware adjustments upfront, preventing potential issues and ensuring smooth functionality in the future.
Ensure you can easily scale hardware resources, such as CPU performance and memory capacity, to handle unexpected traffic spikes.
Load balancing
Each time you start an Elasticsearch instance, a new node is created. A cluster consists of multiple nodes connected to each other. By default, every node in the cluster handles both HTTP and transport traffic. In production environments with many nodes and high traffic, this can introduce additional network hops, which may impact performance.
Load balancing is a simple technique for distributing incoming traffic across multiple nodes. It works by directing requests to different nodes, gathering the results after processing, and then merging them to generate the final output. You can also configure the number of load balancers to optimize traffic distribution. This reduces the load on any single node, ultimately improving overall performance.
How to Enable Load Balancing in Elasticsearch: The Elasticsearch cluster includes load balancing by default. When setting up an elasticsearch.url that points to coordinating nodes, we recommend using a load balancer or round-robin DNS server. A load balancer enables you to switch, add, or delete data nodes and coordinating nodes without needing to edit the main configuration file or restart the service, minimizing downtime during changes.
Monitoring Elasticsearch cluster performance with ClusterControl
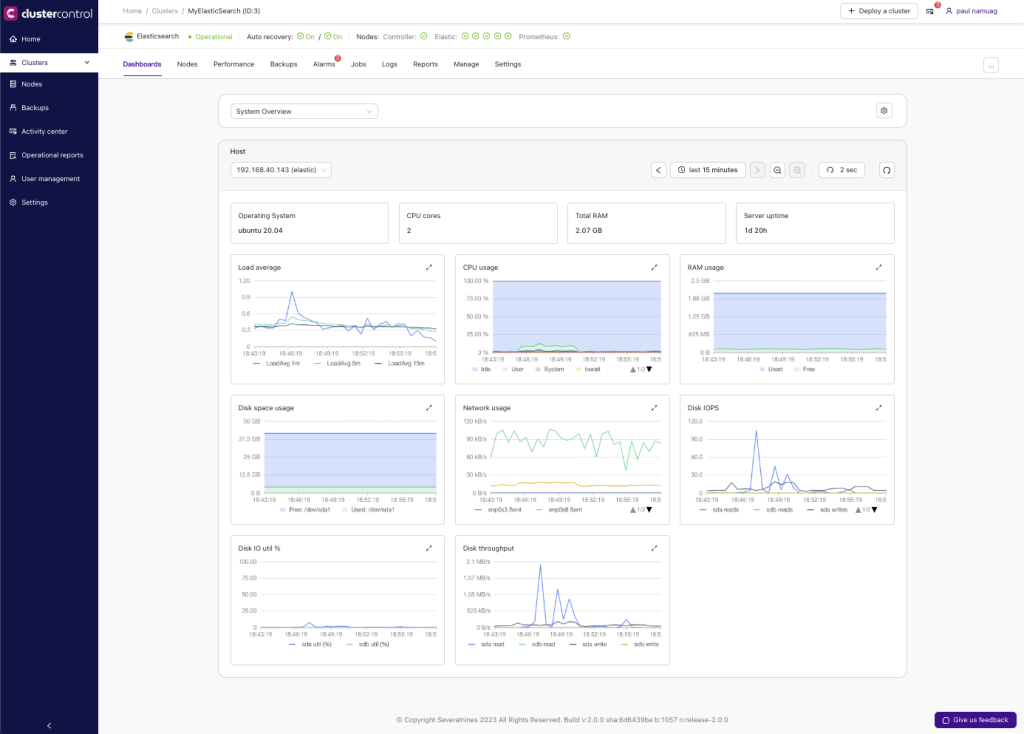
ClusterControl has supported Elasticsearch deployment since version 1.9.3. Once your Elasticsearch cluster is deployed and registered with ClusterControl, it will begin monitoring the cluster and provide alerts or alarms if any issues arise. This gives you full visibility into your cluster’s health, helping you optimize performance and track key metrics such as load average, CPU performance, memory usage, and disk utilization.
As shown below,

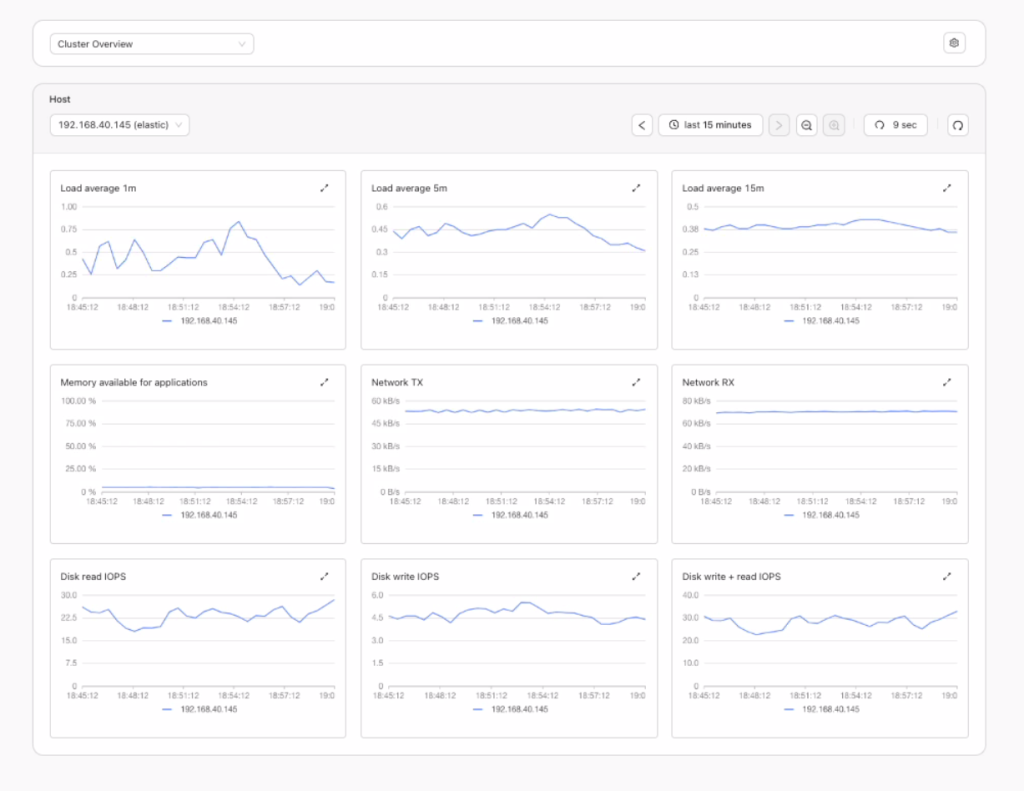
If you need to narrow your focus to a specific node, the cluster overview will display additional graphs, allowing you to select the node you wish to investigate.
See below,

This provides a quick overview, helping you identify areas that may be causing issues, such as latency (which could involve disk, network, CPU, or memory), or determining why query responses are slow, which may be due to overload or high load capacity. These issues can be further analyzed using load average metrics.
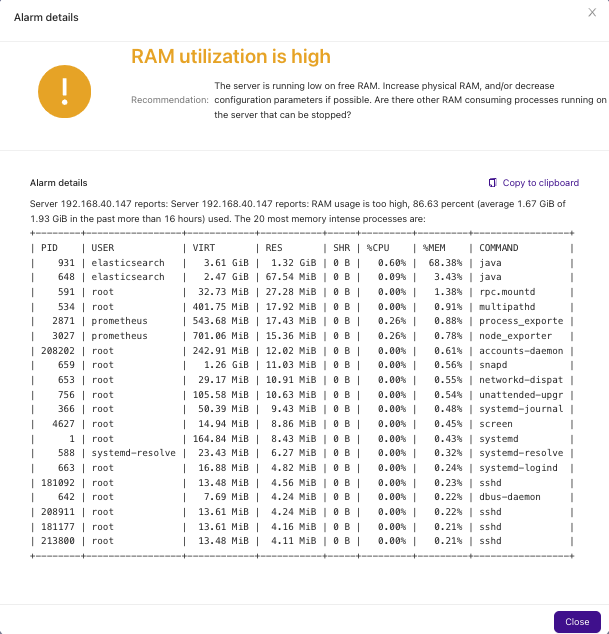
Clustercontrol is both proactive and reactive. Its proactive features provide enhanced observability through continuous monitoring, with alerts or alarms triggered when thresholds for your specific monitored areas are reached.
See below,

In this example, memory usage is high, indicating excessive utilization. By clicking the ellipsis button ([…]) in the Actions column, you can view detailed information about which processes are consuming too much memory. While it may not show which queries are using excessive memory, it will display system processes, helping you identify other processes that might be competing for memory alongside your Elasticsearch process. See below,

Monitoring can be a challenging task, especially when analyzing and tuning your Elasticsearch cluster for optimization. With ClusterControl, you can effectively address these issues, providing the support you need for daily operations and DBA tasks.
Wrapping Up
Optimizing Elasticsearch performance is a complex but vital task for ensuring the health of both your cluster and your business operations. As Elasticsearch handles large volumes of data and high-speed transactions, performance tuning becomes critical as your data grows.
To effectively optimize performance, it’s important to build expertise in Elasticsearch and to have the right tools for monitoring and observability. By continuously assessing and fine-tuning your cluster’s configuration, hardware, and resource usage, you can keep it running at its best.
With the right knowledge and tools, such as ClusterControl, you can proactively monitor your Elasticsearch cluster, address issues as they arise, and maintain optimal performance over time.
Ready to take control of your Elasticsearch performance? Start your free trial of ClusterControl today.
Follow us on LinkedIn and X to stay connected and gain more valuable insights. Look out for upcoming content!


