blog
Dealing with MySQL Long Running Queries

Long running queries/statements/transactions are sometimes inevitable in a MySQL environment. In some occasions, a long running query could be a catalyst to a disastrous event. If you care about your database, optimizing query performance and detecting long running queries must be performed regularly. Things do get harder though when multiple instances in a group or cluster are involved.
When dealing with multiple nodes, the repetitive tasks to check every single node is something that we have to avoid. ClusterControl monitors multiple aspects of your database server, including queries. ClusterControl aggregates all the query-related information from all nodes in the group or cluster to provide a centralized view of workload. Right there is a great way to understand your cluster as a whole with minimal effort.
In this blog post, we show you how to detect MySQL long running queries using ClusterControl.
Why a Query Takes Longer Time?
First of all, we have to know the nature of the query, whether it is expected to be a long running or a short running query. Some analytic and batch operations are supposed to be long running queries, so we can skip those for now. Also, depending on the table size, modifying table structure with ALTER command can be a long running operation.
For a short-span transaction, it should be executed as fast as possible, usually in a matter of subsecond. The shorter the better. This comes with a set of query best-practice rules that users have to follow, like use proper indexing in WHERE or JOIN statement, using the right storage engine, picking proper data types, scheduling the batch operation during off-peak hours, offloading analytical/reporting traffic to dedicated replicas, and so on.
There are a number of things that may cause a query to take longer time to execute:
- Inefficient query – Use non-indexed columns while lookup or joining, thus MySQL takes longer time to match the condition.
- Table lock – The table is locked, by global lock or explicit table lock when the query is trying to access it.
- Deadlock – A query is waiting to access the same rows that are locked by another query.
- Dataset does not fit into RAM – If your working set data fits into that cache, then SELECT queries will usually be relatively fast.
- Suboptimal hardware resources – This could be slow disks, RAID rebuilding, saturated network etc.
- Maintenance operation – Running mysqldump can bring huge amounts of otherwise unused data into the buffer pool, and at the same time the (potentially useful) data that is already there will be evicted and flushed to disk.
The above list emphasizes it is not only the query itself that causes all sorts of problems. There are plenty of reasons which require looking at different aspects of a MySQL server. In some worse-case scenario, a long running query could cause a total service disruption like server down, server crash and connections maxing out. If you see a query takes longer than usual to execute, do investigate it.
How to Check?
PROCESSLIST
MySQL provides a number of built-in tools to check the long running transaction. First of all, SHOW PROCESSLIST or SHOW FULL PROCESSLIST commands can expose the running queries in real-time. Here is a screenshot of ClusterControl Running Queries feature, similar to SHOW FULL PROCESSLIST command (but ClusterControl aggregates all the process into one view for all nodes in the cluster):
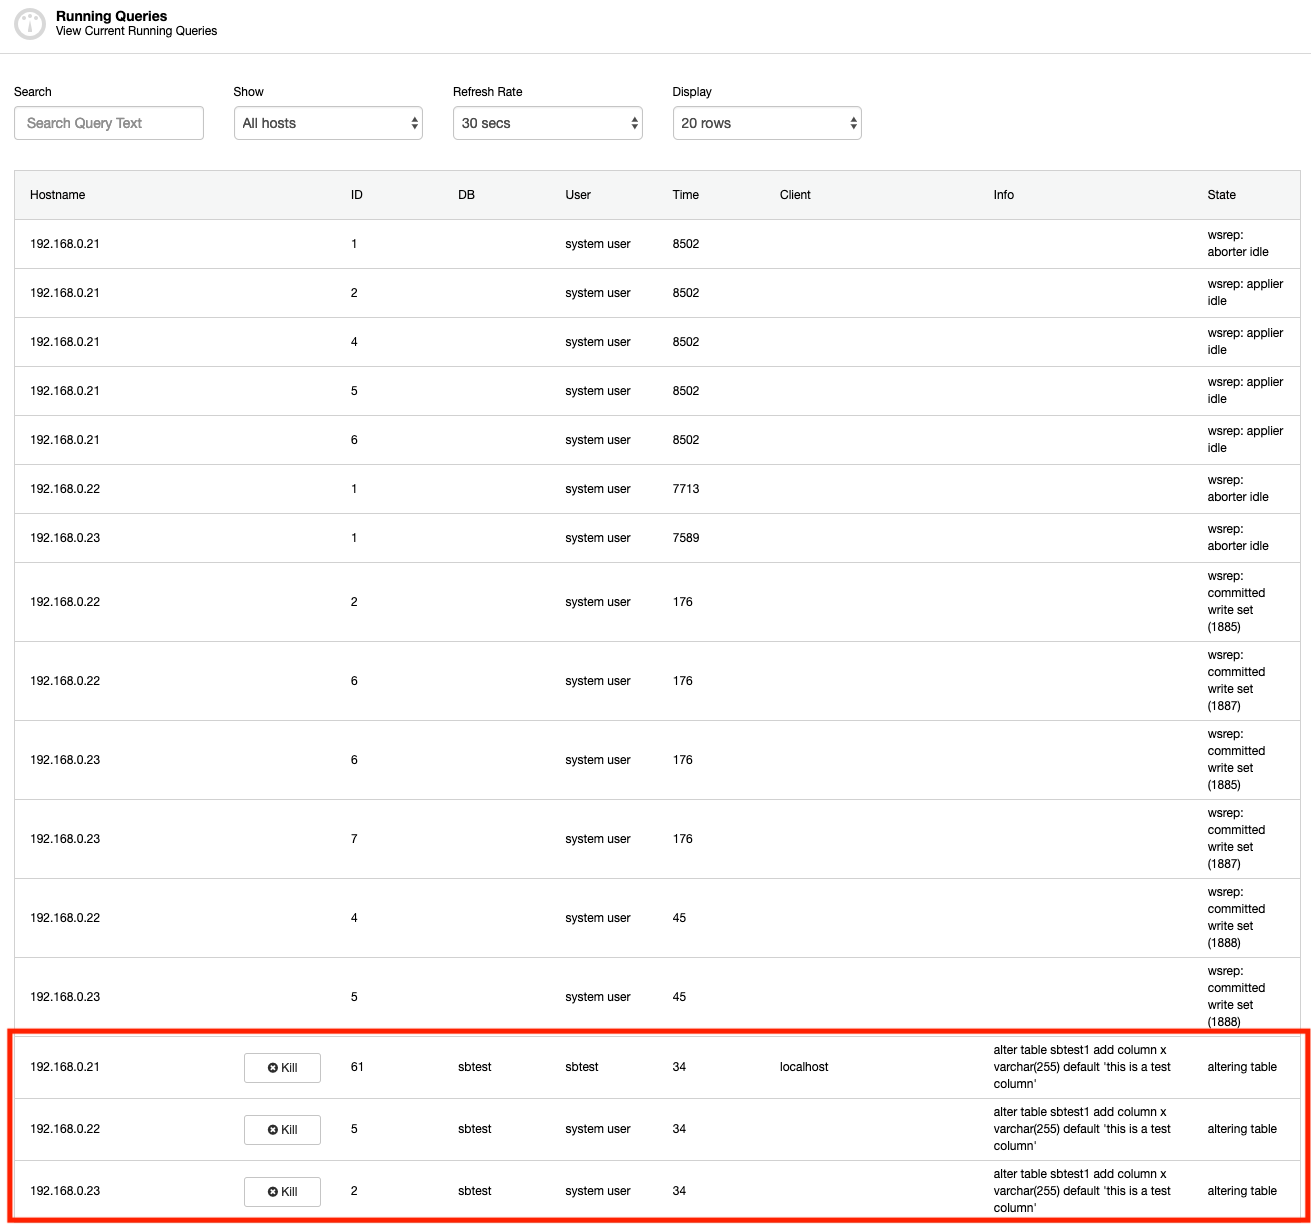
As you can see, we can immediately see the offensive query right away from the output. But how often do we stare at those processes? This is only useful if you are aware of the long running transaction. Otherwise, you wouldn’t know until something happens – like connections are piling up, or the server is getting slower than usual.
Slow Query Log
Slow query log captures slow queries (SQL statements that take more than long_query_time seconds to execute), or queries that do not use indexes for lookups (log_queries_not_using_indexes). This feature is not enabled by default and to enable it simply set the following lines and restart the MySQL server:
[mysqld]
slow_query_log=1
long_query_time=0.1
log_queries_not_using_indexes=1
The slow query log can be used to find queries that take a long time to execute and are therefore candidates for optimization. However, examining a long slow query log can be a time-consuming task. There are tools to parse MySQL slow query log files and summarize their contents like mysqldumpslow, pt-query-digest or ClusterControl Top Queries.
ClusterControl Top Queries summarizes the slow query using two methods – MySQL slow query log or Performance Schema:
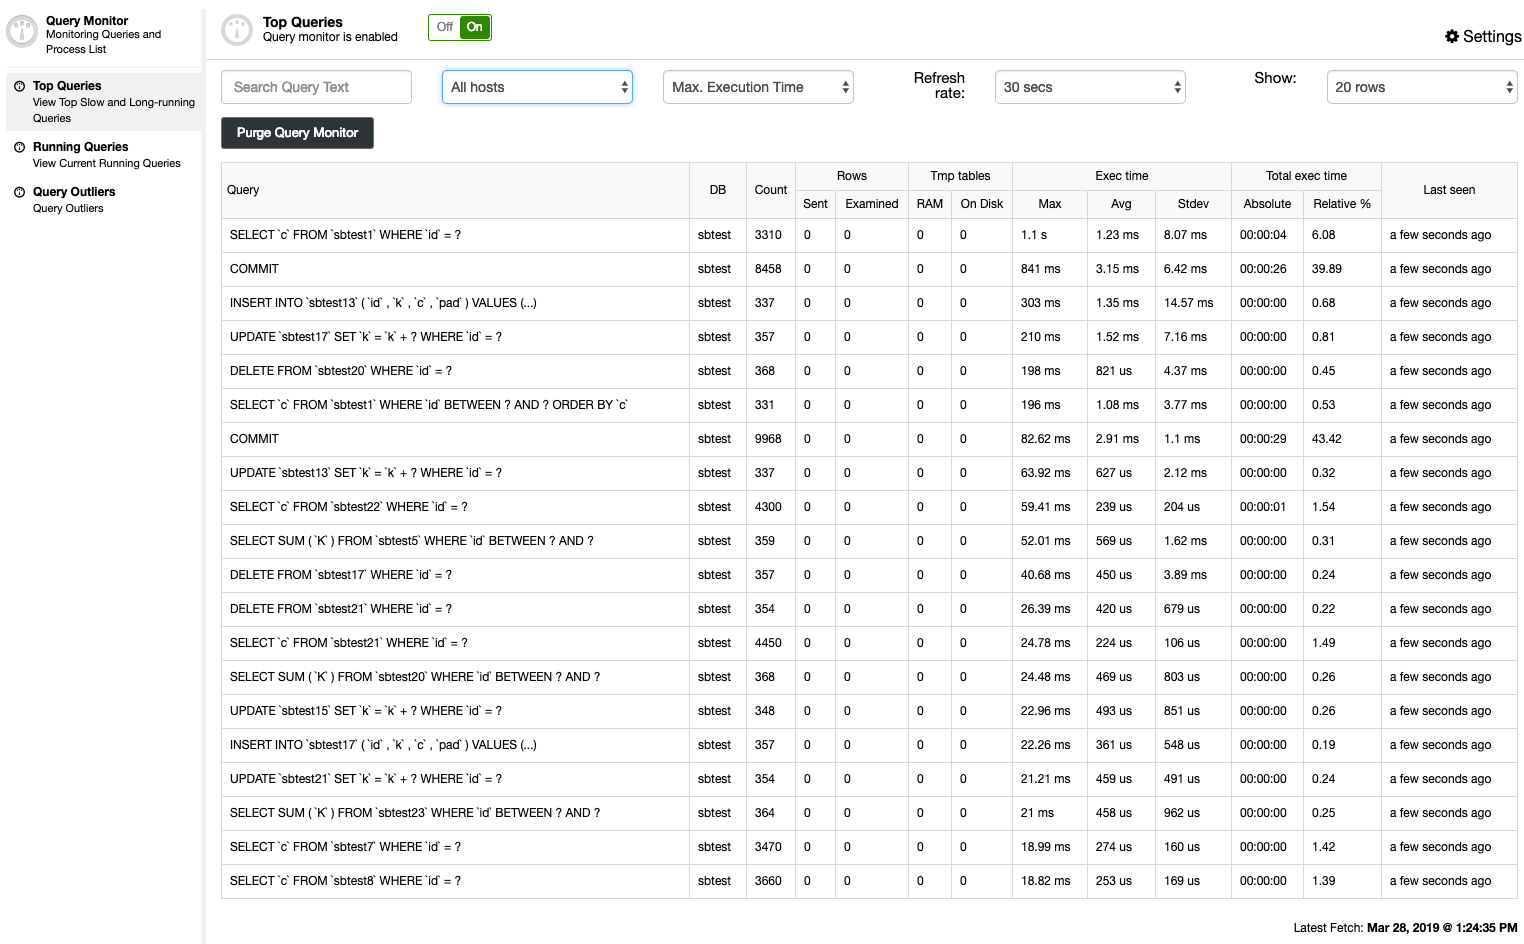
You can easily see a summary of the normalized statement digests, sorted based on a number of criteria:
- Host
- Occurrences
- Total execution time
- Maximum execution time
- Average execution time
- Standard deviation time
We have covered this feature in great detail in this blog post, How to use the ClusterControl Query Monitor for MySQL, MariaDB and Percona Server.
Performance Schema
Performance Schema is a great tool available for monitoring MySQL Server internals and execution details at a lower level. The following tables in Performance Schema can be used to find slow queries:
- events_statements_current
- events_statements_history
- events_statements_history_long
- events_statements_summary_by_digest
- events_statements_summary_by_user_by_event_name
- events_statements_summary_by_host_by_event_name
MySQL 5.7.7 and higher includes the sys schema, a set of objects that helps DBAs and developers interpret data collected by the Performance Schema into more easily understandable form. Sys schema objects can be used for typical tuning and diagnosis use cases.
ClusterControl provides advisors, which are mini-programs that you can write using ClusterControl DSL (similar to JavaScript) to extend the ClusterControl monitoring capabilities custom to your needs. There are a number of scripts included based on Performance Schema that you can use to monitor query performance like I/O wait, lock wait time and so on. For example under Manage -> Developer Studio, go to s9s -> mysql -> p_s -> top_tables_by_iowait.js and click “Compile and Run” button. You should see the output under Messages tab for top 10 tables sorted by I/O wait per server:
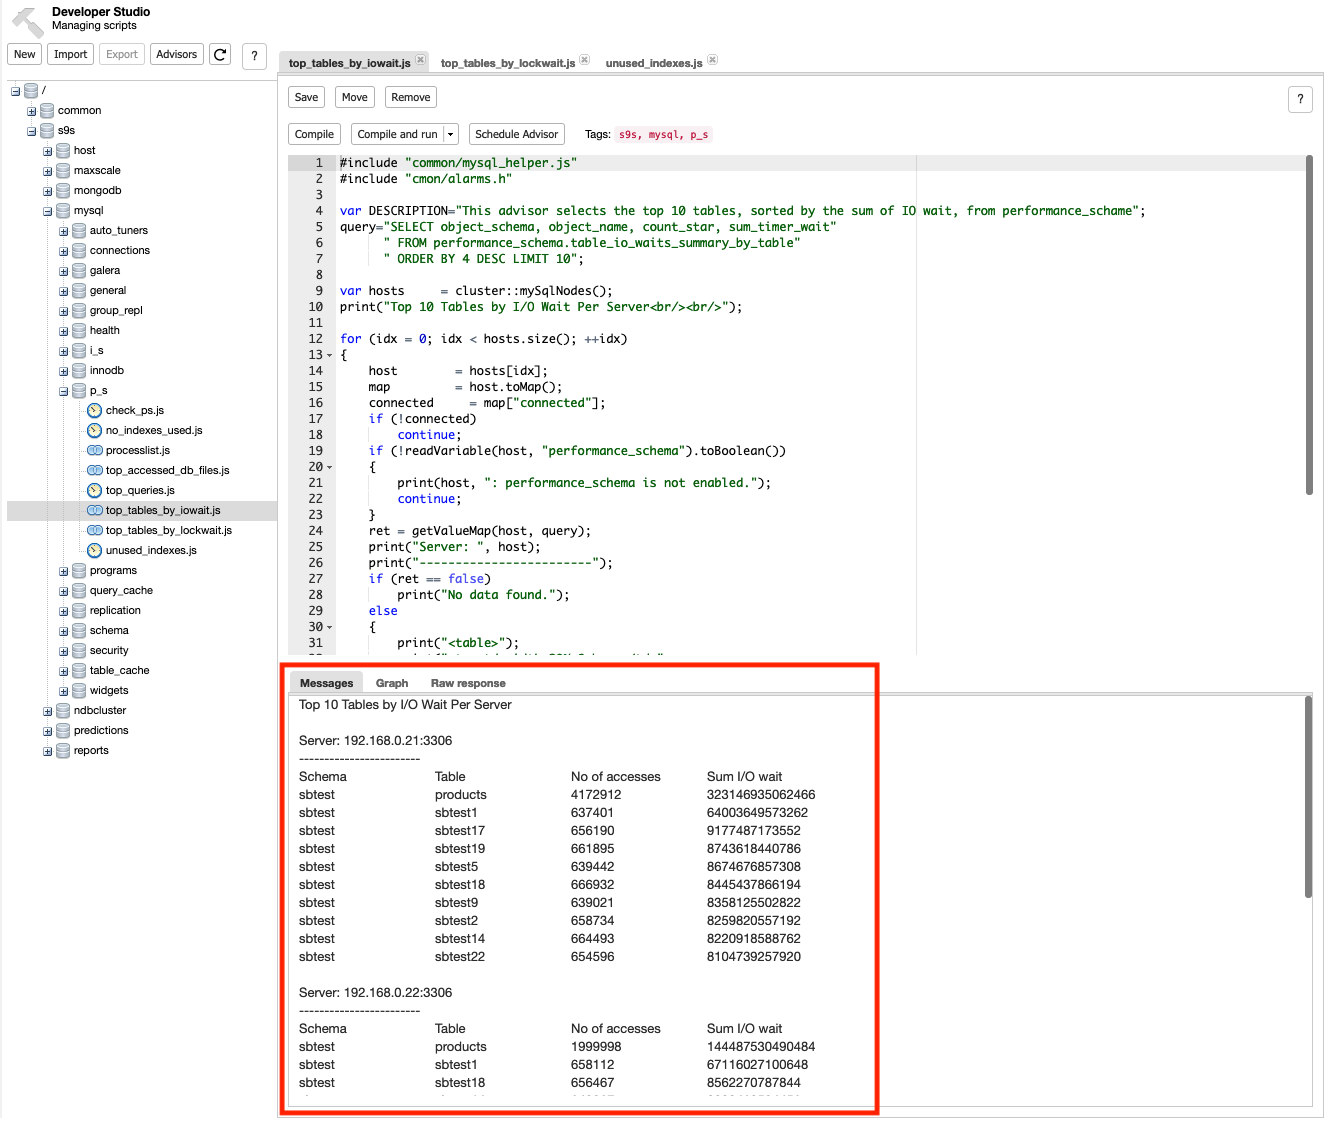
There are a number of scripts that you can use to understand low-level information where and why the slowness happens like top_tables_by_lockwait.js, top_accessed_db_files.js and so on.
ClusterControl – Detecting and alerting upon long running queries
With ClusterControl, you will get additional powerful features that you won’t find in the standard MySQL installation. ClusterControl can be configured to proactively monitor the running processes, and raise an alarm and send notification to the user if long query threshold is exceeded. This can be configured by using the Runtime Configuration under Settings:
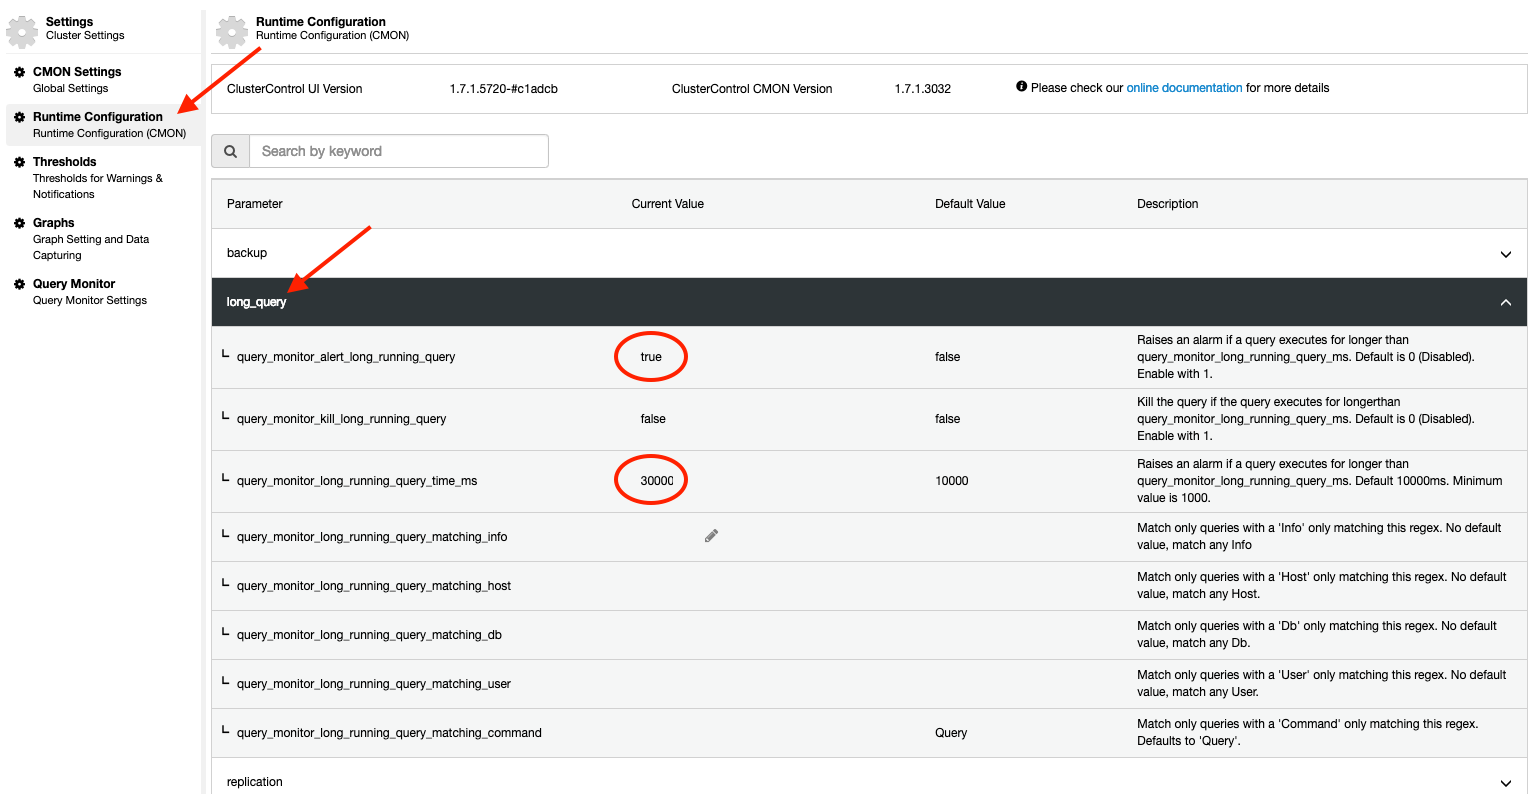
For pre1.7.1, the default value for query_monitor_alert_long_running_query is false. We encourage user to enable this by setting it to 1 (true). To make it persistent, add the following line into /etc/cmon.d/cmon_X.cnf:
query_monitor_alert_long_running_query=1
query_monitor_long_running_query_ms=30000
Any changes made in the Runtime Configuration is applied immediately and no restart required. You will see something like this under the Alarms section if a query exceeds 30000ms (30 seconds) thresholds:
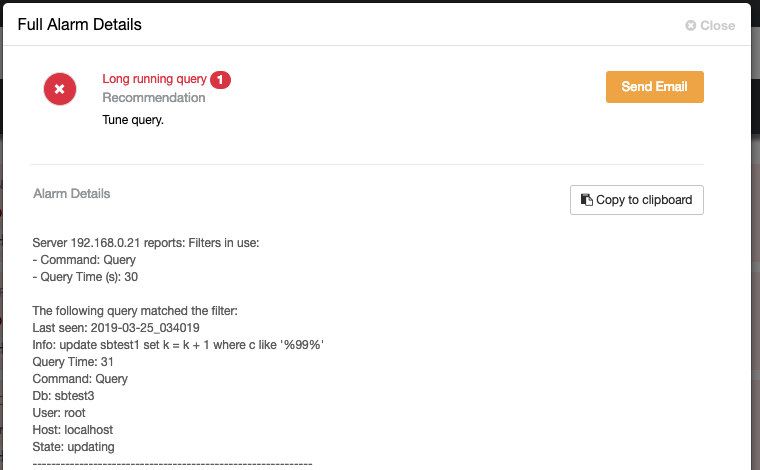
If you configure the mail recipient settings as “Deliver” for the DbComponent plus CRITICAL severity category (as shown in the following screenshot):
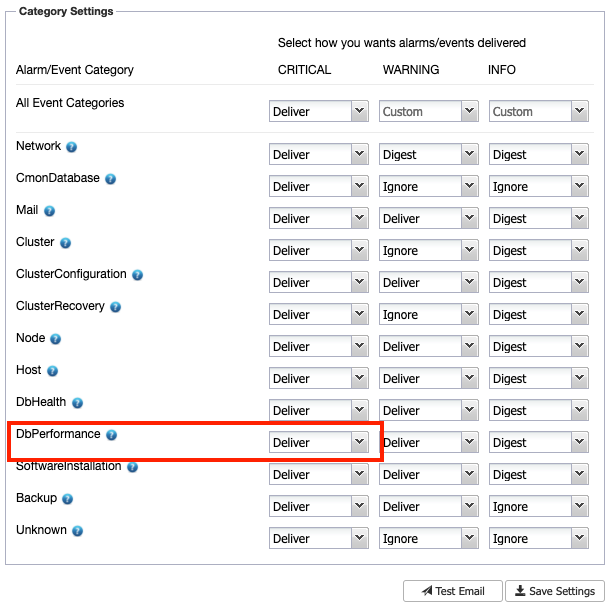
You should get a copy of this alarm in your email. Otherwise, it can be forwarded manually by clicking on the “Send Email” button.
Furthermore, you can filter out any kind of processlist resources that match certain criteria with regular expression (regex). For example, if you want ClusterControl to detect long running query for three MySQL users called ‘sbtest’, ‘myshop’ and ‘db_user1’, the following should do:
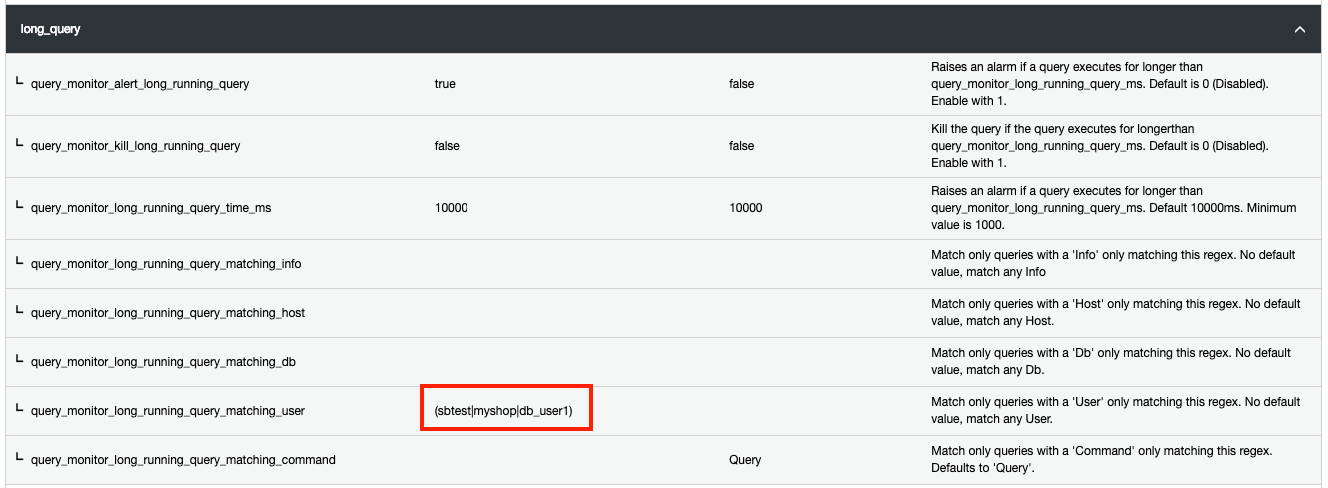
Any changes made in the Runtime Configuration is applied immediately and no restart required.
Additionally, ClusterControl will list out all deadlock transactions together with the InnoDB status when it was happening under Performance -> Transaction Log:
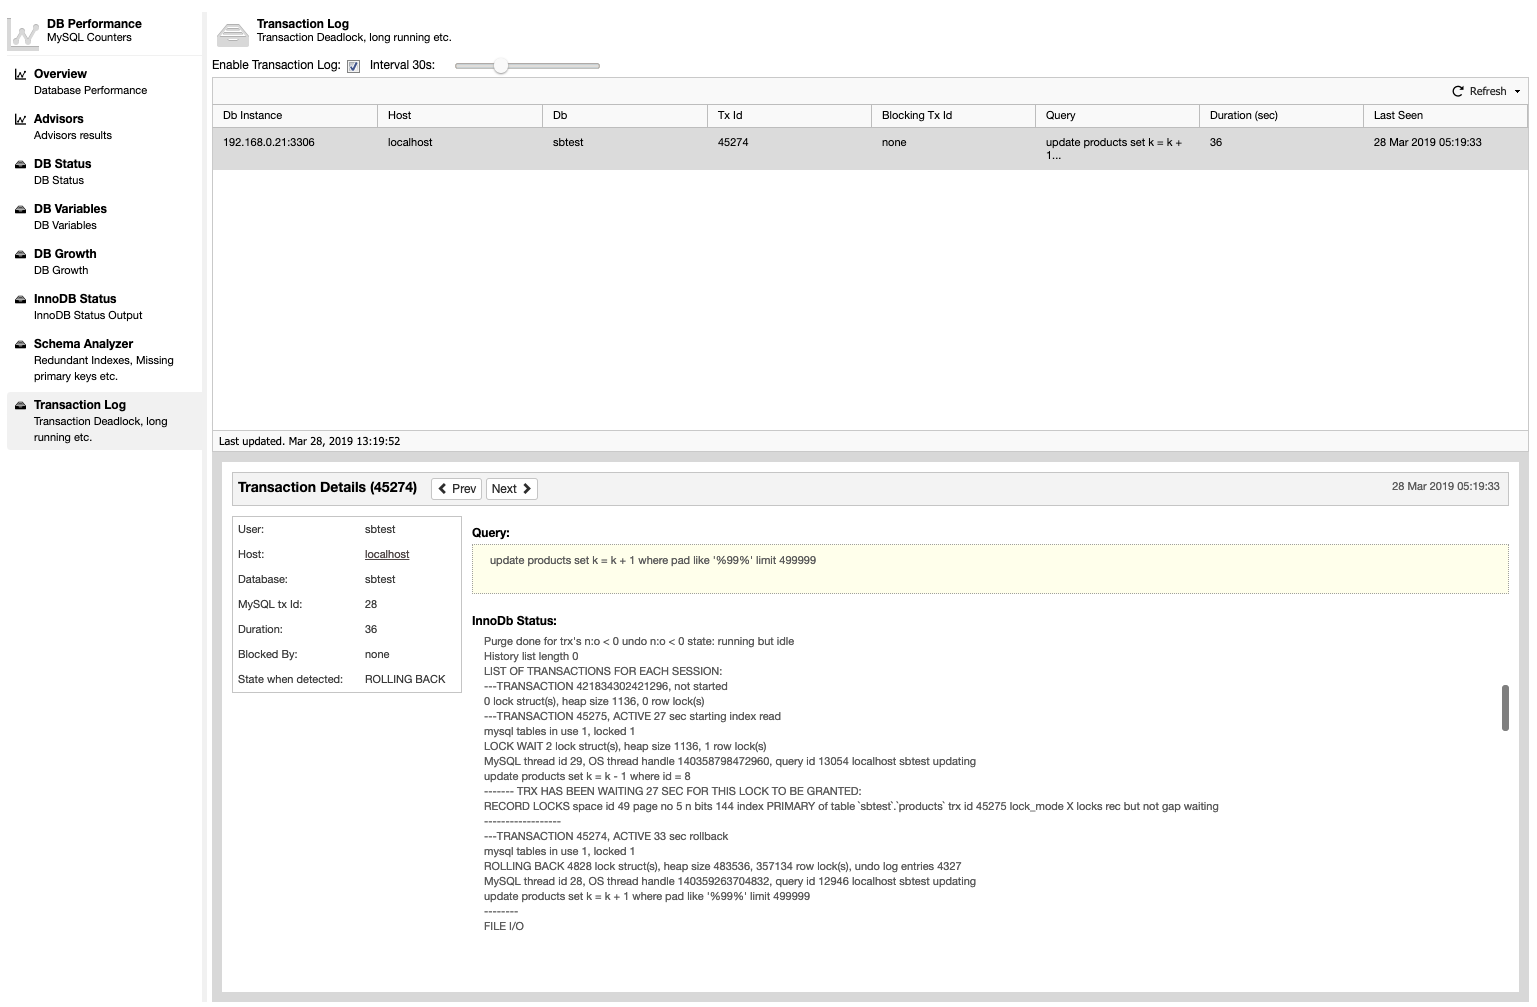
This feature is not enabled by default, due to deadlock detection will affect CPU usage on database nodes. To enable it, simply tick the “Enable Transaction Log” checkbox and specify the interval that you want. To make it persistent, add variable with value in seconds inside /etc/cmon.d/cmon_X.cnf:
db_deadlock_check_interval=30Similarly, if you want to check out the InnoDB status, simply go to Performance -> InnoDB Status, and choose the MySQL server from the dropdown. For example:
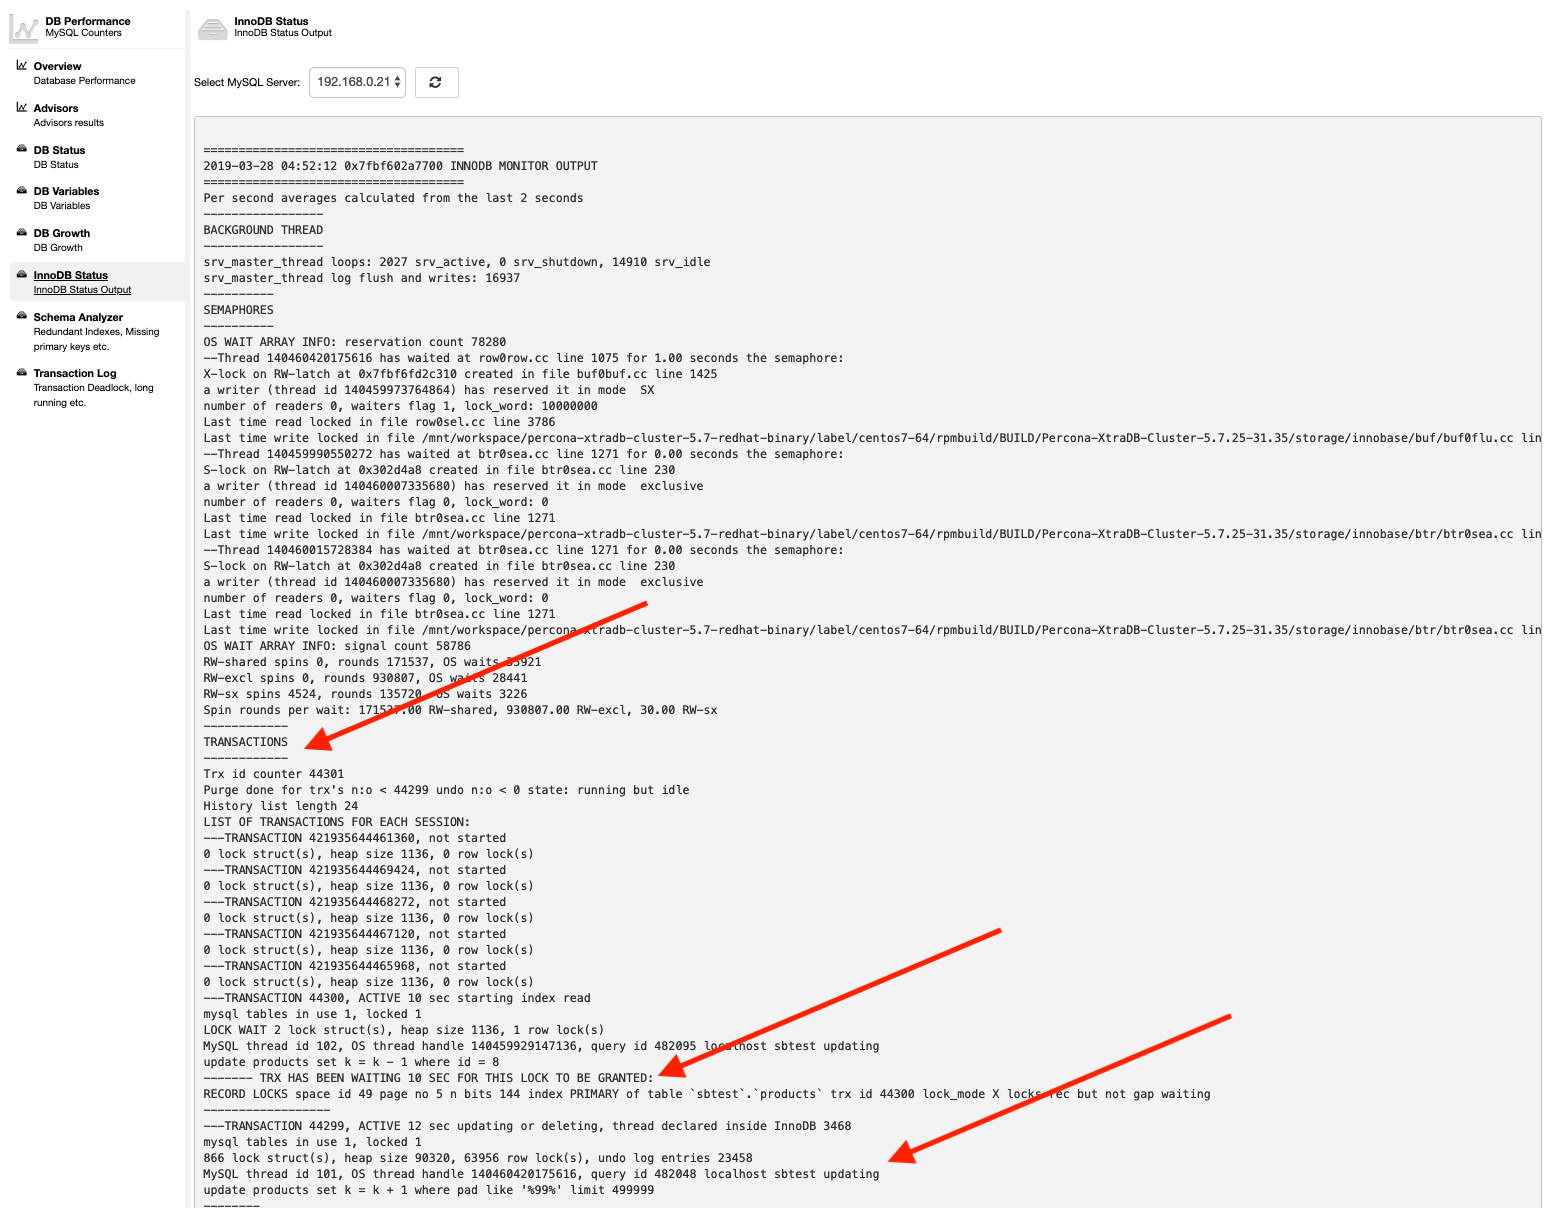
There we go – all the required information is easily retrievable in a couple of clicks.
Summary
Long running transactions could lead to performance degradation, server down, connections maxed out and deadlocks. With ClusterControl, you can detect long running queries directly from the UI, without the need to examine every single MySQL node in the cluster.


