blog
Database Monitoring – Troubleshooting Prometheus With SCUMM Dashboards

It’s almost two months now since we released SCUMM (Severalnines ClusterControl Unified Management and Monitoring). SCUMM utilizes Prometheus as the underlying method to gather time series data from exporters running on database instances and load balancers. This blog will show you how to fix issues when Prometheus exporters aren’t running, or if the graphs aren’t displaying data, or showing “No Data Points”.
What is Prometheus?
Prometheus is an open-source monitoring system with a dimensional data model, flexible query language, efficient time series database and modern alerting approach. It is a monitoring platform that collects metrics from monitored targets by scraping metrics HTTP endpoints on these targets. It provides dimensional data, powerful queries, great visualization, efficient storage, simple operation, precise alerting, many client libraries, and many integrations.
Prometheus in action for SCUMM Dashboards
Prometheus collects metrics data from exporters, with each exporter running on a database or load balancer host. The diagram below shows you how these exporters are linked with the server hosting the Prometheus process. It shows that the ClusterControl node has Prometheus running where it also runs process_exporter and node_exporter.
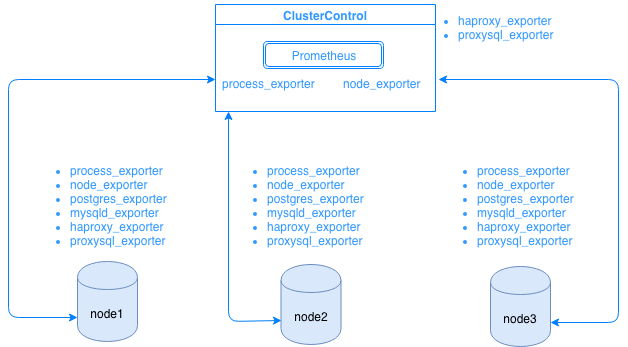
The diagram shows that Prometheus is running on the ClusterControl host and exporters process_exporter and node_exporter are running as well to collect metrics from its own node. Optionally, you can make your ClusterControl host as the target as well in which you can setup HAProxy or ProxySQL.
For the cluster nodes above (node1, node2, and node3), it can have mysqld_exporter or postgres_exporter running which are the agents that scrape data internally in that node and pass it to Prometheus server and store it in its own data storage. You can locate its physical data via /var/lib/prometheus/data within the host where Prometheus is setup.
When you setup Prometheus, for example, in the ClusterControl host, it should have the following ports opened. See below:
[root@testccnode share]# netstat -tnvlp46|egrep 'ex[p]|prometheu[s]'
tcp6       0      0 :::9100                 :::*                    LISTEN      16189/node_exporter
tcp6       0      0 :::9011                 :::*                    LISTEN      19318/process_expor
tcp6       0      0 :::42004                :::*                    LISTEN      16080/proxysql_expo
tcp6       0      0 :::9090                 :::*                    LISTEN      31856/prometheus
Based on the output, I have ProxySQL running as well on the host testccnode in which ClusterControl is hosted.
Common Issues with SCUMM Dashboards using Prometheus
When Dashboards are enabled, the ClusterControl will install and deploy binaries and exporters such as node_exporter, process_exporter, mysqld_exporter, postgres_exporter, and daemon. These are the common sets of packages to the database nodes. When these are setup and installed, the following daemon commands are fired up and run as seen below:
[root@testnode2 bin]# ps axufww|egrep 'exporte[r]'
prometh+  3604  0.0  0.0  10828   364 ?        S    Nov28   0:00 daemon --name=process_exporter --output=/var/log/prometheus/process_exporter.log --env=HOME=/var/lib/prometheus --env=PATH=/usr/local/bin:/usr/bin:/sbin:/bin:/usr/sbin:/usr/bin --chdir=/var/lib/prometheus --pidfile=/var/run/prometheus/process_exporter.pid --user=prometheus -- process_exporter
prometh+  3605  0.2  0.3 256300 14924 ?        Sl   Nov28   4:06  _ process_exporter
prometh+  3838  0.0  0.0  10828   564 ?        S    Nov28   0:00 daemon --name=node_exporter --output=/var/log/prometheus/node_exporter.log --env=HOME=/var/lib/prometheus --env=PATH=/usr/local/bin:/usr/bin:/sbin:/bin:/usr/sbin:/usr/bin --chdir=/var/lib/prometheus --pidfile=/var/run/prometheus/node_exporter.pid --user=prometheus -- node_exporter
prometh+  3839  0.0  0.4  44636 15568 ?        Sl   Nov28   1:08  _ node_exporter
prometh+  4038  0.0  0.0  10828   568 ?        S    Nov28   0:00 daemon --name=mysqld_exporter --output=/var/log/prometheus/mysqld_exporter.log --env=HOME=/var/lib/prometheus --env=PATH=/usr/local/bin:/usr/bin:/sbin:/bin:/usr/sbin:/usr/bin --chdir=/var/lib/prometheus --pidfile=/var/run/prometheus/mysqld_exporter.pid --user=prometheus -- mysqld_exporter --collect.perf_schema.eventswaits --collect.perf_schema.file_events --collect.perf_schema.file_instances --collect.perf_schema.indexiowaits --collect.perf_schema.tableiowaits --collect.perf_schema.tablelocks --collect.info_schema.tablestats --collect.info_schema.processlist --collect.binlog_size --collect.global_status --collect.global_variables --collect.info_schema.innodb_metrics --collect.slave_status
prometh+  4039  0.1  0.2  17368 11544 ?        Sl   Nov28   1:47  _ mysqld_exporter --collect.perf_schema.eventswaits --collect.perf_schema.file_events --collect.perf_schema.file_instances --collect.perf_schema.indexiowaits --collect.perf_schema.tableiowaits --collect.perf_schema.tablelocks --collect.info_schema.tablestats --collect.info_schema.processlist --collect.binlog_size --collect.global_status --collect.global_variables --collect.info_schema.innodb_metrics --collect.slave_status
For a PostgreSQL node,
[root@testnode14 vagrant]# ps axufww|egrep 'ex[p]'
postgres  1901  0.0  0.4 1169024 8904 ?        Ss   18:00   0:04  _ postgres: postgres_exporter postgres ::1(51118) idle
prometh+  1516  0.0  0.0  10828   360 ?        S    18:00   0:00 daemon --name=process_exporter --output=/var/log/prometheus/process_exporter.log --env=HOME=/var/lib/prometheus --env=PATH=/usr/local/bin:/usr/bin:/sbin:/bin:/usr/sbin:/usr/bin --chdir=/var/lib/prometheus --pidfile=/var/run/prometheus/process_exporter.pid --user=prometheus -- process_exporter
prometh+  1517  0.2  0.7 117032 14636 ?        Sl   18:00   0:35  _ process_exporter
prometh+  1700  0.0  0.0  10828   572 ?        S    18:00   0:00 daemon --name=node_exporter --output=/var/log/prometheus/node_exporter.log --env=HOME=/var/lib/prometheus --env=PATH=/usr/local/bin:/usr/bin:/sbin:/bin:/usr/sbin:/usr/bin --chdir=/var/lib/prometheus --pidfile=/var/run/prometheus/node_exporter.pid --user=prometheus -- node_exporter
prometh+  1701  0.0  0.7  44380 14932 ?        Sl   18:00   0:10  _ node_exporter
prometh+  1897  0.0  0.0  10828   568 ?        S    18:00   0:00 daemon --name=postgres_exporter --output=/var/log/prometheus/postgres_exporter.log --env=HOME=/var/lib/prometheus --env=PATH=/usr/local/bin:/usr/bin:/sbin:/bin:/usr/sbin:/usr/bin --env=DATA_SOURCE_NAME=postgresql://postgres_exporter:password@localhost:5432/postgres?sslmode=disable --chdir=/var/lib/prometheus --pidfile=/var/run/prometheus/postgres_exporter.pid --user=prometheus -- postgres_exporter
prometh+  1898  0.0  0.5  16548 11204 ?        Sl   18:00   0:06  _ postgres_exporter
It has the same exporters as for a MySQL node, but differs only on the postgres_exporter since this is a PostgreSQL database node.
However, when a node suffers from a power interruption, a system crash, or a system reboot, these exporters will stop running. Prometheus will report that an exporter is down. ClusterControl samples Prometheus itself, and asks for the exporter statuses. So it acts upon this information, and will restart the exporter if it is down.
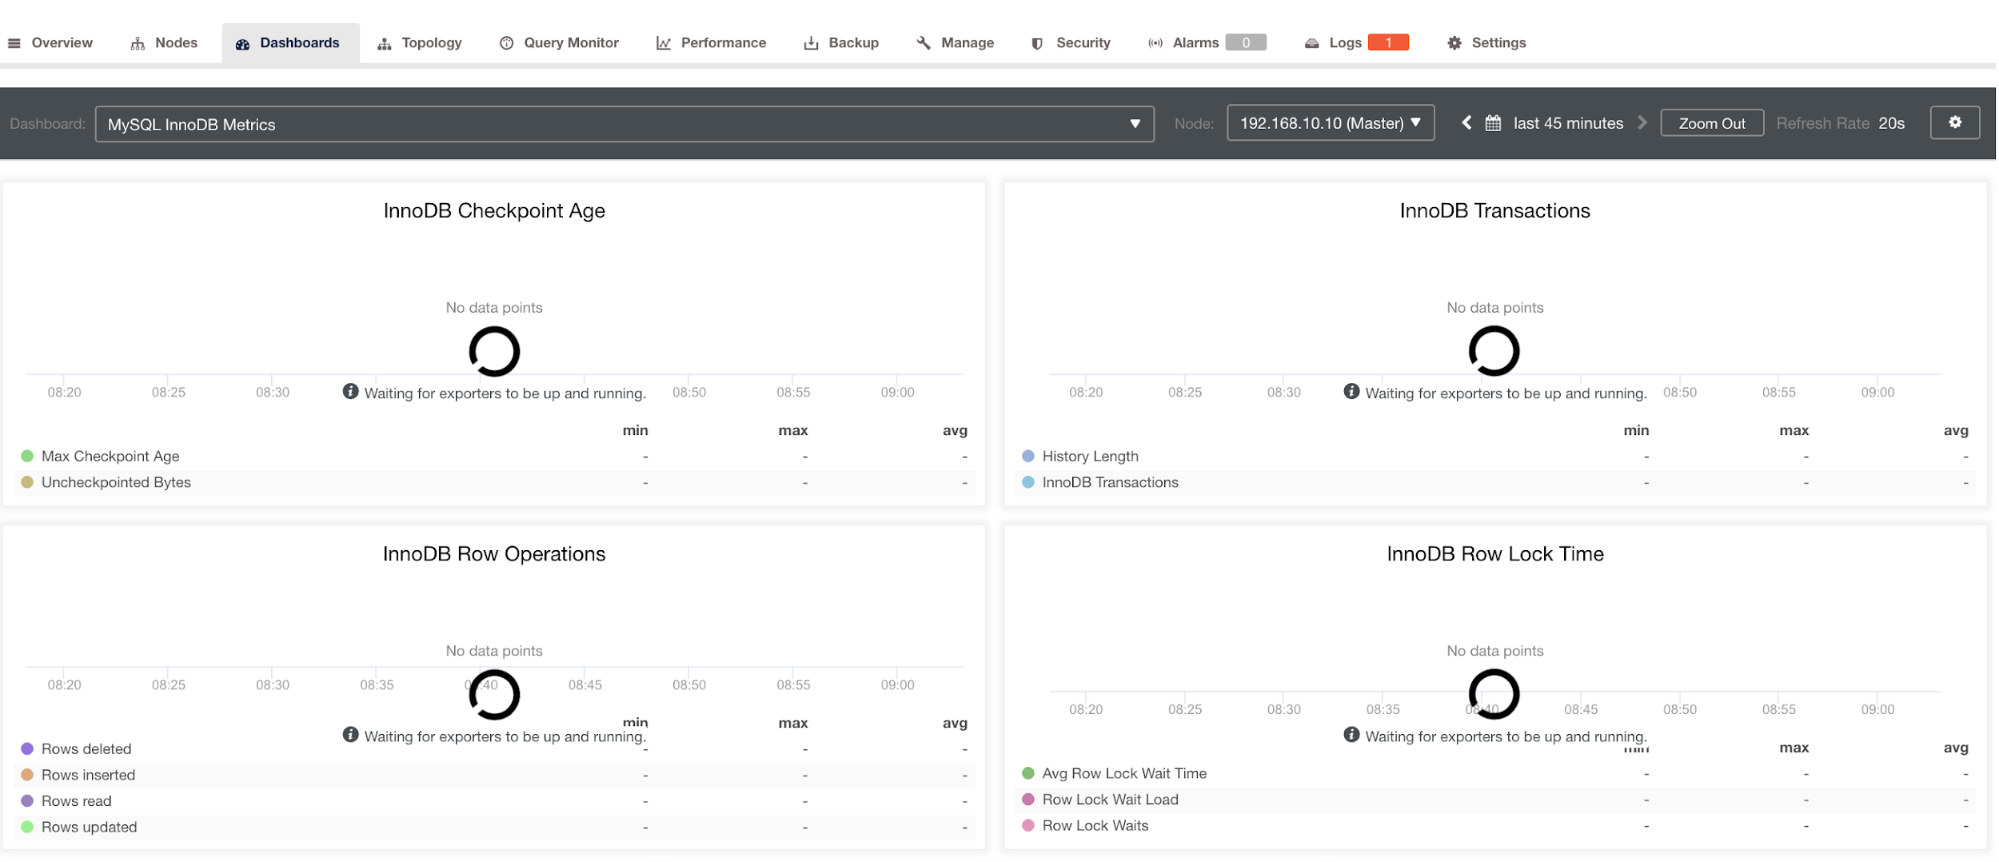
However, note that for exporters that have not been installed via ClusterControl, they are not going to be restarted after a crash. The reason is that they are not monitored by systemd or a daemon that acts as a safety script that would restart a process upon crash or an abnormal shutdown. Hence, the screenshot below will show how does it looks like when the exporters aren’t running. See below:
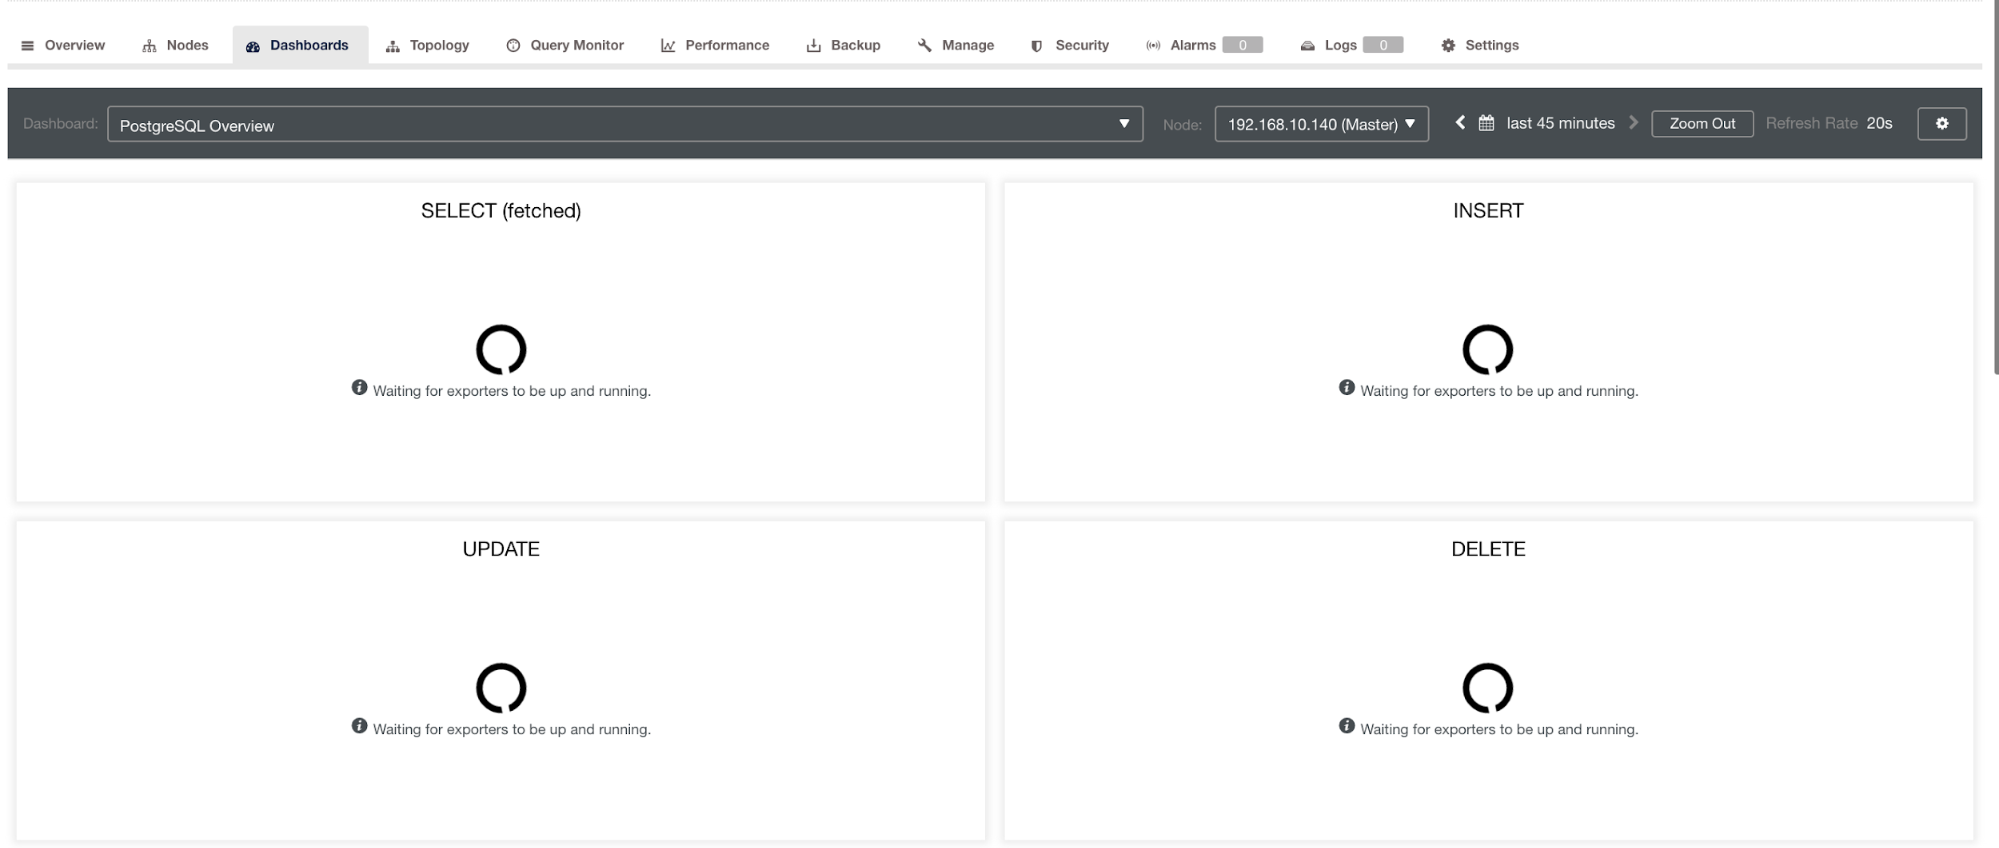
and in PostgreSQL Dashboard, will have the same loading icon with “No data points” label in the graph. See below:
Hence, these can be troubleshooted through various techniques that will follow in the following sections.
Troubleshooting Issues With Prometheus
Prometheus agents, known as the exporters, are using the following ports: 9100 (node_exporter), 9011 (process_exporter), 9187 (postgres_exporter), 9104 (mysqld_exporter), 42004 (proxysql_exporter), and the very own 9090 which is owned by a prometheus process. These are the ports for these agents that are used by ClusterControl.
To start troubleshooting the SCUMM Dashboard issues, you can start by checking the ports open from the database node. You can follow the lists below:
-
Check if the ports are open
e.g.
## Use netstat and check the ports
[root@testnode15 vagrant]# netstat -tnvlp46|egrep 'ex[p]'
tcp6       0      0 :::9100                 :::*                    LISTEN      5036/node_exporter
tcp6       0      0 :::9011                 :::*                    LISTEN      4852/process_export
tcp6       0      0 :::9187                 :::*                    LISTEN      5230/postgres_expor
There can be a possibility that the ports aren’t open because of a firewall (such as iptables or firewalld) blocking it from opening the port or the process daemon itself is not running.
-
Use curl from the host monitor and verify if the port is reachable and open.
e.g.
## Using curl and grep mysql list of available metric names used in PromQL.
[root@testccnode prometheus]# curl -sv mariadb_g01:9104/metrics|grep 'mysql'|head -25
* About to connect() to mariadb_g01 port 9104 (#0)
*   Trying 192.168.10.10...
* Connected to mariadb_g01 (192.168.10.10) port 9104 (#0)
> GET /metrics HTTP/1.1
> User-Agent: curl/7.29.0
> Host: mariadb_g01:9104
> Accept: */*
>
< HTTP/1.1 200 OK
< Content-Length: 213633
< Content-Type: text/plain; version=0.0.4; charset=utf-8
< Date: Sat, 01 Dec 2018 04:23:21 GMT
<
{ [data not shown]
# HELP mysql_binlog_file_number The last binlog file number.
# TYPE mysql_binlog_file_number gauge
mysql_binlog_file_number 114
# HELP mysql_binlog_files Number of registered binlog files.
# TYPE mysql_binlog_files gauge
mysql_binlog_files 26
# HELP mysql_binlog_size_bytes Combined size of all registered binlog files.
# TYPE mysql_binlog_size_bytes gauge
mysql_binlog_size_bytes 8.233181e+06
# HELP mysql_exporter_collector_duration_seconds Collector time duration.
# TYPE mysql_exporter_collector_duration_seconds gauge
mysql_exporter_collector_duration_seconds{collector="collect.binlog_size"} 0.008825006
mysql_exporter_collector_duration_seconds{collector="collect.global_status"} 0.006489491
mysql_exporter_collector_duration_seconds{collector="collect.global_variables"} 0.00324821
mysql_exporter_collector_duration_seconds{collector="collect.info_schema.innodb_metrics"} 0.008209824
mysql_exporter_collector_duration_seconds{collector="collect.info_schema.processlist"} 0.007524068
mysql_exporter_collector_duration_seconds{collector="collect.info_schema.tables"} 0.010236411
mysql_exporter_collector_duration_seconds{collector="collect.info_schema.tablestats"} 0.000610684
mysql_exporter_collector_duration_seconds{collector="collect.perf_schema.eventswaits"} 0.009132491
mysql_exporter_collector_duration_seconds{collector="collect.perf_schema.file_events"} 0.009235416
mysql_exporter_collector_duration_seconds{collector="collect.perf_schema.file_instances"} 0.009451361
mysql_exporter_collector_duration_seconds{collector="collect.perf_schema.indexiowaits"} 0.009568397
mysql_exporter_collector_duration_seconds{collector="collect.perf_schema.tableiowaits"} 0.008418406
mysql_exporter_collector_duration_seconds{collector="collect.perf_schema.tablelocks"} 0.008656682
mysql_exporter_collector_duration_seconds{collector="collect.slave_status"} 0.009924652
* Failed writing body (96 != 14480)
* Closing connection 0
Ideally, I practically found this approach feasible for me because I can grep and debug from the terminal easily.
-
Why not use the Web UI?
-
Prometheus exposes port 9090 which is used by ClusterControl in our SCUMM Dashboards. Aside from this, the ports that the exporters are exposing can also be used to troubleshoot and determine the available metric names using PromQL. In the server where the Prometheus is running, you can visit http://
:9090/targets . The screenshot below shows it in action: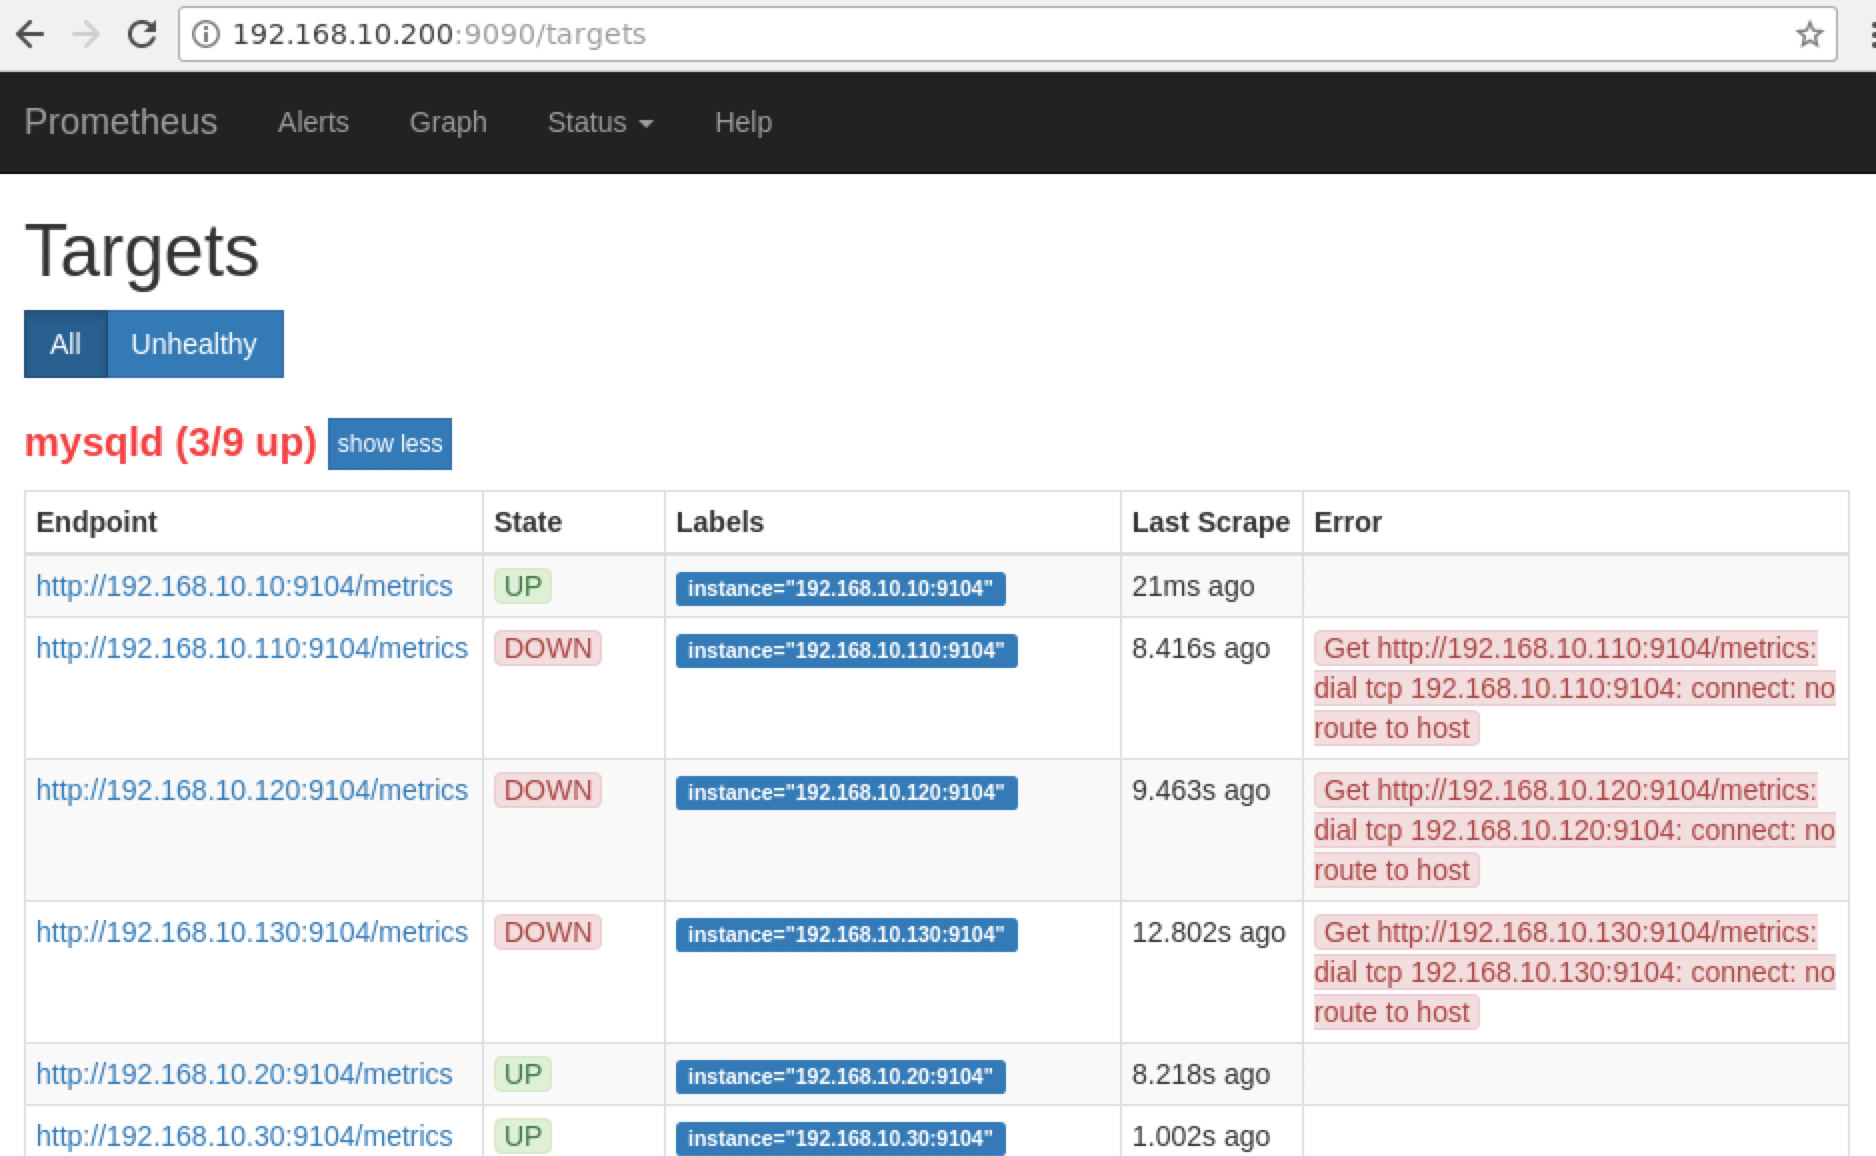
and clicking the “Endpoints”, you can verify the metrics as well just as the screenshot below:
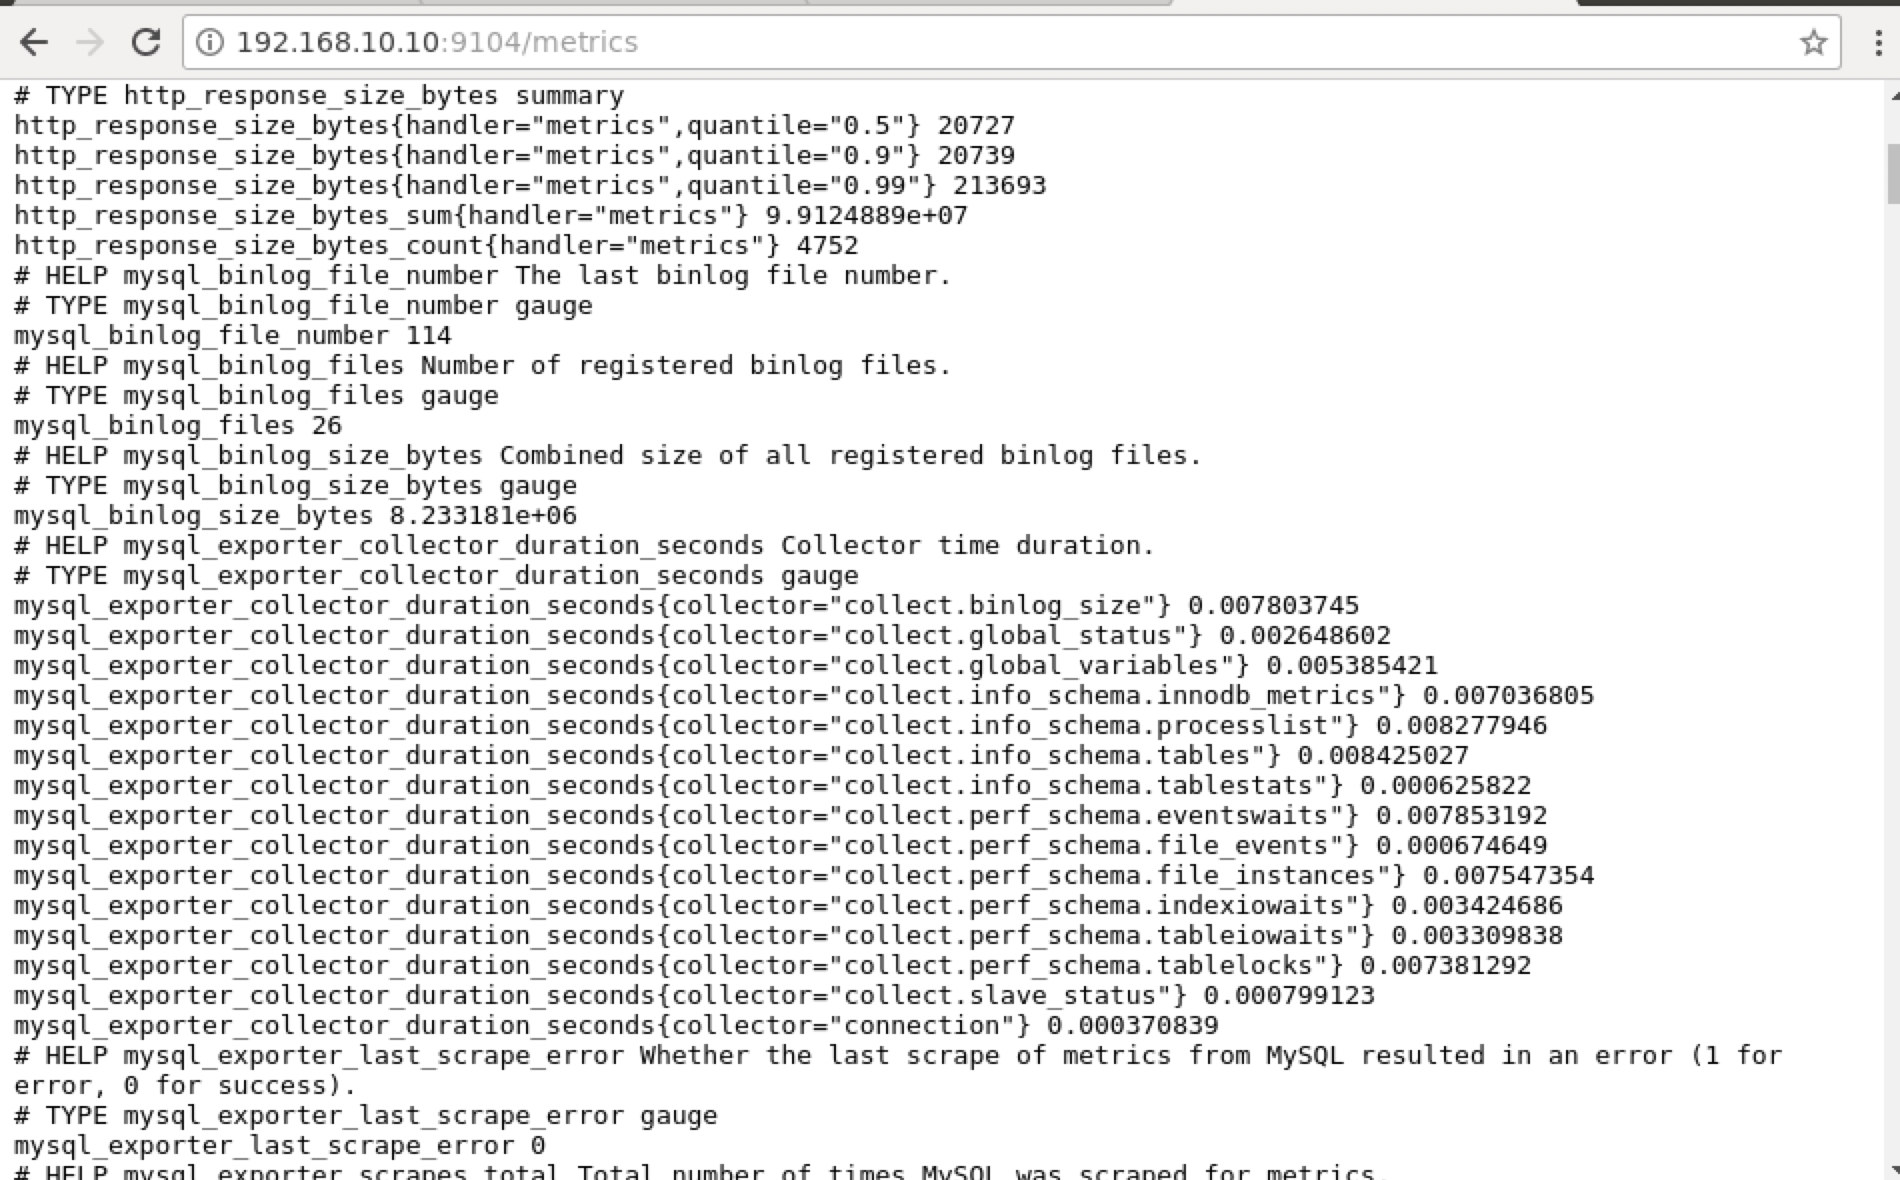
Instead of using the IP address, you can also check this locally via localhost on that specific node such as visiting http://localhost:9104/metrics either in a Web UI interface or using cURL.
Now, if we go back to the “Targets” page, you can see the list of nodes where there can be a problem with the port. The reasons that could cause this are listed below:
- Server is down
- Network is unreachable or ports not opened due to a firewall running
- The daemon is not running where the
_exporter is not running. For example, mysqld_exporter is not running.
-
When these exporters are running, you can fire up and run the process using daemon command. You can refer to the available running processes that I had used in the example above, or mentioned in the previous section of this blog.
What About Those “No Data Points” Graphs In My Dashboard?
SCUMM Dashboards come up with a general use case scenario which is commonly used by MySQL. However, there are some variables when invoking such metric might not be available into a particular MySQL version or a MySQL vendor, such as MariaDB or Percona Server.
Let me show an example below:
This graph was taken on a database server running on a version 10.3.9-MariaDB-log MariaDB Server with wsrep_patch_version of wsrep_25.23 instance. Now the question is, why isn’t there any data points loading? Well, as I queried the node for a checkpoint age status, it reveals that it’s empty or no variable found. See below:
MariaDB [(none)]> show global status like 'Innodb_checkpoint_max_age';
Empty set (0.000 sec)
I have no idea why MariaDB does not have this variable (please let us know in the comments section of this blog if you have the answer). This is in contrast to a Percona XtraDB Cluster Server where the variable Innodb_checkpoint_max_age does exist. See below:
mysql> show global status like 'Innodb_checkpoint_max_age';
+---------------------------+-----------+
| Variable_name             | Value     |
+---------------------------+-----------+
| Innodb_checkpoint_max_age | 865244898 |
+---------------------------+-----------+
1 row in set (0.00 sec)
What does this means though is that, there can be graphs that do not have data points gathered because it has no data being harvested on that particular metric when a Prometheus query was executed.
However, a graph that does not have data points does not mean that your current version of MySQL or its variant does not support it. For example, there are certain graphs that requires certain variables that needs to be setup properly or enabled.
The following section will show what these graphs are.
Index Condition Pushdown (ICP) Graph

This graph has been mentioned in my previous blog. It relies on a MySQL global variable named innodb_monitor_enable. This variable is dynamic so you can set this without a hard restart of your MySQL database. It also requires innodb_monitor_enable = module_icp or you can set this global variable to innodb_monitor_enable = all. Typically, to avoid such cases and confusions on why such graph does not show any data points, you might have to use all but with care. There can be certain overhead when this variable is turned on and set to all.
MySQL Performance Schema Graphs

So why these graphs are showing “No data points”? When you create a cluster using ClusterControl using our templates, by default it will define performance_schema variables. For example, these variables below are set:
performance_schema = ON
performance-schema-max-mutex-classes = 0
performance-schema-max-mutex-instances = 0
However, if performance_schema = OFF, then that’s the reason why the related graphs would display “No data points”.
But I have performance_schema enabled, why other graphs are still an issue?
Well, there are still graphs that requires multiple variables need to be set. This has already been covered in our previous blog. Thus, you need to set innodb_monitor_enable = all and userstat=1. The result would look like this:
However, I notice that in the version of MariaDB 10.3 (particularly 10.3.11), setting performance_schema=ON will populate the metrics needed for the MySQL Performance Schema Dashboard. This is great advantage because it does not have to set innodb_monitor_enable=ON which would add extra overhead on the database server.
Advanced Troubleshooting
Is there any advance troubleshooting I can recommend? Yes, there is! However, you do need some JavaScript skills, at least. Since SCUMM Dashboards using Prometheus relies on highcharts, the way the metrics that are being used for PromQL requests can be determined through app.js script which is shown below:
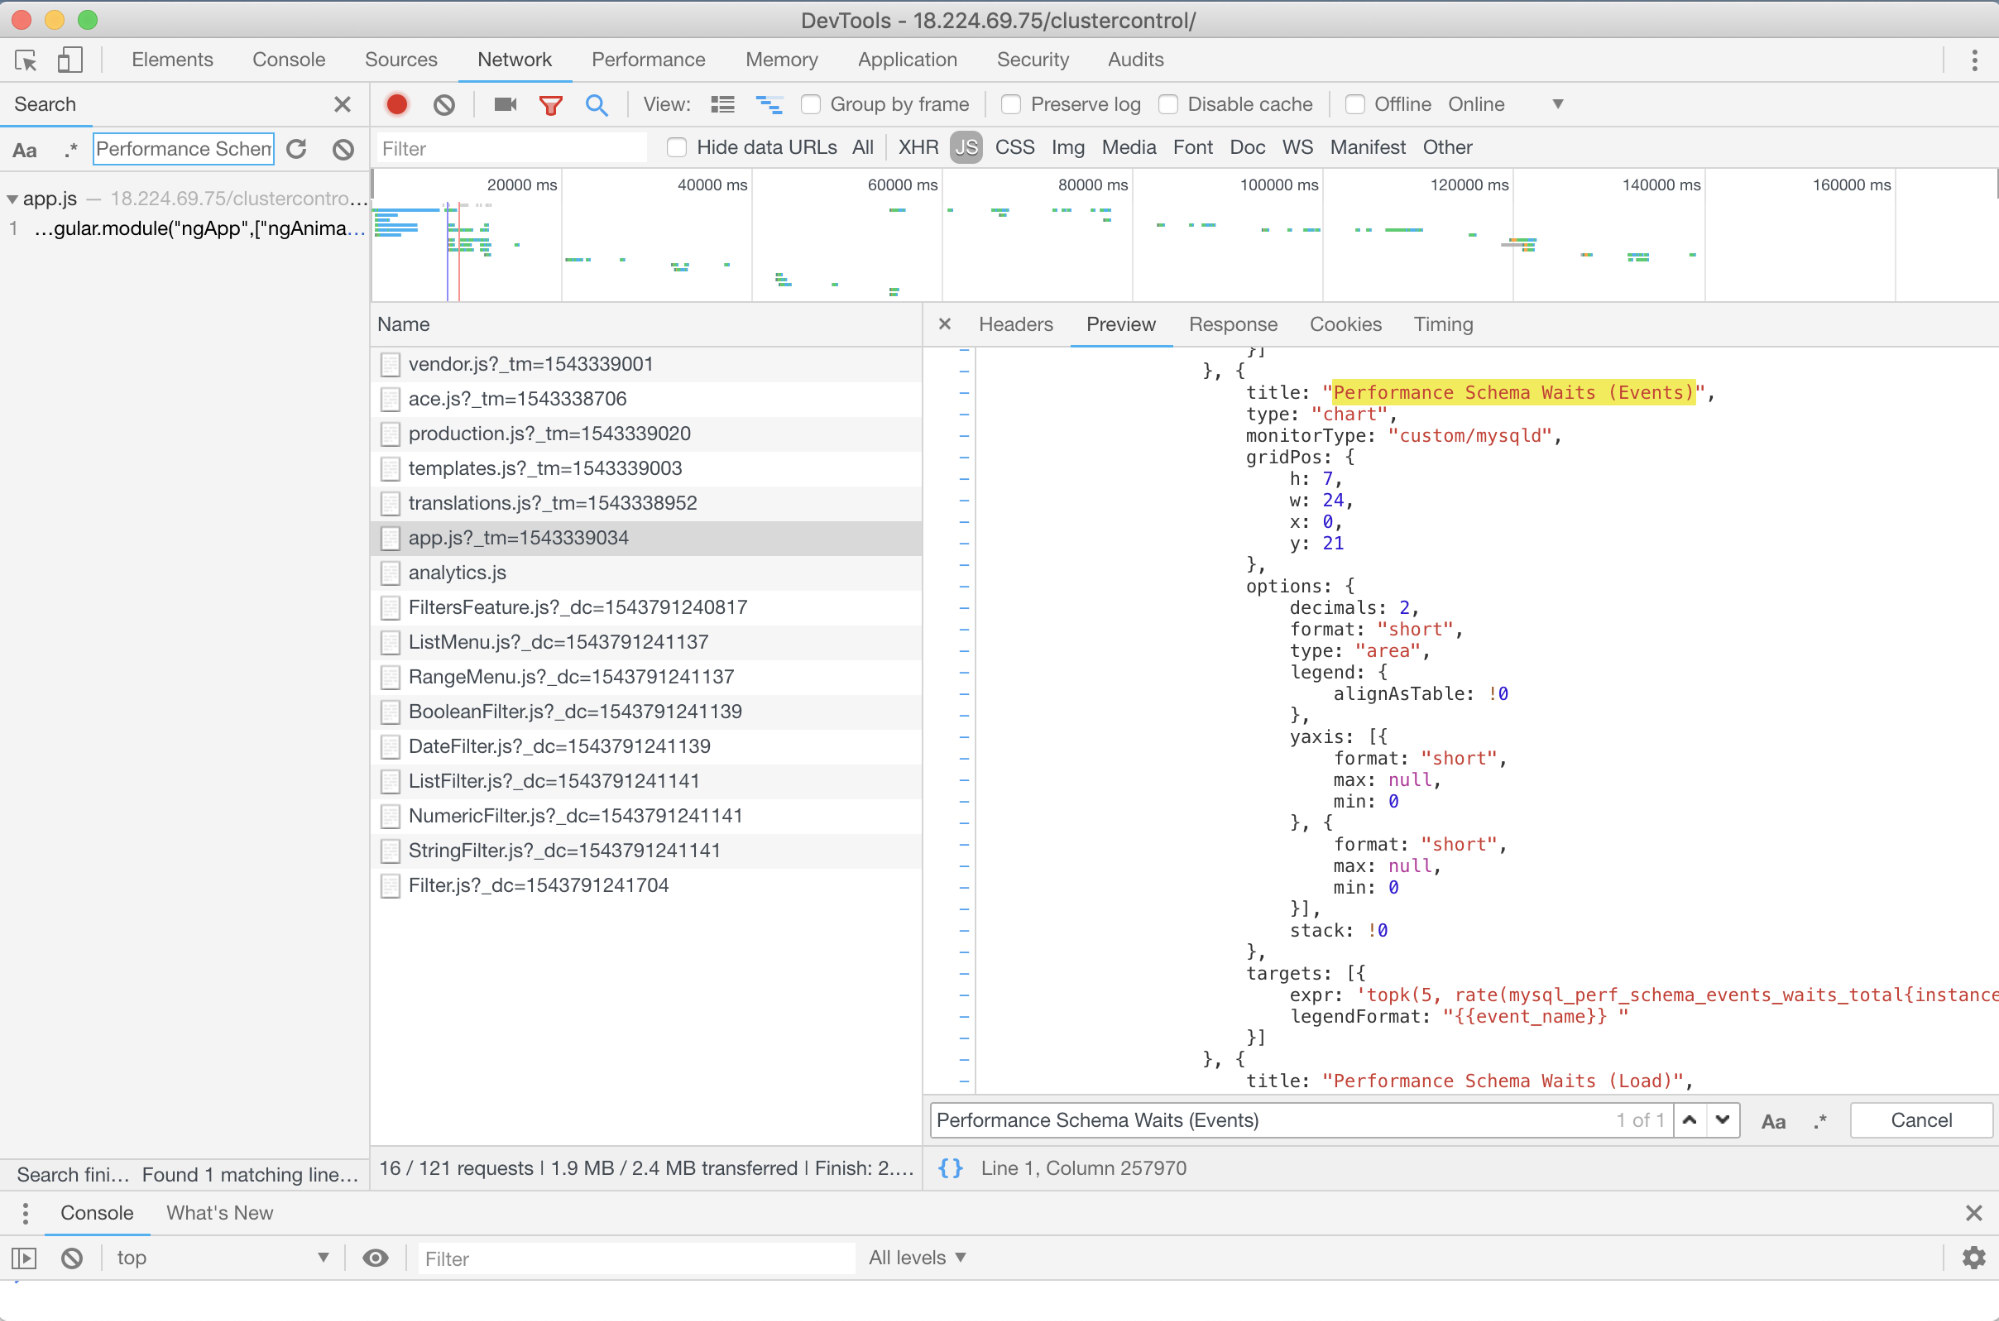
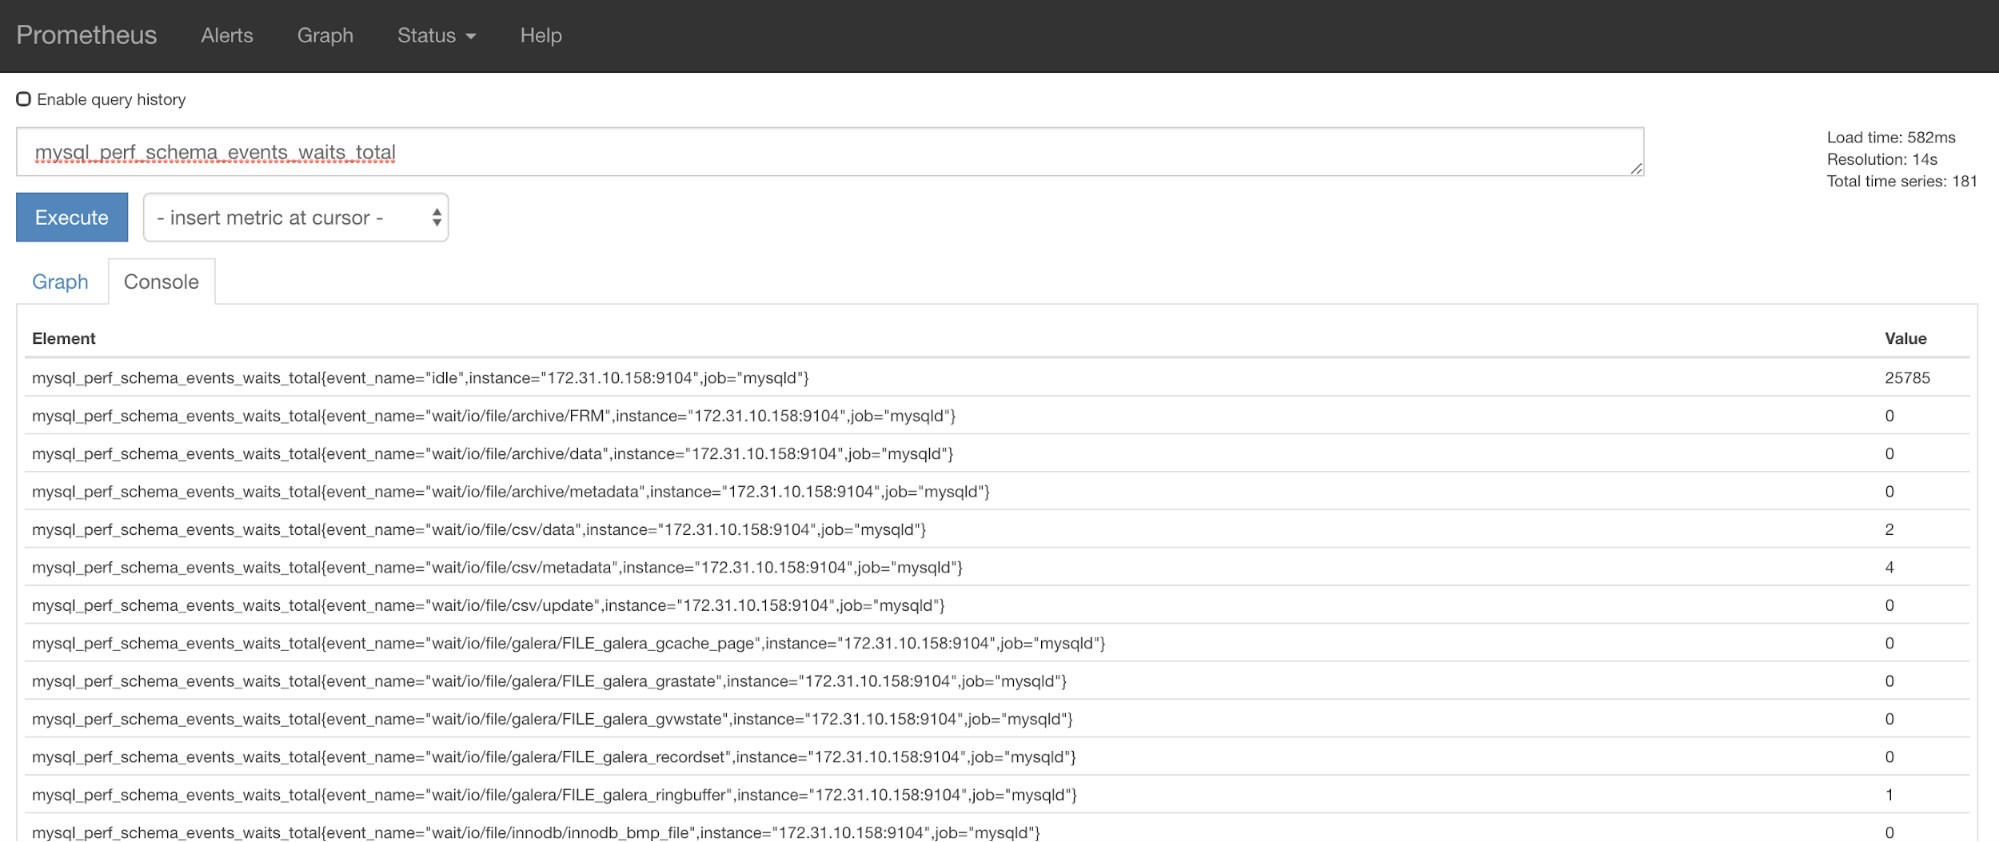
So in this case, I am using Google Chrome’s DevTools and tried to look for Performance Schema Waits (Events). How this can help? Well, if you look on the targets, you’ll see:
targets: [{
expr: 'topk(5, rate(mysql_perf_schema_events_waits_total{instance="$instance"}[$interval])>0) or topk(5, irate(mysql_perf_schema_events_waits_total{instance="$instance"}[5m])>0)',
legendFormat: "{{event_name}} "
}]
Now, you can use the metrics requested which is mysql_perf_schema_events_waits_total. You can check that, for example, by going through http://
ClusterControl Auto-Recovery to the rescue!
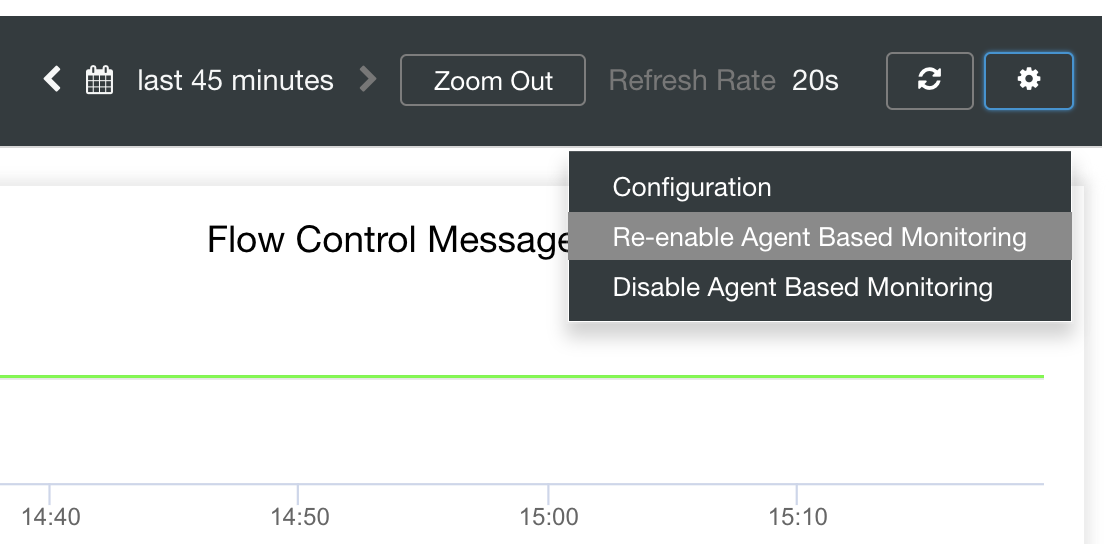
Lastly, the main question is, is there an easy way to restart failed exporters? Yes! We mentioned earlier that ClusterControl watches the state of the exports and restarts them if required. In case you notice that SCUMM Dashboards do not load graphs normally, ensure that you have Auto Recovery enabled. See the image below:

When this is enabled, this will ensure that the
It is also possible to re-install or re-configure the exporters.
Conclusion
In this blog, we saw how ClusterControl uses Prometheus to offer SCUMM Dashboards. It provides a powerful set of features, from high resolution monitoring data and rich graphs. You have learned that with PromQL, you can determine and troubleshoot our SCUMM Dashboards which allows you to aggregate time series data in real time. You can as well generate graphs or view through Console for all the metrics that have been collected.
You also learned how to debug our SCUMM Dashboards especially when no data points are collected.
If you have questions, please add in your comments or let us know through our Community Forums.


