blog
High Availability Log Processing with Graylog, MongoDB and ElasticSearch

Graylog is an open-source log management tool. Similar to Splunk and LogStash, Graylog helps centralize and aggregate all your log files for full visibility. It also provides a query language to search through log data. For large volumes of log data in a big production setup, you might want to deploy a Graylog Cluster.
Graylog Cluster consists of several components:
- Graylog server – Log processor
- Graylog web UI – Graylog web user interface
- MongoDB – store configuration and the dead letter messages
- ElasticSearch – store messages (if you lose your ElasticSearch data, the messages are gone)
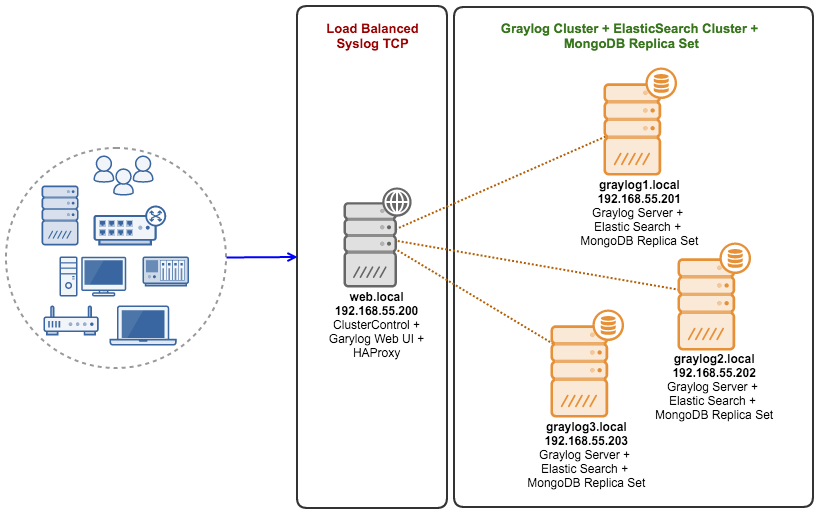
In this blog post, we are going to deploy a Graylog cluster, with a MongoDB Replica Set deployed using ClusterControl. We will configure the Graylog cluster to be able to collect syslog from several devices through a load balanced syslog TCP running on HAProxy. This is to allow high availability single endpoint access with auto failover in case if any of the Graylog servers goes down.
Our Graylog cluster consists of 4 nodes:
- web.local – ClusterControl server + Graylog web UI + HAProxy
- graylog1.local – Graylog server + MongoDB Replica Set + ElasticSearch
- graylog2.local – Graylog server + MongoDB Replica Set + ElasticSearch
- graylog3.local – Graylog server + MongoDB Replica Set + ElasticSearch
The architecture diagram looks like this:
Prerequisites
All hosts are running on CentOS 7.1 64 bit with SElinux and iptables disabled. The following is the host definition inside /etc/hosts:
192.168.55.200     web.local clustercontrol.local clustercontrol web
192.168.55.201     graylog1.local graylog1
192.168.55.202     graylog2.local graylog2
192.168.55.203      graylog3.local graylog3
Ensure NTP is installed and enabled:
$ yum install ntp -y
$ systemctl enable ntpd
$ systemctl start ntpd
Deploying MongoDB Replica Set
The following steps should be performed on the ClusterControl server.
- Install ClusterControl on web.local:
$ wget https://severalnines.com/downloads/cmon/install-cc $ chmod 755 install-cc $ ./install-cc - Follow the installation wizard up until it finishes. Open ClusterControl UI at http://web.local/clustercontrol and create a default admin user.
- Setup passwordless SSH from ClusterControl server to all MongoDB nodes (including ClusterControl server itself):
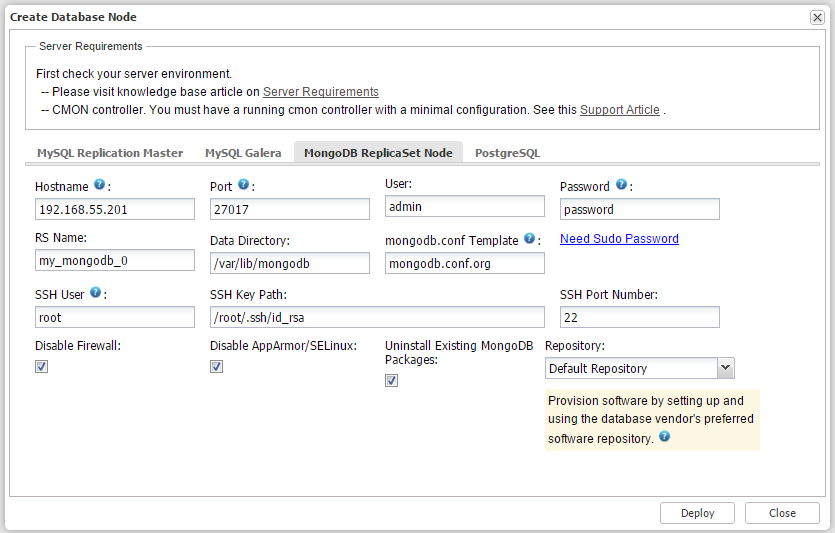
ssh-keygen -t rsa ssh-copy-id 192.168.55.200 ssh-copy-id 192.168.55.201 ssh-copy-id 192.168.55.202 ssh-copy-id 192.168.55.203 - From ClusterControl UI, go to Create Database Node. We are going to deploy MongoDB Replica Set by creating one MongoDB node, then use Add Node function to expand it to a three-node Replica Set.
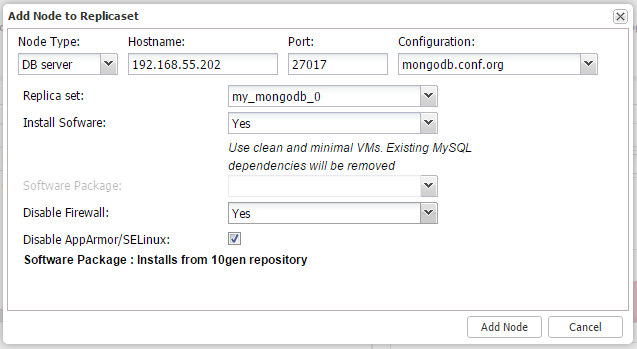
- Click on the Cluster Action icon and go to ‘Add Node to Replica Set’ and add the other two nodes, similar to screenshot below:
Repeat the above steps for graylog3.local (192.168.55.203). Once done, at this point, you should have a three-node MongoDB Replica Set:
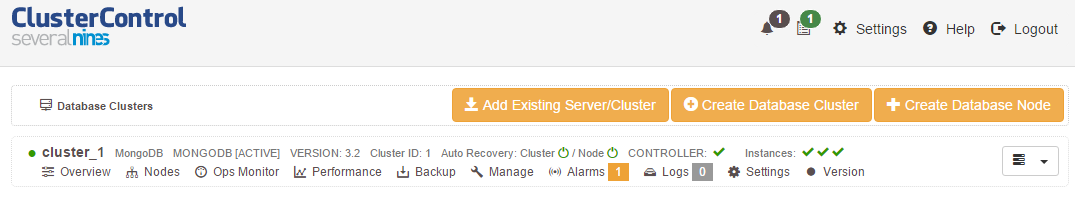
ClusterControl v.1.2.12 defaults to install latest version of MongoDB 3.x.
Setting Up MongoDB User
Once deployed, we need to create a database user for graylog. Login to the MongoDB console on the PRIMARY MongoDB Replica Set node (you can determine the role under the ClusterControl Overview page). In this example, it was graylog1.local:
$ mongo --host my_mongodb_0/192.168.55.121:27017 -u admin -p password admin --authenticationDatabase adminAnd paste the following lines:
my_mongodb_0:PRIMARY> use graylog2
my_mongodb_0:PRIMARY> db.createUser(
    {
      user: "grayloguser",
      pwd: "password",
      roles: [
         { role: "readWrite", db: "graylog2" }
      ]
    }
);
Verify that the user is able to access the graylog2 schema on another replica set member (e.g. 192.168.55.202 was in SECONDARY state):
$ mongo -u grayloguser -p password 192.168.55.202/graylog2Deploying ElasticSearch Cluster
The following steps should be performed on graylog1, graylog2 and graylog3.
- Graylog only supports ElasticSeach v1.7.x. Download the package from ElasticSearch website:
$ wget https://download.elastic.co/elasticsearch/elasticsearch/elasticsearch-1.7.5.noarch.rpm - Install Java OpenJDK:
$ yum install java - Install ElasticSearch package:
$ yum localinstall elasticsearch-1.7.5.noarch.rpm - Specify the following configuration file inside /etc/elasticsearch/elasticsearch.yaml:
cluster.name: graylog-elasticsearch
discovery.zen.ping.multicast.enabled: false
discovery.zen.ping.unicast.hosts: ["graylog1.local", "graylog2.local", "graylog3.local"]
discovery.zen.minimum_master_nodes: 2
network.host: 192.168.55.203
** Change the value of network.host relative to the host that you are configuring.
- Start the ElasticSearch daemon:
$ systemctl enable elasticsearch $ systemctl start elasticsearch - Verify that ElasticSearch is loaded correctly:
$ systemctl status elasticsearch -lAnd ensure it listens to the correct ports (default is 9300):
[root@graylog3 ~]# netstat -tulpn | grep -E '9200|9300'
tcp6       0      0 192.168.55.203:9200     :::*                    LISTEN      97541/java
tcp6       0      0 192.168.55.203:9300     :::*                    LISTEN      97541/java
Use curl to obtain the ElasticSearch cluster state:
[root@graylog1 ~]# curl -XGET 'http://192.168.55.203:9200/_cluster/state?human&pretty'
{
  "cluster_name" : "graylog-elasticsearch",
  "version" : 7,
  "master_node" : "BwQd98BnTBWADDjCvLQ1Jw",
  "blocks" : { },
  "nodes" : {
    "BwQd98BnTBWADDjCvLQ1Jw" : {
      "name" : "Misfit",
      "transport_address" : "inet[/192.168.55.203:9300]",
      "attributes" : { }
    },
    "7djnRL3iR-GJ5ARI8eIwGQ" : {
      "name" : "American Eagle",
      "transport_address" : "inet[/192.168.55.201:9300]",
      "attributes" : { }
    },
    "_WSvA3gbQK2A4v17BUWPug" : {
      "name" : "Scimitar",
      "transport_address" : "inet[/192.168.55.202:9300]",
      "attributes" : { }
    }
  },
  "metadata" : {
    "templates" : { },
    "indices" : { }
  },
  "routing_table" : {
    "indices" : { }
  },
  "routing_nodes" : {
    "unassigned" : [ ],
    "nodes" : {
      "_WSvA3gbQK2A4v17BUWPug" : [ ],
      "BwQd98BnTBWADDjCvLQ1Jw" : [ ],
      "7djnRL3iR-GJ5ARI8eIwGQ" : [ ]
    }
  },
  "allocations" : [ ]
}
Configuring the ElasticSearch cluster is completed.
Deploying Graylog Cluster
The following steps should be performed on graylog1, graylog2 and graylog3.
- Download and install Graylog repository for CentOS 7:
$ rpm -Uvh https://packages.graylog2.org/repo/packages/graylog-1.3-repository-el7_latest.rpm - Install Graylog server and Java OpenJDK:
$ yum install java graylog-server - Generate a SHA sum for our Graylog admin password using the following command:
$ echo -n password | sha256sum | awk {'print $1'}
5e884898da28047151d0e56f8dc6292773603d0d6aabbdd62a11ef721d1542d8
**Copy the generated value to be used as root_password_sha2 value in Graylog configuration file.
- Configure Graylog server configuration file at /etc/graylog/server/server.conf, and ensure following options are set accordingly:
password_secret = password root_password_sha2 = 5e884898da28047151d0e56f8dc6292773603d0d6aabbdd62a11ef721d1542d8 rest_listen_uri = http://0.0.0.0:12900/ elasticsearch_cluster_name = graylog-elasticsearch elasticsearch_discovery_zen_ping_multicast_enabled = false elasticsearch_discovery_zen_ping_unicast_hosts = graylog1.local:9300,graylog2.local:9300,graylog3.local:9300 mongodb_uri = mongodb://grayloguser:[email protected]:27017,192.168.55.202:27017,192.168.55.203:27019/graylog2 - After the configurations are saved, Graylog can be started with the following command:
$ systemctl enable graylog-server
$ systemctl start graylog-server
Ensure all components are up and running inside Graylog log:
$ tail /var/log/graylog-server/server.log
2016-03-03T14:17:42.655+08:00 INFO  [ServerBootstrap] Services started, startup times in ms: {InputSetupService [RUNNING]=2, MetricsReporterService [RUNNING]=7, KafkaJournal [RUNNING]=7, OutputSetupService [RUNNING]=13, BufferSynchronizerService [RUNNING]=14, DashboardRegistryService [RUNNING]=21, JournalReader [RUNNING]=100, PeriodicalsService [RUNNING]=142, IndexerSetupService [RUNNING]=3322, RestApiService [RUNNING]=3835}
2016-03-03T14:17:42.658+08:00 INFO  [ServerBootstrap] Graylog server up and running.
**Repeat the same steps for the remaining nodes.
Deploying Graylog Web UI
The following steps should be performed on web.local.
- Download and install Graylog repository for CentOS 7:
$ rpm -Uvh https://packages.graylog2.org/repo/packages/graylog-1.3-repository-el7_latest.rpm - Install Graylog web UI and Java OpenJDK:
$ yum install java graylog-web - Generate a secret key. The secret key is used to secure cryptographics functions. Set this to a long and randomly generated string. You can use a simple md5sum command to generate it:
$ date | md5sum | awk {'print $1'} eb6aebdeedfb2fa05742d8ca733b5a2c - Configure the Graylog server URIs and application secret (taken as above) inside /etc/graylog/web/web.conf:
graylog2-server.uris="http://192.168.55.201:12900/,http://192.168.55.202:12900/,http://192.168.55.203:12900"
application.secret="eb6aebdeedfb2fa05742d8ca733b5a2c"
** If you deploy your application to several instances be sure to use the same application secret.
- After the configurations are saved, Graylog Web UI can be started with the following command:
$ systemctl enable graylog-web
$ systemctl start graylog-web
Now, login to the Graylog Web UI at http://web.local:9000/ and with username “admin” and password “password”. You should see something like below:

Our Graylog suite is ready. Let’s configure some inputs so it can start capturing log streams and messages.
Configuring Inputs
To start capturing syslog data, we have to configure Inputs. Go to Graylog UI > System / Overview > Inputs. Since we are going to load balance the inputs via HAProxy, we need to configure the syslog input listeners to be running on TCP (HAProxy does not support UDP).
On the dropdown menu, choose “Syslog TCP” and click “Launch New Input”. In the input dialog, configure as follows:
- Global input (started on all nodes)
- Title: Syslog TCP 51400
- Port: 51400
Leave the rest of the options as default and click “Launch”. We have to configure syslog port to be higher than 1024 because Graylog server is running as user “java”. You need to be root to bind sockets on ports 1024 and below on most *NIX systems. You could also try to give permission to the local user then runs graylog2-server to bind to those restricted ports, but usually just choosing a higher port is the easiest solution.
Once configured, you should notice the Global Input is running as shown in the following screenshot:
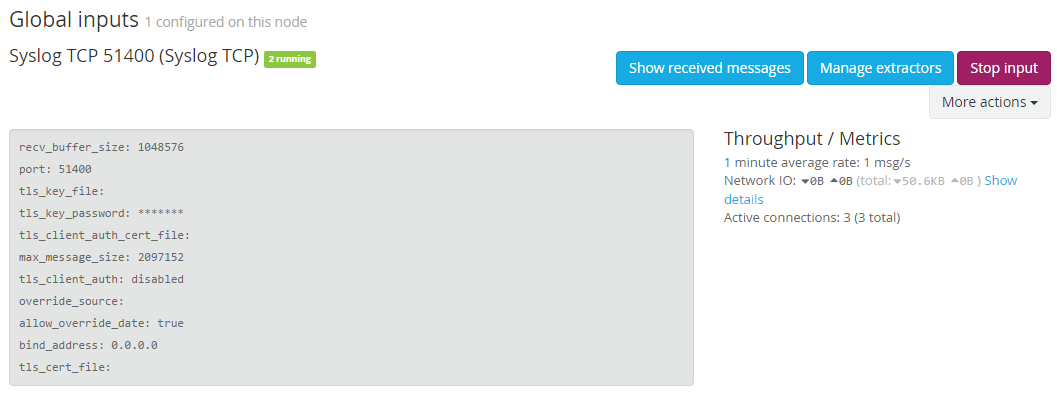
At this point, each Graylog server is now listening on TCP port 51400 for incoming syslog data. You can start configuring the devices to forward the syslog stream to the Graylog servers. The following lines show an example of rsyslog.conf configuration to start forwarding the syslog message to Graylog servers via TCP:
*.* @@192.168.55.201:51400
*.* @@192.168.55.202:51400
*.* @@192.168.55.203:51400
In the above example, rsyslog only sends to the secondary server if the first one fails. But there is also a neat way to provide a high availability single endpoint with auto failover using a load balancer. The load balancer performs the health check on Graylog servers to check if the syslog service is alive, it will also take the dead nodes out of the load balancing set.
In the next section, we deploy HAProxy to load balance this service.
Setting up a Load Balanced Syslog Service
The following steps should be performed on web.local.
- Install HAProxy via package manager:
$ yum install -y haproxy - Clear the existing HAProxy configuration:
$ cat /dev/null > /etc/haproxy/haproxy.cfgAnd add following lines into /etc/haproxy/haproxy.cfg:
global log 127.0.0.1 local2 chroot /var/lib/haproxy pidfile /var/run/haproxy.pid maxconn 4000 user haproxy group haproxy daemon stats socket /var/lib/haproxy/stats defaults mode http log global option dontlognull option redispatch retries 3 timeout http-request 10s timeout queue 1m timeout connect 10s timeout client 1m timeout server 1m timeout http-keep-alive 10s timeout check 10s maxconn 3000 userlist STATSUSERS group admin users admin user admin insecure-password password user stats insecure-password PASSWORD listen admin_page 0.0.0.0:9600 mode http stats enable stats refresh 60s stats uri / acl AuthOkay_ReadOnly http_auth(STATSUSERS) acl AuthOkay_Admin http_auth_group(STATSUSERS) admin stats http-request auth realm admin_page unless AuthOkay_ReadOnly #stats admin if AuthOkay_Admin listen syslog_tcp_514 bind *:514 mode tcp timeout client 120s timeout server 120s default-server inter 2s downinter 5s rise 3 fall 2 maxconn 64 maxqueue 128 weight 100 server graylog1 192.168.55.201:51400 check server graylog2 192.168.55.202:51400 check server graylog3 192.168.55.203:51400 check - Enable HAProxy daemon on boot and start it up:
$ systemctl enable haproxy $ systemctl start haproxy - Verify that HAProxy listener turns green, indicating the backend services are healthy:
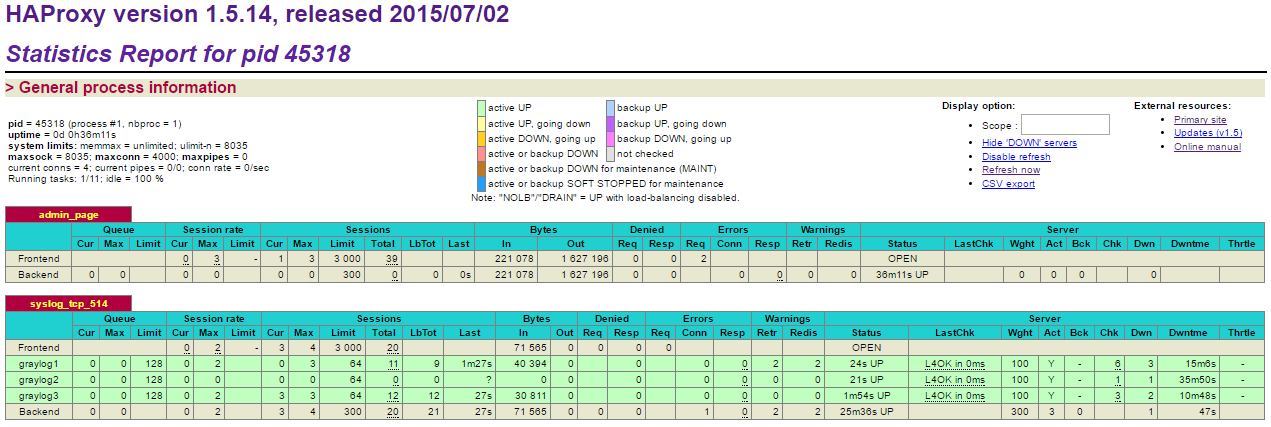
Our syslog service is now load balanced between three Graylog servers on TCP port 514. Next we configure our devices to start sending out syslog messages over TCP to the HAProxy instance.
Configuring Syslog TCP Clients
In this example, we are going to use rsyslog on a standard Linux box to forward syslog messages to the load balanced syslog servers.
- Install rsyslog on the client box:
$ yum install rsyslog # RHEL/CentOS $ apt-get install rsyslog # Debian/Ubuntu - Then append the following line into /etc/rsyslog.conf under “catch-all” log files section (line 94):
*.* @@192.168.55.200:514**Take note that ‘@@’ means we are forwarding syslog messages through TCP, while single ‘@’ is for UDP.
- Restart syslog to load the new configuration:
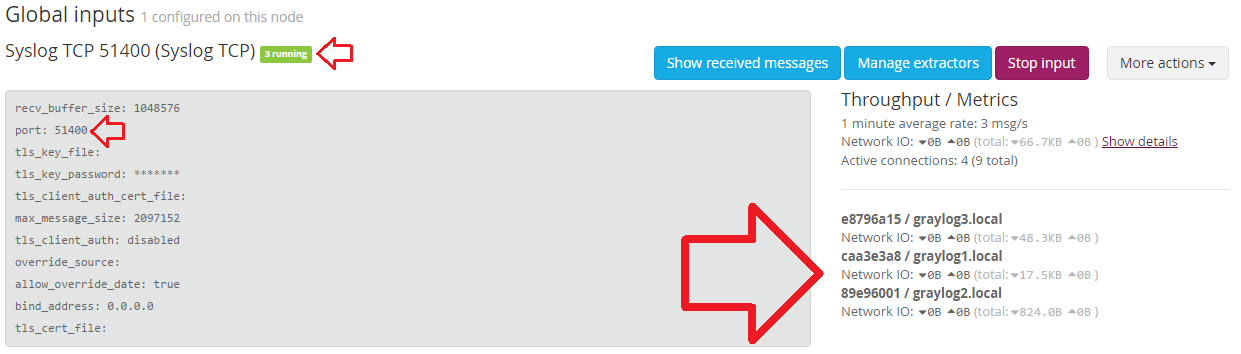
$ systemctl restart syslog - Now we can see the log message stream pouring in under Global inputs section. You can verify this from the “Network IO” section as highlighted by the red arrows in the screenshot below:
Verify the incoming log messages by clicking on ‘Show received messages’:
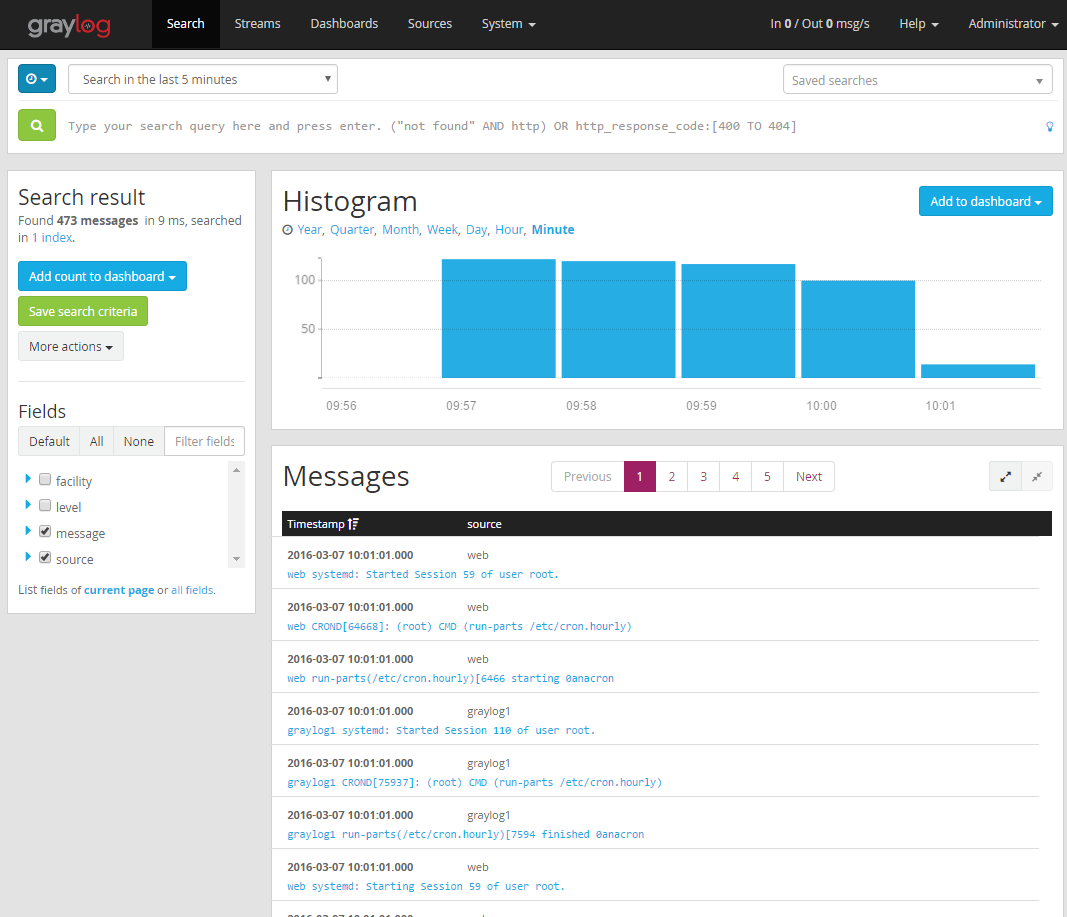
We now have a highly available log processing cluster with Graylog, MongoDB Replica Set, HAProxy and ElasticSearch cluster.
Notes
- This setup does not cover high availability for Graylog web UI, HAProxy and ClusterControl. In order to achieve full resilient setup, we have to have another node to serve as the secondary HAProxy and Graylog web UI with virtual IP address using Keepalived.
- For ClusterControl redundancy, you have to setup a standby ClusterControl server to get higher availability.