blog
An Overview of Caching for PostgreSQL
Put a Virtual DBA on Every Database Server with DBScout
Connect in minutes and optimize your database servers with guardrailed auto-fixes, severity-ranked findings, and permission-based interventions.
Most OLTP workloads involve random disk I/O usage. Knowing that disks (including SSD) are slower in performance than using RAM, database systems use caching to increase performance. Caching is all about storing data in memory (RAM) for faster access at a later point of time.
PostgreSQL also utilizes caching of its data in a space called shared_buffers. In this blog we will explore this functionality to help you increase performance.
PostgreSQL Caching Basics
Before we delve deeper into the concept of caching, let’s have some brush-up of the basics.
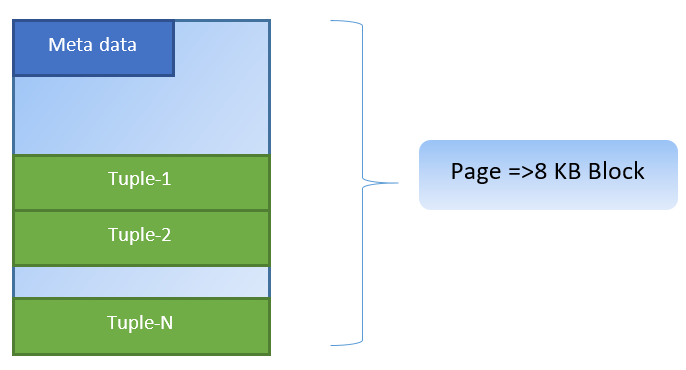
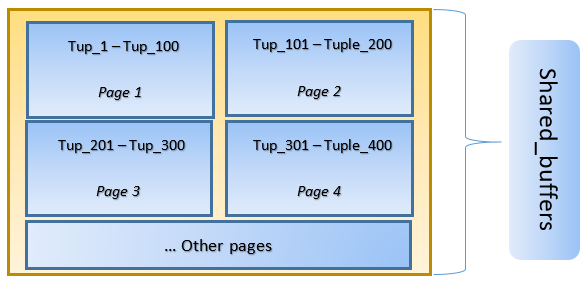
In PostgreSQL, data is organized in the form of pages of size 8KB, and every such page can contain multiple tuples (depending on the size of tuple). A simplistic representation could be like below:
PostgreSQL caches the following for accelerating data access:
- Data in tables
- Indexes
- Query execution plans
While the query execution plan caching focus is on saving CPU cycles; caching for Table data and Index data is focused to save costly disk I/O operation.
PostgreSQL lets users define how much memory they would like to reserve for keeping such cache for data. The relevant setting is shared_buffers in the postgresql.conf configuration file. The finite value of shared_buffers defines how many pages can be cached at any point of time.
As a query is executed, PostgreSQL searches for the page on the disk which contains the relevant tuple and pushes it in the shared_buffers cache for lateral access. Next time the same tuple (or any tuple in the same page) needs to be accessed, PostgreSQL can save disk IO by reading it in memory.
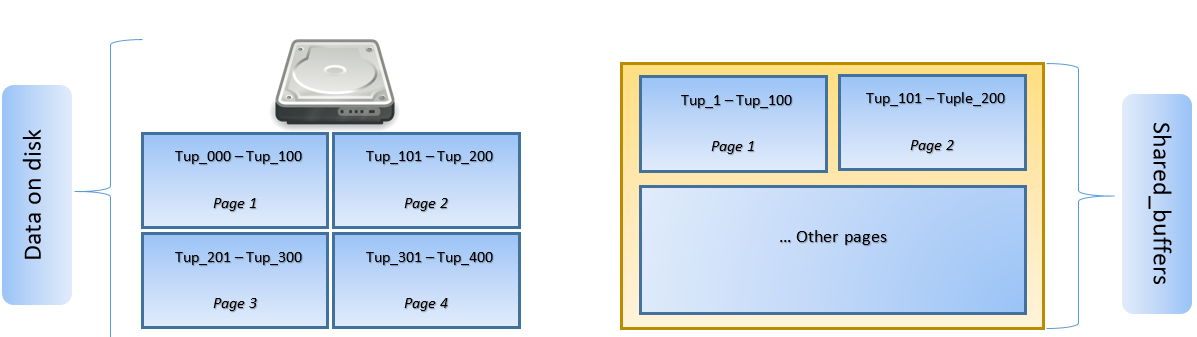
In the above figure, Page-1 and Page-2 of a certain table have been cached. In case a user query needs to access tuples between Tuple-1 to Tuple-200, PostgreSQL can fetch it from RAM itself.
However if the query needs to access Tuples 250 to 350, it will need to do disk I/O for Page 3 and Page 4. Any further access for Tuple 201 to 400 will be fetched from cache and disk I/O will not be needed – thereby making the query faster.
At a high level, PostgreSQL follows LRU (least recently used) algorithm to identify the pages which need to be evicted from the cache. In other words, a page which is accessed only once has higher chances of eviction (as compared to a page which is accessed multiple times), in case a new page needs to be fetched by PostgreSQL into cache.
PostgreSQL Caching in Action
Let’s execute an example and see the impact of cache on the performance.
Start PostgreSQL keeping shared_buffer set to default 128 MB
$ initdb -D ${HOME}/data

$ echo “shared_buffers=128MB” >> ${HOME}/data/postgresql.conf

$ pg_ctl -D ${HOME}/data start
Connect to the server and create a dummy table tblDummy and an index on c_id
CREATE Table tblDummy

(

id serial primary key,

p_id int,

c_id int,

entry_time timestamp,

entry_value int,

description varchar(50)

);

CREATE INDEX ON tblDummy(c_id );
Populate dummy data with 200000 tuples, such that there are 10000 unique p_id and for every p_id there are 200 c_id
DO $

DECLARE

random_value integer:= 1;

BEGIN

FOR p_id_ctr IN 1..10000 BY 1 LOOP

FOR c_id_ctr IN 1..200 BY 1 LOOP

random_value = (( random() * 75 ) + 25);

INSERT INTO tblDummy (p_id,c_id,entry_time, entry_value, description )

VALUES (p_id_ctr,c_id_ctr,'now', random_value, CONCAT('Description for :',p_id_ctr, c_id_ctr));

END LOOP ;

END LOOP ;

END $;
Restart the server to clear the cache. Now execute a query and check for the time taken to execute the same
SELECT pg_stat_reset();

EXPLAIN ANAYZE SELECT count(*) from tbldummy where c_id=1;


                           QUERY PLAN

--------------------------------------------------------------

 Aggregate  (cost=17407.33..17407.34 rows=1 width=8) (actual time=160.269..160.269 rows=1 loops=1)

   ->  Bitmap Heap Scan on tbldummy  (cost=189.52..17382.46 rows=9948 width=0) (actual time=10.627..156.275 rows=10000 loops=1)

         Recheck Cond: (c_id = 1)

         Heap Blocks: exact=10000

         ->  Bitmap Index Scan on tbldummy_c_id_idx  (cost=0.00..187.04 rows=9948 width=0) (actual time=5.091..5.091 rows=10000 loops=1)

               Index Cond: (c_id = 1)

 Planning Time: 1.325 ms

 Execution Time: 160.505 ms
Then check the blocks read from the disk
SELECT heap_blks_read, heap_blks_hit from pg_statio_user_tables where relname='tbldummy';

heap_blks_read | heap_blks_hit

---------------+---------------

10000          |             0
In the above example, there were 1000 blocks read from the disk to find count tuples where c_id = 1. It took 160 ms since there was disk I/O involved to fetch those records from disk.
Execution is faster if same query is re-executed, as all the blocks are still in cache of PostgreSQL server at this stage
SELECT pg_stat_reset();

EXPLAIN ANAYZE SELECT count(*) from tbldummy where c_id=1;


                                 QUERY PLAN

-------------------------------------------------------------------------------------

 Aggregate  (cost=17407.33..17407.34 rows=1 width=8) (actual time=33.760..33.761 rows=1 loops=1)

   ->  Bitmap Heap Scan on tbldummy  (cost=189.52..17382.46 rows=9948 width=0) (actual time=9.584..30.576 rows=10000 loops=1)

         Recheck Cond: (c_id = 1)

         Heap Blocks: exact=10000

         ->  Bitmap Index Scan on tbldummy_c_id_idx  (cost=0.00..187.04 rows=9948 width=0) (actual time=4.314..4.314 rows=10000 loops=1)

               Index Cond: (c_id = 1)

 Planning Time: 0.106 ms

 Execution Time: 33.990 ms
and blocks read from the disk vs from cache
SELECT heap_blks_read, heap_blks_hit from pg_statio_user_tables where relname='tbldummy';

heap_blks_read | heap_blks_hit

---------------+---------------

    0          |         10000
It is evident from above that since all blocks were read from the cache and no disk I/O was required. This hence also gave the results faster.
Setting the Size of the PostgreSQL Cache
The size of the cache needs to be tuned in a production environment in accordance to the amount of RAM available as well as the queries required to be executed.
As an example – shared_buffer of 128MB may not be sufficient to cache all data, if the query was to fetch more tuples:
SELECT pg_stat_reset();

SELECT count(*) from tbldummy where c_id < 150;

SELECT heap_blks_read, heap_blks_hit from pg_statio_user_tables where relname='tbldummy';

 heap_blks_read | heap_blks_hit

----------------+---------------

      20331     |      288
Change the shared_buffer to 1024MB to increase the heap_blks_hit.
In-fact, considering the queries (based on c_id), in case data is re-organized, a better cache hit ratio can be achieved with a smaller shared_buffer as well.
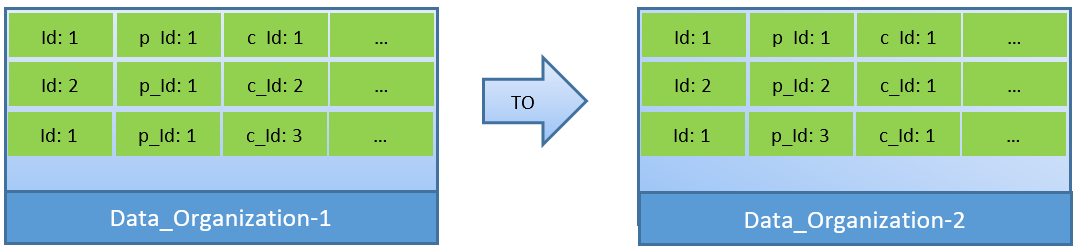
In Data_Organization-1, PostgreSQL will need 1000 block reads (and cache consumption) for finding c_id=1. On the other hand, for Data_Organisation-2, for the same query, PostgreSQL will need only 104 blocks.
Less blocks required for the same query eventually consume less cache and also keep query execution time optimized.
Conclusion
While the shared_buffer is maintained at PostgreSQL process level, the kernel level cache is also taken into consideration for identifying optimized query execution plans. I hope you have enjoyed this primer on Postgres caching. If you like this post and would like to stay up-to-date with the latest in Postgres operations and the database ops as a whole, be sure to subscribe to our newsletter in the box to the right and follow us on LinkedIn or X.
Our automation platform, ClusterControl, helps ensure PostgreSQL cluster reliability and supports multiple other open-source databases in any environment, including MongoDB and Elasticsearch — it does this through a robust suite of monitoring, alerting, and automation features. If you haven’t had the opportunity to test it out yet, you can try it free for 30-days.