blog
Connection Handling & Throttling with ProxySQL

The ability to shape the traffic that goes to the database is one of the most important ones. In the past days you had not that much control over it – applications sent the traffic to the database and that’s about it. HAProxy, which was commonly used, also does not have an option for fine-grained control over the traffic. With the introduction of the SQL-aware proxies, like ProxySQL, more possibilities became available for database administrators. Let’s take a look at the connection handling and throttling possibilities in ProxySQL.
Connection Handling in ProxySQL
As you may know, the way ProxySQL works is through the query rules. It is a list of rules that every query is tested against and that govern exactly how the ProxySQL will handle the query. Starting from the beginning, the application connects to ProxySQL. It will authenticate against ProxySQL (this is why ProxySQL has to store all users and password hashes) and then ProxySQL will run it through the query rules to determine to which hostgroup the query should be sent to.
ProxySQL opens a pool of connections to the backend servers. It is not 1-to-1 mapping, by default it tries to reuse one backend connection for as many frontend connections as possible. This is called connection multiplexing. Details depend on the exact traffic that it has to handle. Every open transaction has to be handled within the same connection. If there is some kind of a local variable defined, this connection cannot be reused. Being able to reuse single backend connection by multiple frontend connections reduces significantly the burden on the backend database.
Once the connection is made to the ProxySQL, as we mentioned before, it will be processed according to the query rules. Here the traffic shaping may take place. Let’s take a look at the options
Connection Throttling in ProxySQL
First, let’s just drop all the SELECTs. We are running our “application”, Sysbench, in following manner:
root@vagrant:~# sysbench /root/sysbench/src/lua/oltp_read_only.lua --threads=4 --events=200 --time=0 --mysql-host=10.0.0.101 --mysql-user=sbtest --mysql-password=sbtest --mysql-port=6033 --tables=32 --report-interval=1 --skip-trx=on --table-size=100000 --db-ps-mode=disable --rate=10 run

sysbench 1.1.0-bbee5d5 (using bundled LuaJIT 2.1.0-beta3)


Running the test with following options:

Number of threads: 4

Target transaction rate: 10/sec

Report intermediate results every 1 second(s)

Initializing random number generator from current time


Initializing worker threads...


Threads started!


[ 1s ] thds: 4 tps: 5.97 qps: 103.49 (r/w/o: 103.49/0.00/0.00) lat (ms,95%): 244.38 err/s: 0.00 reconn/s: 0.00

[ 1s ] queue length: 0, concurrency: 4

[ 2s ] thds: 4 tps: 13.02 qps: 181.32 (r/w/o: 181.32/0.00/0.00) lat (ms,95%): 580.02 err/s: 0.00 reconn/s: 0.00

[ 2s ] queue length: 5, concurrency: 4

[ 3s ] thds: 4 tps: 14.99 qps: 228.81 (r/w/o: 228.81/0.00/0.00) lat (ms,95%): 669.89 err/s: 0.00 reconn/s: 0.00

[ 3s ] queue length: 1, concurrency: 4

[ 4s ] thds: 4 tps: 16.99 qps: 232.88 (r/w/o: 232.88/0.00/0.00) lat (ms,95%): 350.33 err/s: 0.00 reconn/s: 0.00

[ 4s ] queue length: 0, concurrency: 3

[ 5s ] thds: 4 tps: 8.99 qps: 99.91 (r/w/o: 99.91/0.00/0.00) lat (ms,95%): 369.77 err/s: 0.00 reconn/s: 0.00

[ 5s ] queue length: 0, concurrency: 1

[ 6s ] thds: 4 tps: 3.99 qps: 55.81 (r/w/o: 55.81/0.00/0.00) lat (ms,95%): 147.61 err/s: 0.00 reconn/s: 0.00

[ 6s ] queue length: 0, concurrency: 1

[ 7s ] thds: 4 tps: 11.06 qps: 162.89 (r/w/o: 162.89/0.00/0.00) lat (ms,95%): 173.58 err/s: 0.00 reconn/s: 0.00

[ 7s ] queue length: 0, concurrency: 2

[ 8s ] thds: 4 tps: 7.99 qps: 112.88 (r/w/o: 112.88/0.00/0.00) lat (ms,95%): 200.47 err/s: 0.00 reconn/s: 0.00

[ 8s ] queue length: 0, concurrency: 2

[ 9s ] thds: 4 tps: 9.01 qps: 110.09 (r/w/o: 110.09/0.00/0.00) lat (ms,95%): 71.83 err/s: 0.00 reconn/s: 0.00

[ 9s ] queue length: 0, concurrency: 0

[ 10s ] thds: 4 tps: 9.99 qps: 143.87 (r/w/o: 143.87/0.00/0.00) lat (ms,95%): 153.02 err/s: 0.00 reconn/s: 0.00

[ 10s ] queue length: 0, concurrency: 1

[ 11s ] thds: 4 tps: 12.02 qps: 177.28 (r/w/o: 177.28/0.00/0.00) lat (ms,95%): 170.48 err/s: 0.00 reconn/s: 0.00

[ 11s ] queue length: 0, concurrency: 1

[ 12s ] thds: 4 tps: 5.00 qps: 70.95 (r/w/o: 70.95/0.00/0.00) lat (ms,95%): 231.53 err/s: 0.00 reconn/s: 0.00

[ 12s ] queue length: 0, concurrency: 2

[ 13s ] thds: 4 tps: 10.00 qps: 137.01 (r/w/o: 137.01/0.00/0.00) lat (ms,95%): 223.34 err/s: 0.00 reconn/s: 0.00

[ 13s ] queue length: 0, concurrency: 1

[ 14s ] thds: 4 tps: 11.01 qps: 143.14 (r/w/o: 143.14/0.00/0.00) lat (ms,95%): 130.13 err/s: 0.00 reconn/s: 0.00

[ 14s ] queue length: 0, concurrency: 0

[ 15s ] thds: 4 tps: 5.00 qps: 100.99 (r/w/o: 100.99/0.00/0.00) lat (ms,95%): 297.92 err/s: 0.00 reconn/s: 0.00

[ 15s ] queue length: 0, concurrency: 4

[ 16s ] thds: 4 tps: 10.98 qps: 122.82 (r/w/o: 122.82/0.00/0.00) lat (ms,95%): 344.08 err/s: 0.00 reconn/s: 0.00

[ 16s ] queue length: 0, concurrency: 0

[ 17s ] thds: 4 tps: 3.00 qps: 59.01 (r/w/o: 59.01/0.00/0.00) lat (ms,95%): 287.38 err/s: 0.00 reconn/s: 0.00

[ 17s ] queue length: 0, concurrency: 2

[ 18s ] thds: 4 tps: 13.01 qps: 165.14 (r/w/o: 165.14/0.00/0.00) lat (ms,95%): 173.58 err/s: 0.00 reconn/s: 0.00

[ 18s ] queue length: 0, concurrency: 0

[ 19s ] thds: 4 tps: 6.99 qps: 98.79 (r/w/o: 98.79/0.00/0.00) lat (ms,95%): 253.35 err/s: 0.00 reconn/s: 0.00

[ 19s ] queue length: 0, concurrency: 1

[ 20s ] thds: 4 tps: 9.98 qps: 164.60 (r/w/o: 164.60/0.00/0.00) lat (ms,95%): 590.56 err/s: 0.00 reconn/s: 0.00

[ 20s ] queue length: 0, concurrency: 3

SQL statistics:

    queries performed:

        read:                            2800

        write:                           0

        other:                           0

        total:                           2800

    transactions:                        200    (9.64 per sec.)

    queries:                             2800   (134.89 per sec.)

    ignored errors:                      0      (0.00 per sec.)

    reconnects:                          0      (0.00 per sec.)


Throughput:

    events/s (eps):                      9.6352

    time elapsed:                        20.7573s

    total number of events:              200


Latency (ms):

         min:                                   44.36

         avg:                                  202.66

         max:                                  726.59

         95th percentile:                      590.56

         sum:                                40531.73


Threads fairness:

    events (avg/stddev):           50.0000/0.71

    execution time (avg/stddev):   10.1329/0.05
It is a fully read-only traffic, it should average in 10 transactions (140 queries) per second. As those are only SELECTs, we can easily modify one of the existing query rules and block the traffic:
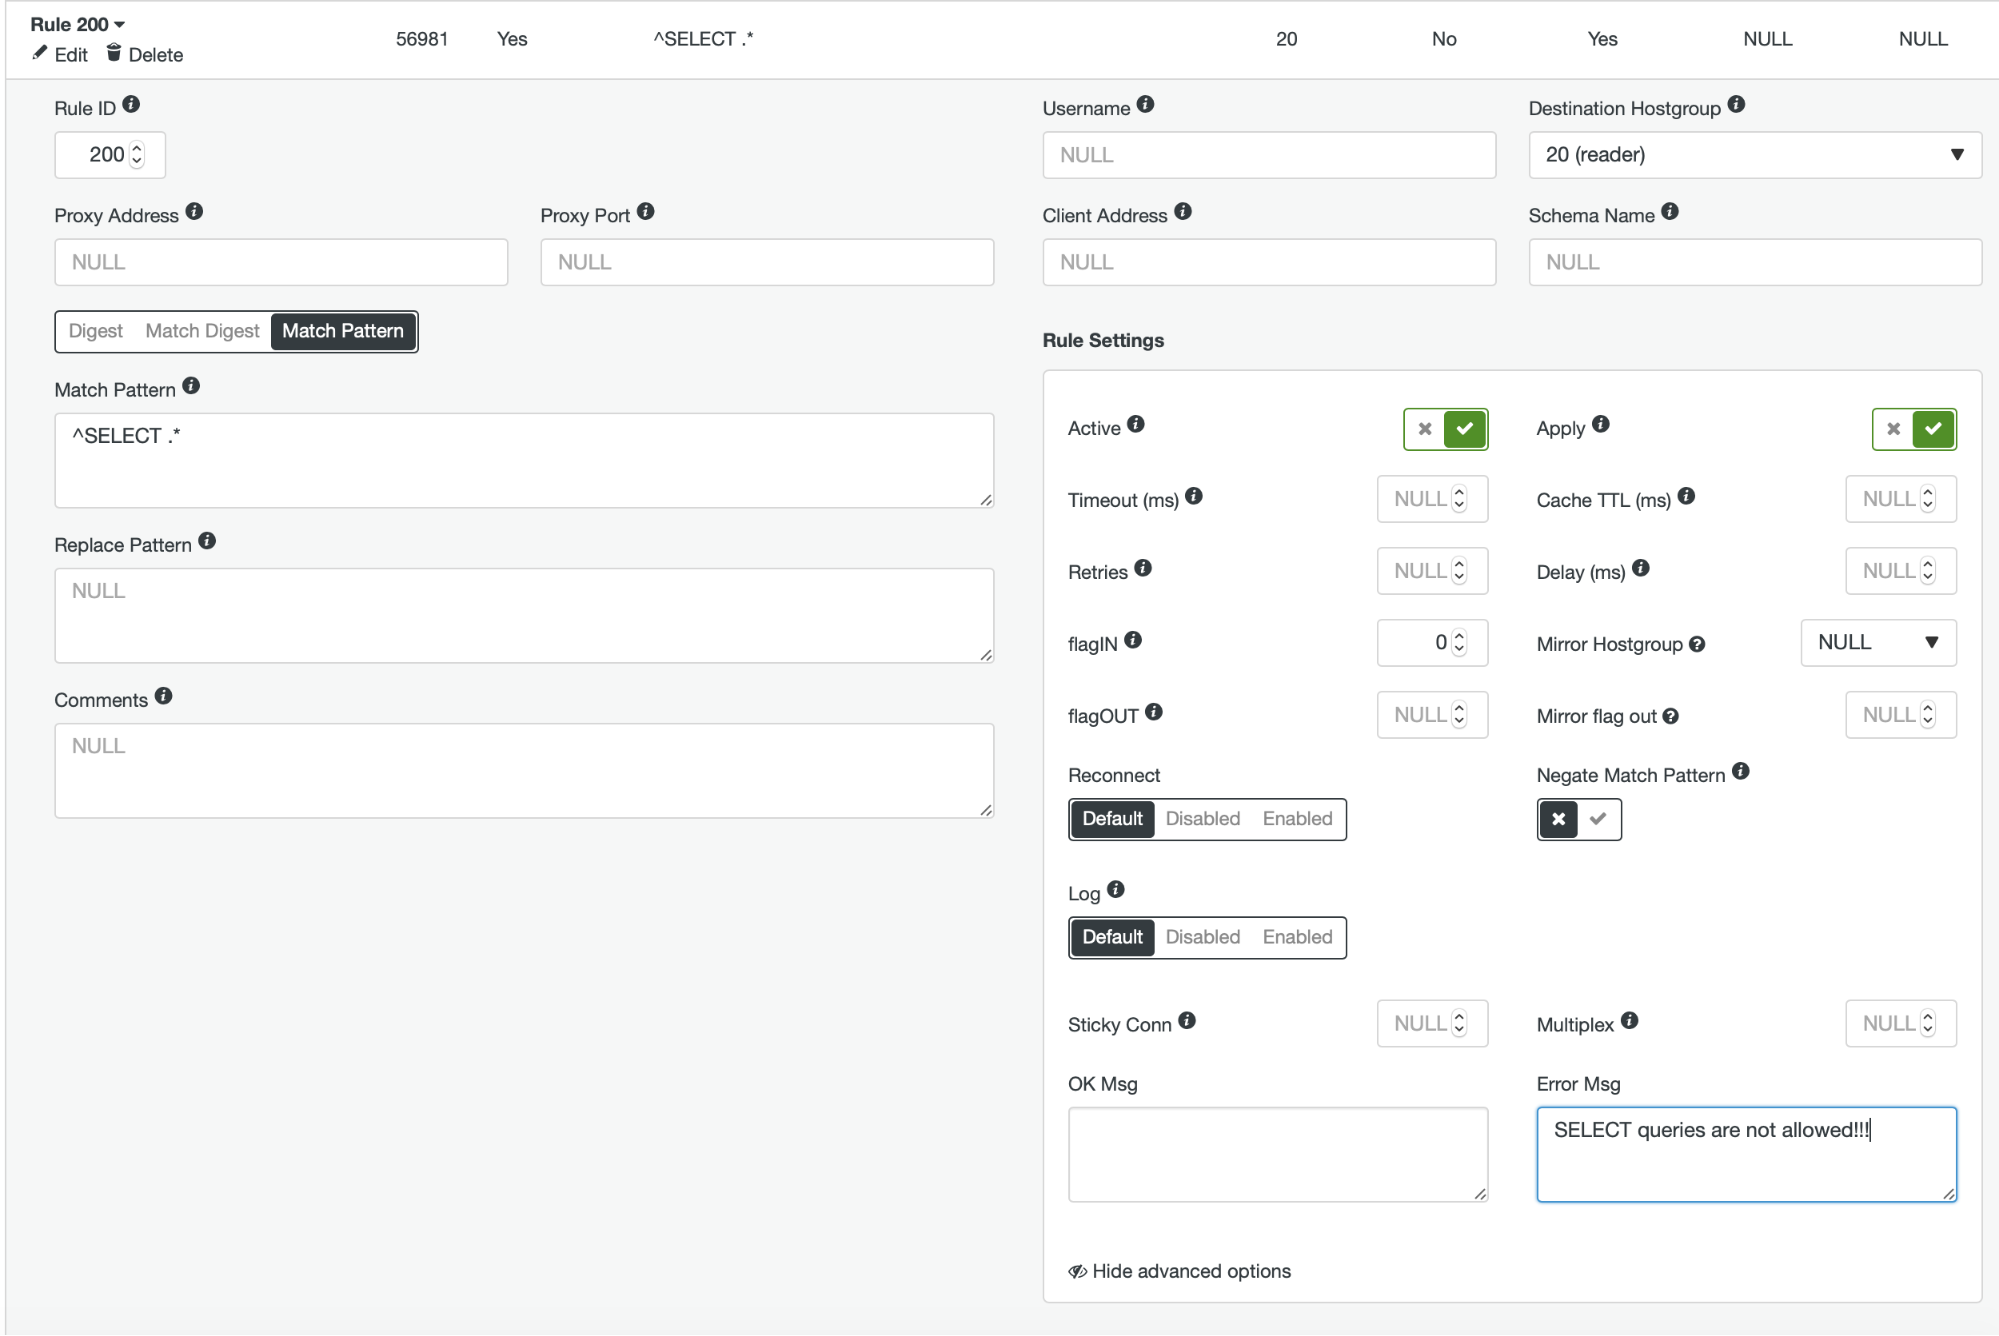
This will result in following error on the application side:
root@vagrant:~# sysbench /root/sysbench/src/lua/oltp_read_only.lua --threads=4 --events=200 --time=0 --mysql-host=10.0.0.101 --mysql-user=sbtest --mysql-password=sbtest --mysql-port=6033 --tables=32 --report-interval=1 --skip-trx=on --table-size=100000 --db-ps-mode=disable --rate=10 run

sysbench 1.1.0-bbee5d5 (using bundled LuaJIT 2.1.0-beta3)


Running the test with following options:

Number of threads: 4

Target transaction rate: 10/sec

Report intermediate results every 1 second(s)

Initializing random number generator from current time


Initializing worker threads...


Threads started!


FATAL: mysql_drv_query() returned error 1148 (SELECT queries are not allowed!!!) for query 'SELECT c FROM sbtest25 WHERE id=83384'

FATAL: `thread_run' function failed: /usr/local/share/sysbench/oltp_common.lua:426: SQL error, errno = 1148, state = '42000': SELECT queries are not allowed!!!
Now, this is obviously harsh. We can be more polite and just increase delay for the SELECT queries.
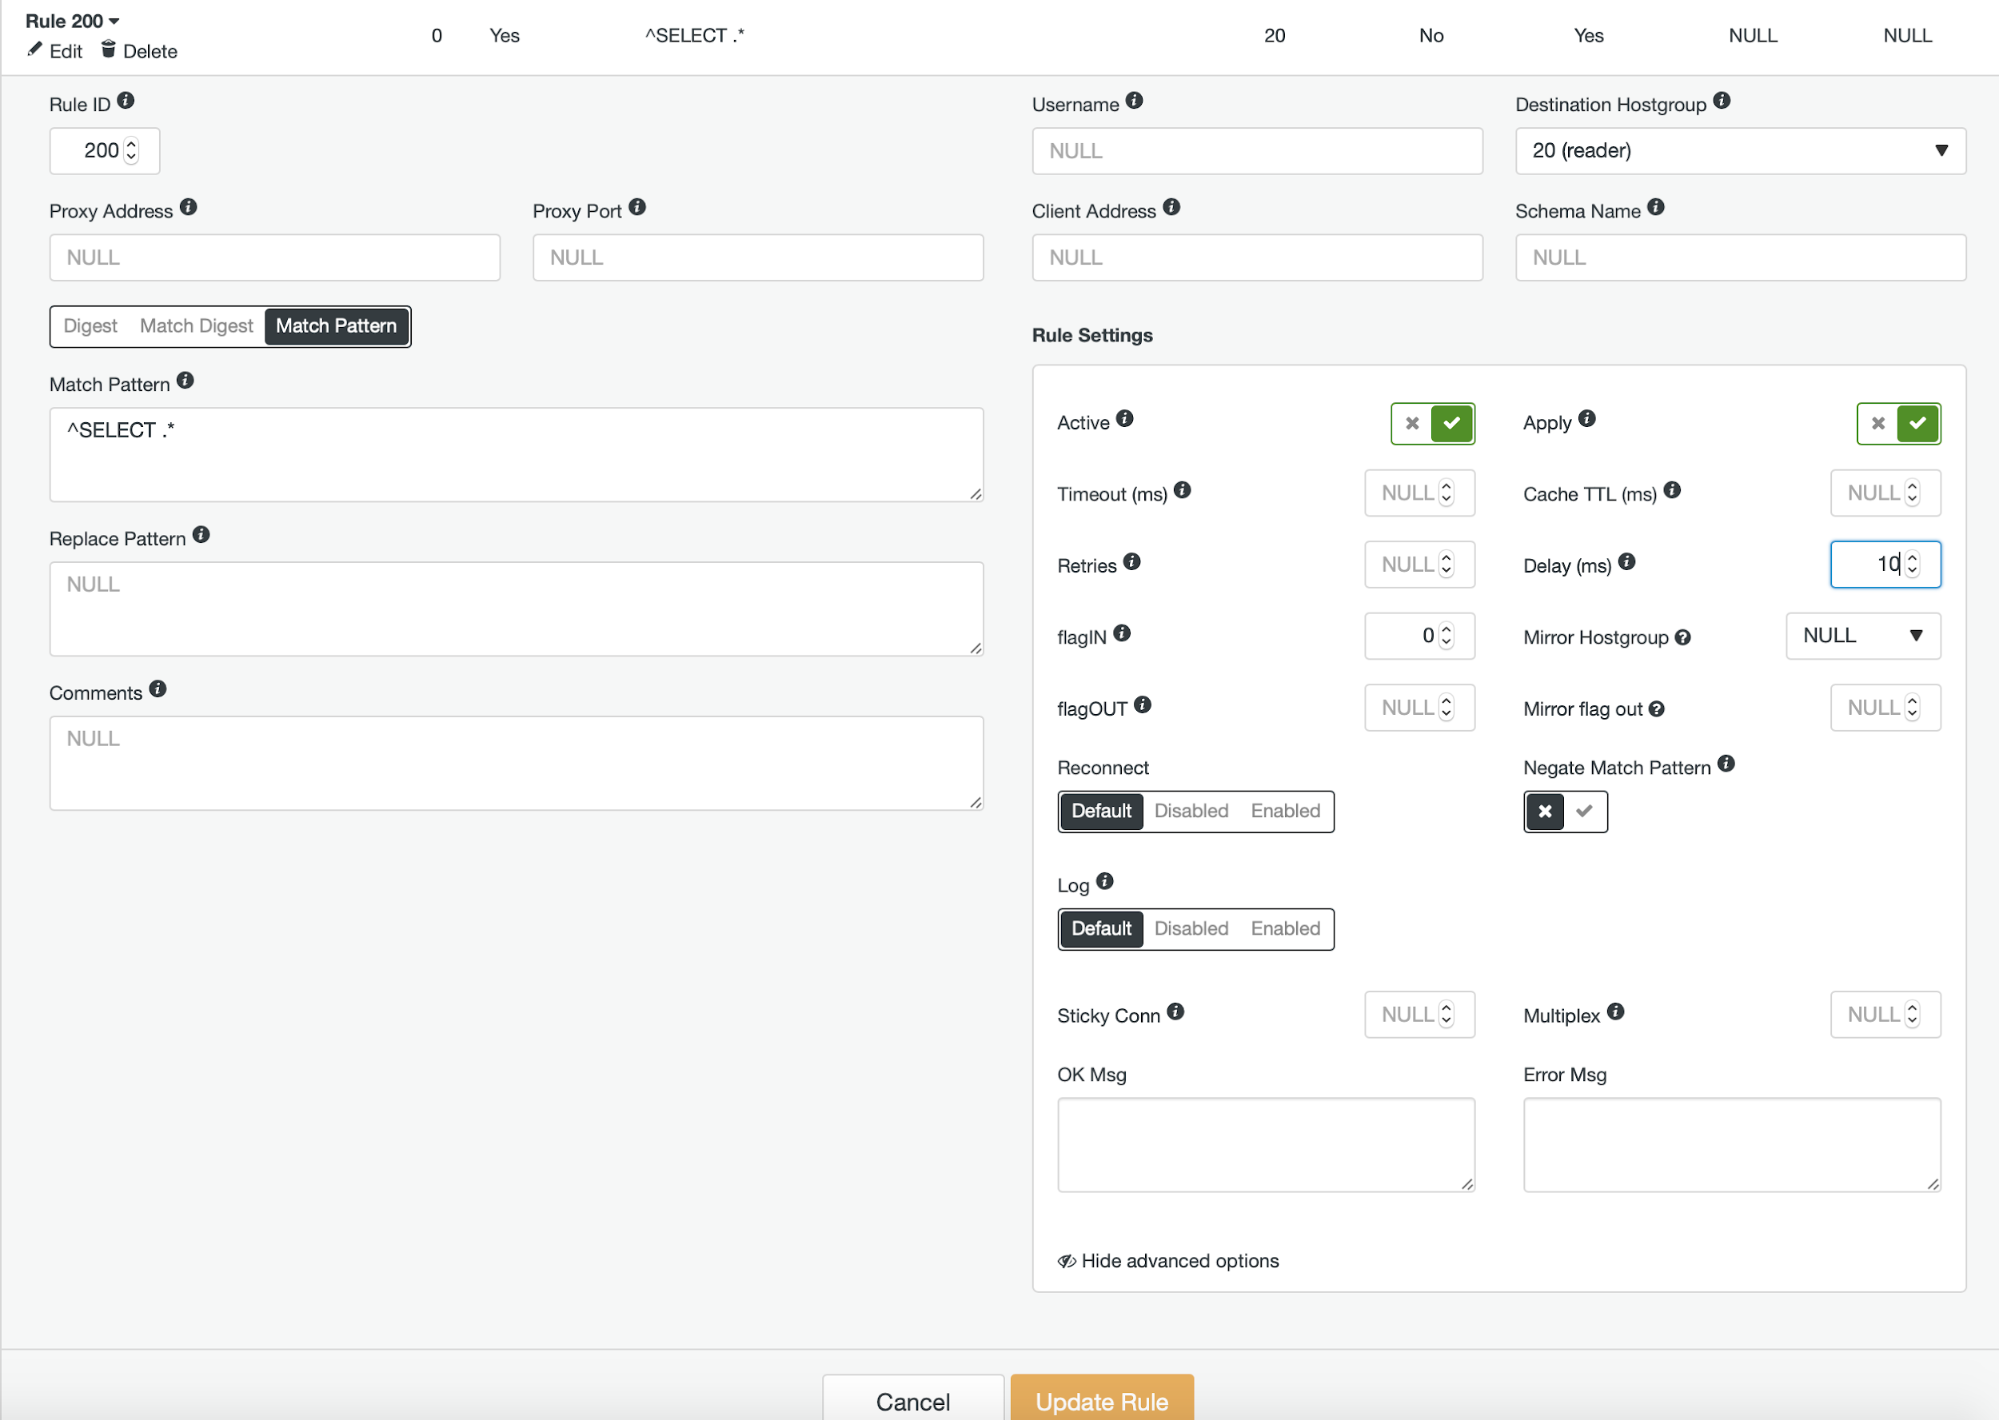
This, obviously, impacts the performance of the queries as 10 milliseconds are added to every SELECT that is executed.
SQL statistics:

    queries performed:

        read:                            2800

        write:                           0

        other:                           0

        total:                           2800

    transactions:                        200    (5.60 per sec.)

    queries:                             2800   (78.44 per sec.)

    ignored errors:                      0      (0.00 per sec.)

    reconnects:                          0      (0.00 per sec.)


Throughput:

    events/s (eps):                      5.6030

    time elapsed:                        35.6952s

    total number of events:              200


Latency (ms):

         min:                                  622.04

         avg:                                 7957.01

         max:                                18808.60

         95th percentile:                    15934.78

         sum:                              1591401.12


Threads fairness:

    events (avg/stddev):           50.0000/36.01

    execution time (avg/stddev):   397.8503/271.50
We set up delays for every SELECT query, which does not necessarily make any sense other than showing that you can do it. Typically you would like to use the delay on some offending queries. Let’s say we have a query that is very heavy and it adds significant load on the database’s CPU. What’s worse, it has been introduced by recent code change and it comes from all of the application hosts. Sure, you can wait for the developers to revert the change or push a fix but with ProxySQL you can take the control in your own hands and just either block the query or reduce its impact even quite significantly.
Let’s assume that our database is moving on nicely when alarm bells start to ring.
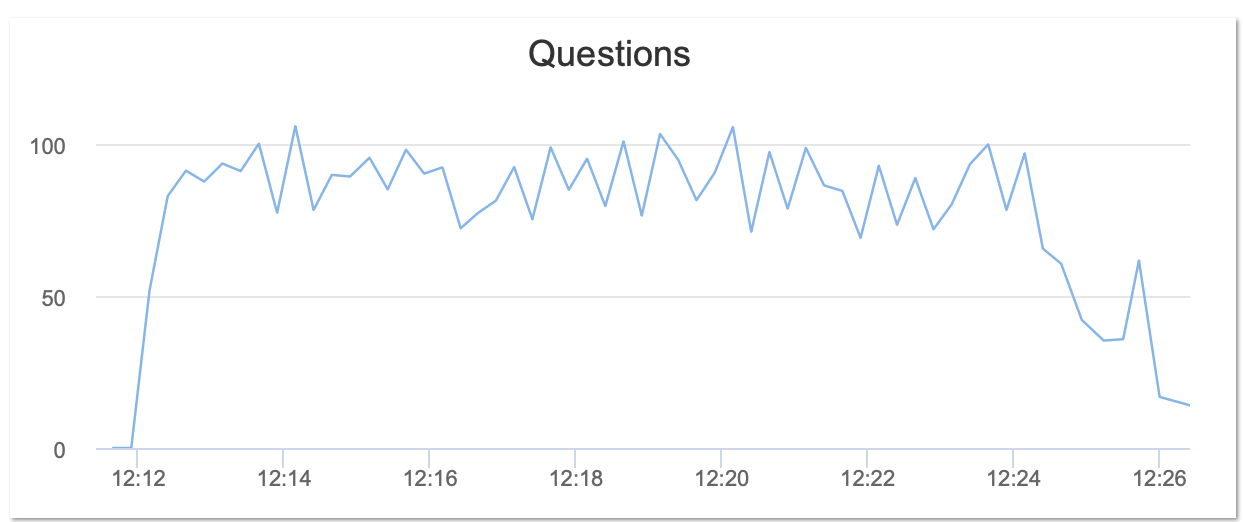
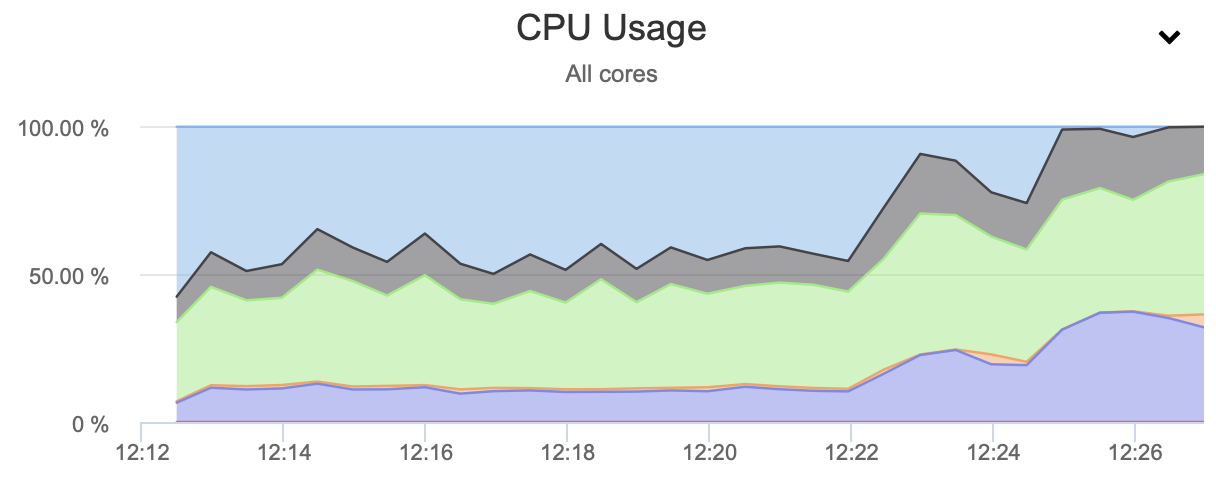
A quick look at the metrics tells us that the number of queries executed by ProxySQL goes down while CPU utilization goes up. We can look at the Top Queries in ProxySQL to see if we can notice something unusual.
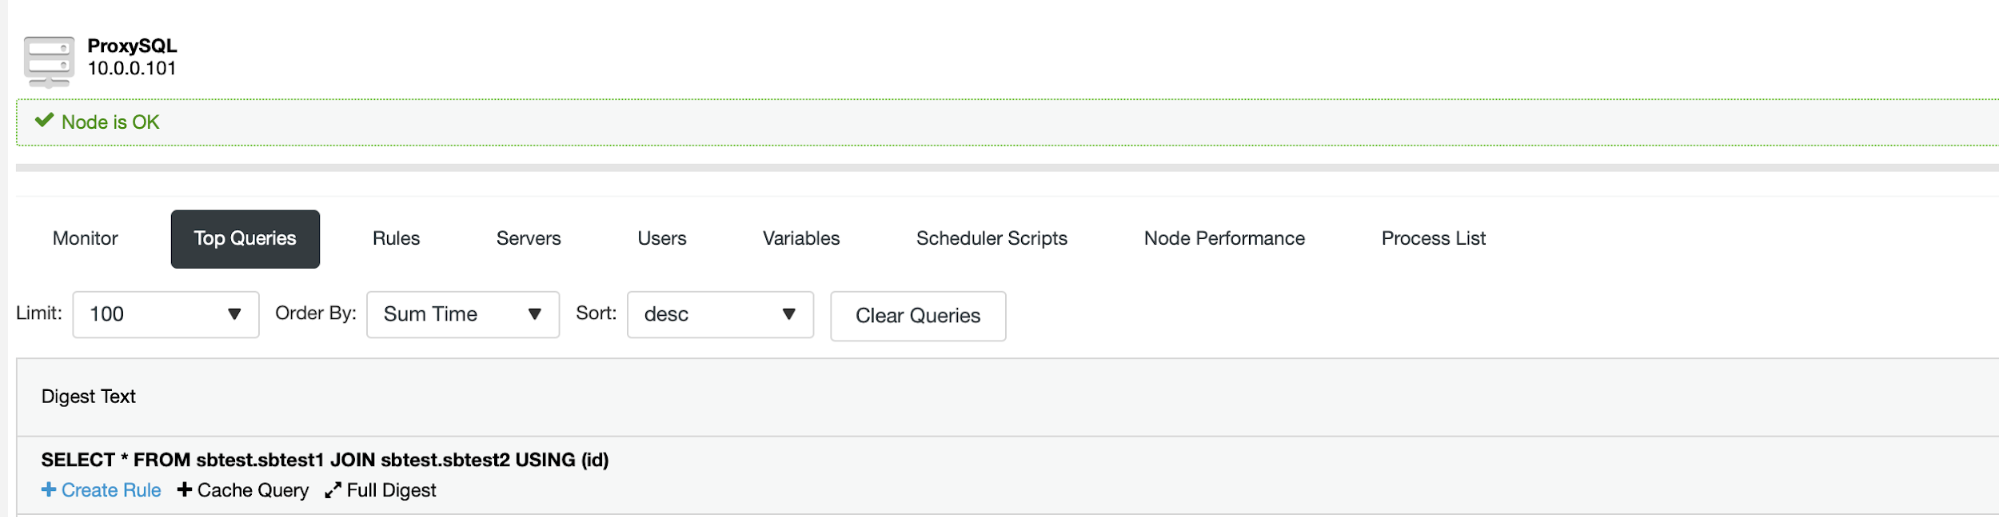
Unusual it is indeed – a new query that is not a part of the regular query mix we observed on our system. We can use the option to create the query rule.
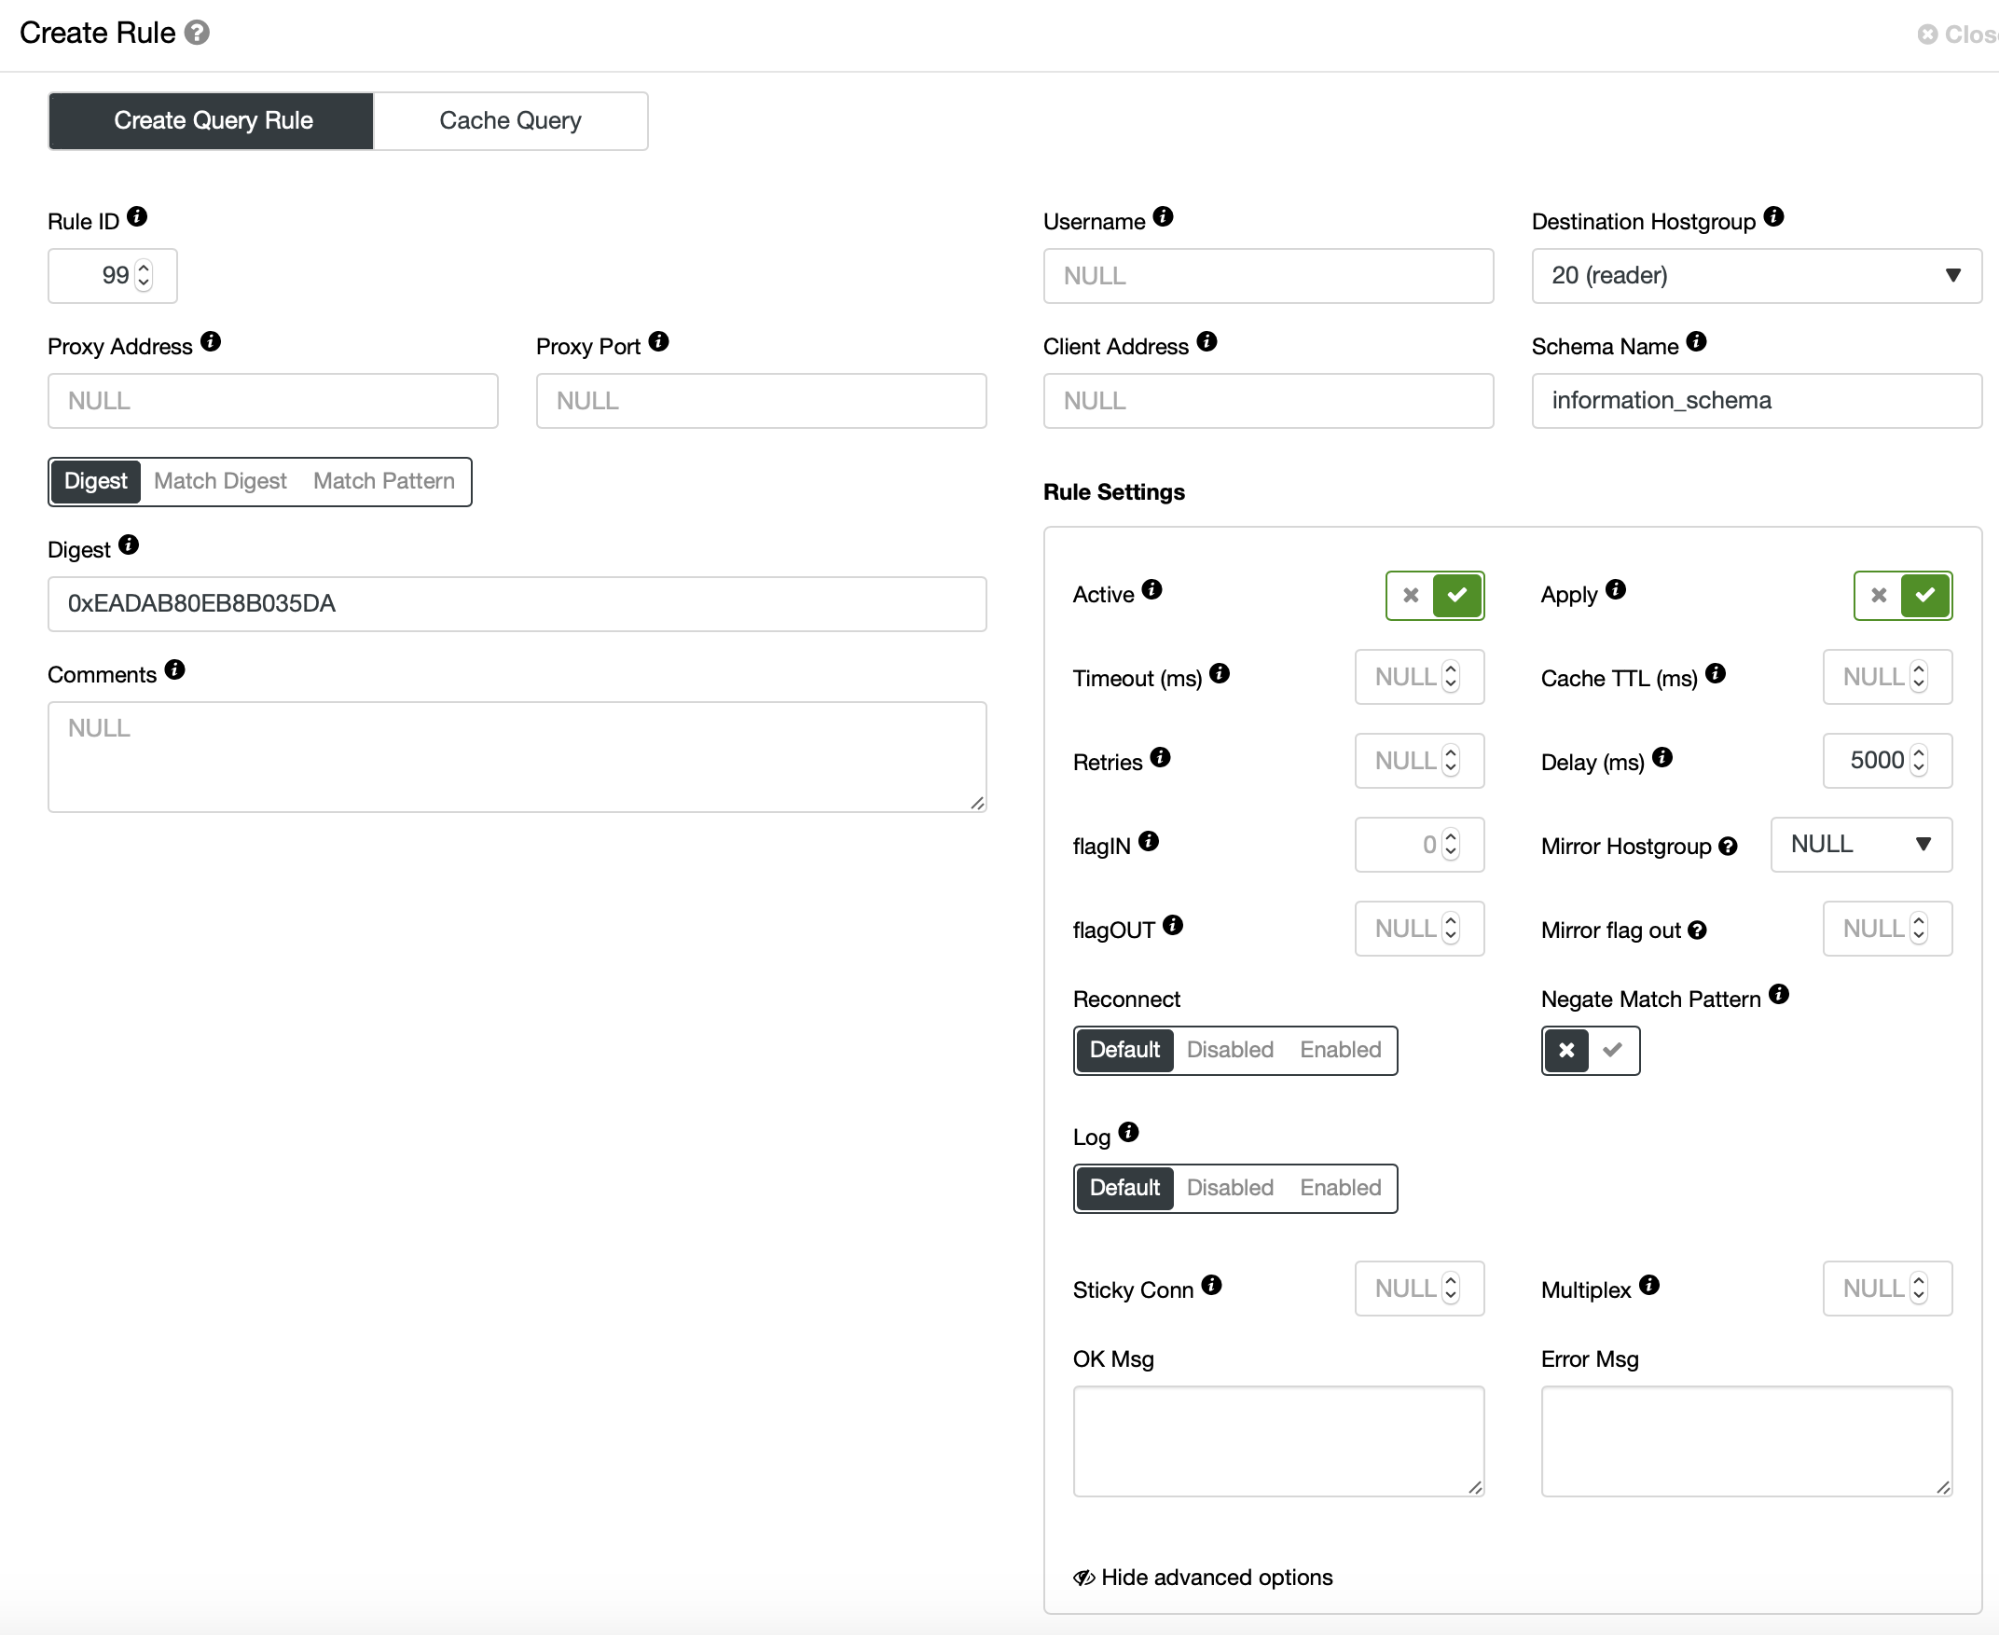
We will add a 50 second delay to the query by setting Delay to 50000 ms.

We can confirm that the query rule is in use and queries are hitting it.
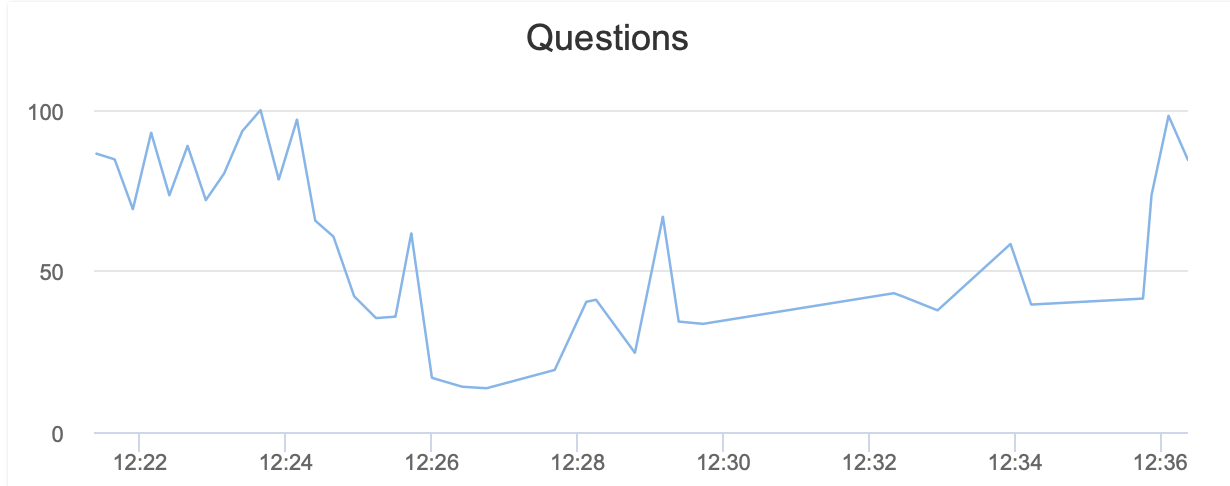
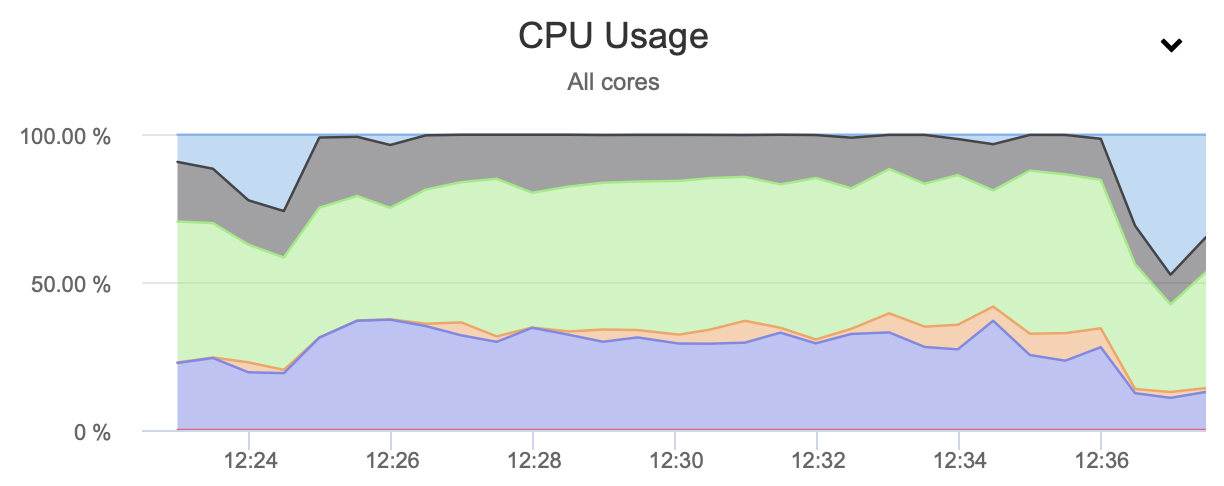
After a short while we can also notice that the load drops and the number of queries executed is again in the expected range. Of course, instead of adding the delay to the query we could just simply block it. That would have been even easier for us to accomplish but totally blocking the query may come with significant impact on the application.
We hope this short blog post gives you some insight into how ProxySQL can help you to shape your traffic and reduce the performance hit introduced by runaway queries.