blog
Automatic Failover of Postgres Replication

Streaming replication setups with Postgres are inevitably related to failovers. The sole writer in the setup would be the primary, it generates XLOG records and continuously ships them to one or more standby servers. If the primary fails, one of the standby servers will have to take its role through the process of failover. This process can be tricky and potentially, it may cause data loss. It may happen, for example, if a standby is not up to date while it is promoted. The master may also die before it is able to transfer all binlog events to at least one of its standby’s.
PostgreSQL has been supported by ClusterControl for a while, it provided an easy way to deploy a streaming replication setup, with a primary server and one or more standby servers. ClusterControl 1.4.2 brings major improvements related to how ClustertControl handles failures in a PostreSQL replication setup. In this blog, we’ll have a look at these features.
Deploying Entire Replication Topologies
Starting from ClusterControl 1.4.2, you can deploy an entire PostgreSQL replication setup in the same way as you would deploy MySQL and MongoDB: you can use “Deploy Cluster” menu to deploy a primary and one or more PostgreSQL standby servers. Let’s see what it looks like.
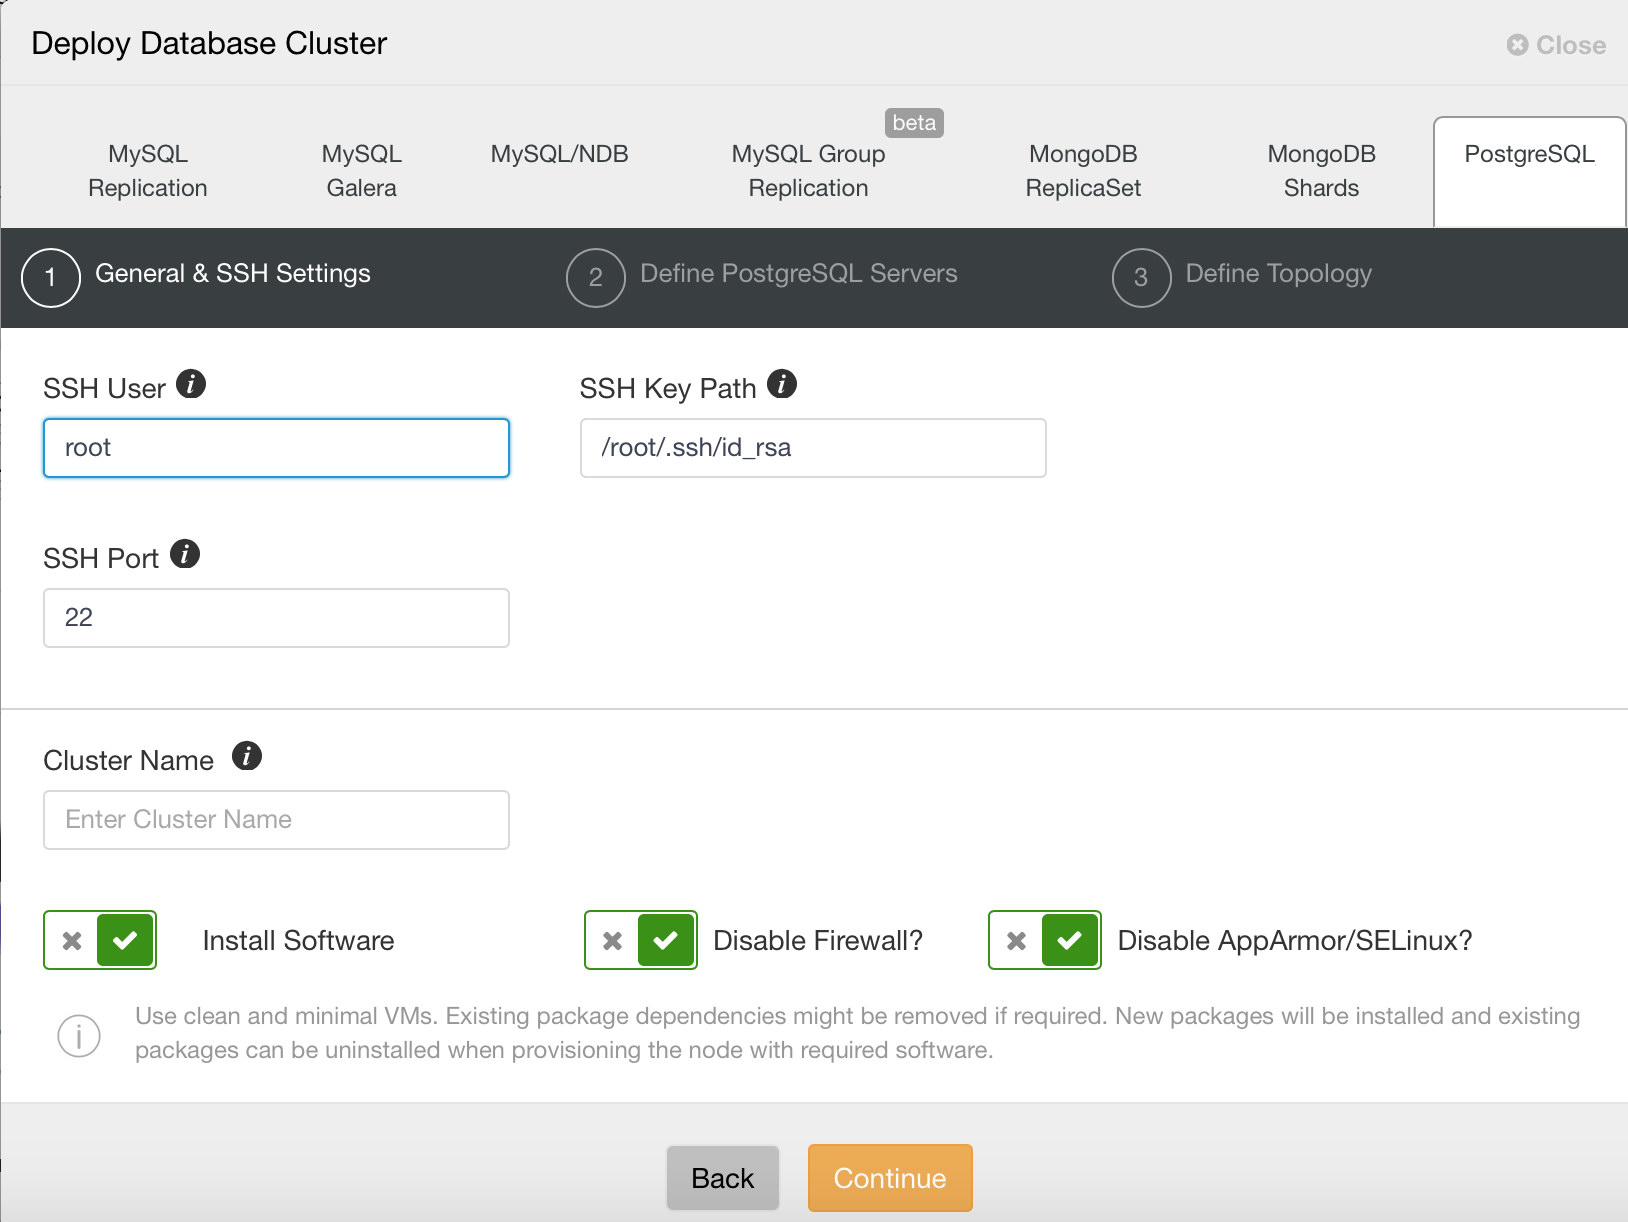
First, you need to define access details, as usual when deploying new clusters using ClusterControl. It requires root or sudo password access to all nodes on which PostgreSQL will be deployed.
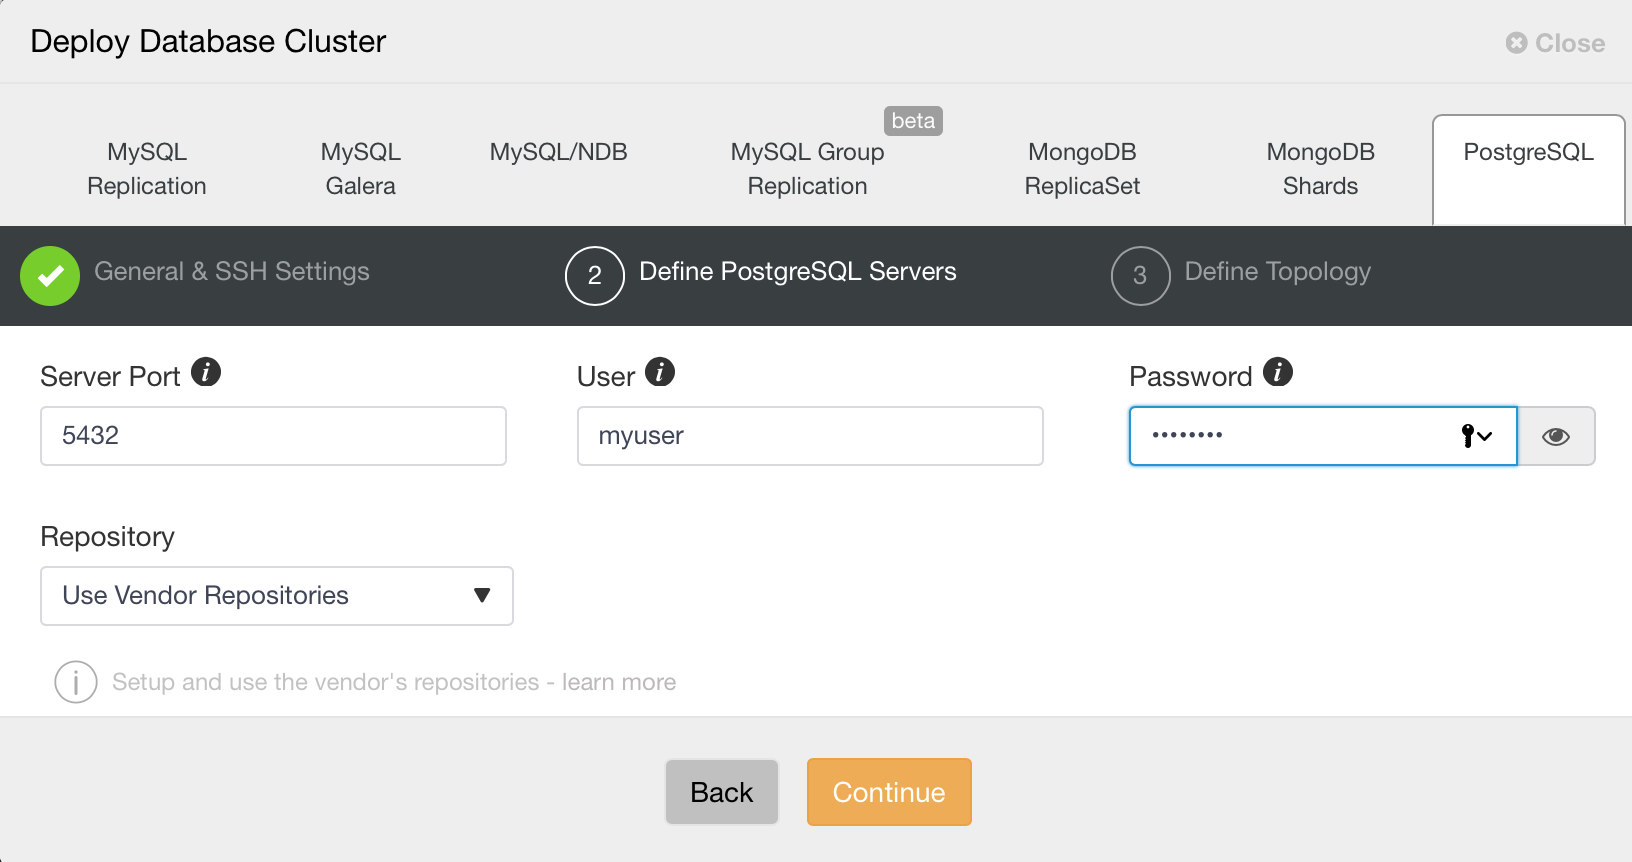
Next, we need to define user and password for the PostgreSQL user.
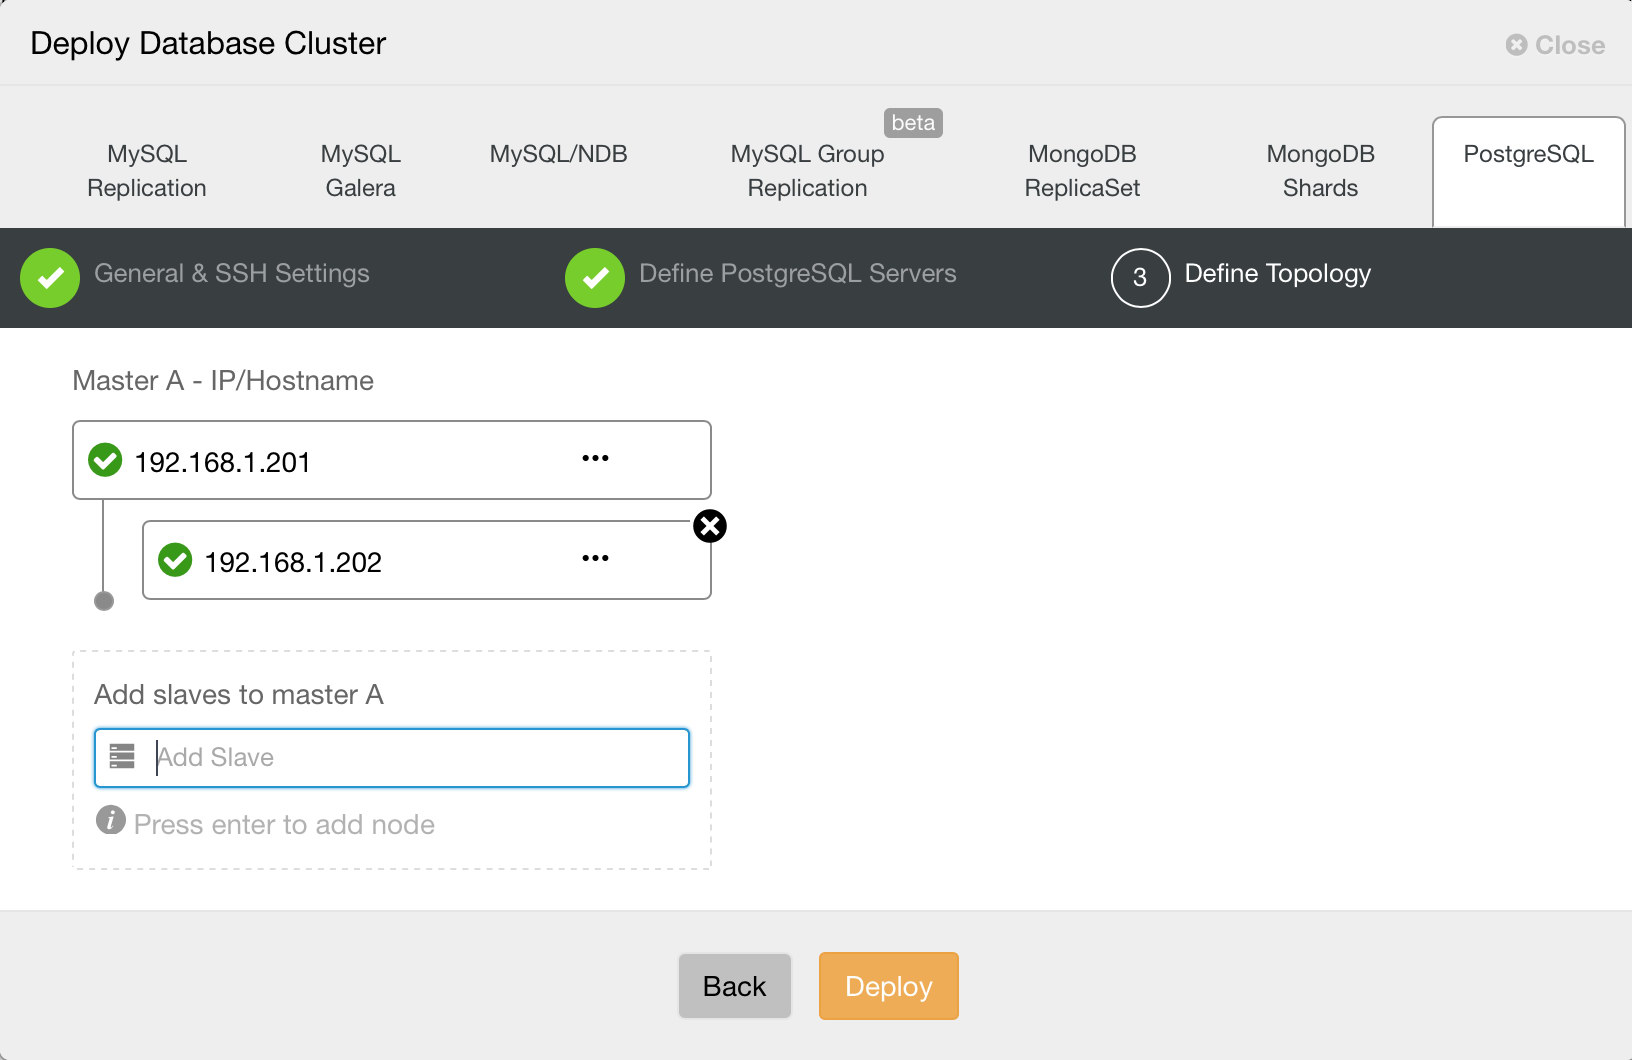
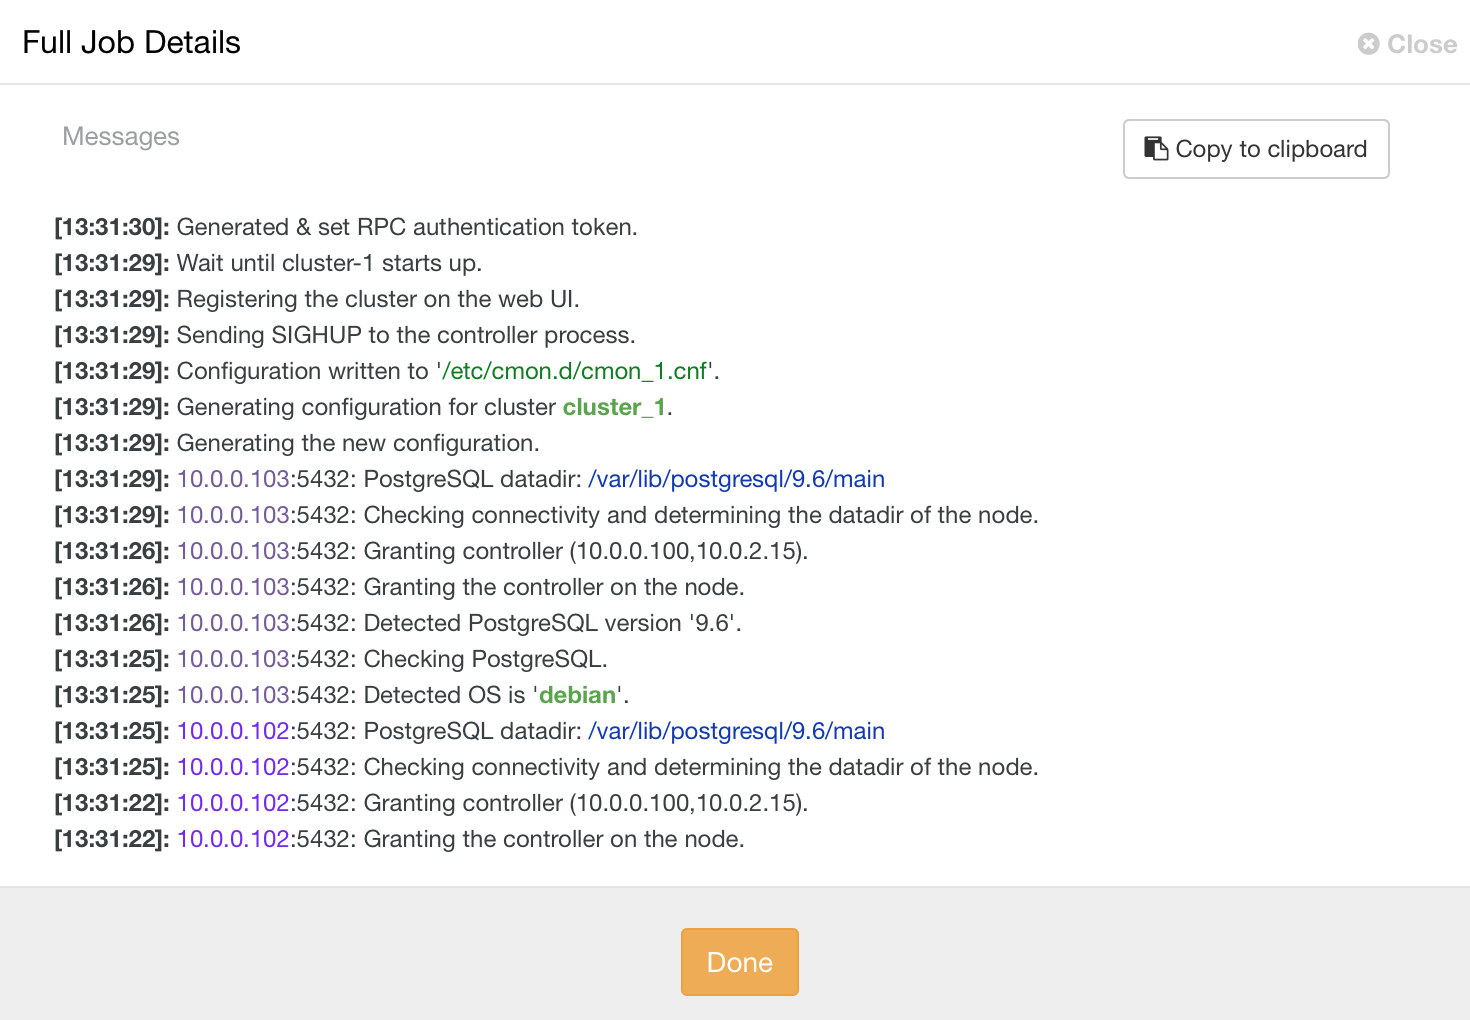
Finally, you want to define topology – which host should be the primary and which hosts should be configured as standby. While you define hosts in the topology, ClusterControl will check if the ssh access works as expected – this lets you catch any connectivity issues early on. That’s pretty much it, it is then a matter of starting the deployment. A job is created in ClusterControl, and you will be able to follow the progress.
Failover Handling
Once the replication setup is deployed, ClusterControl is able to monitor the setup and automatically recover failed servers. It can also orchestrate changes in topology.
First, ClusterControl now supports full failover handling – when a master failure is detected, a list of master candidates is created and one of them is chosen to be the new master. It is possible to have a whitelist of servers to promote to primary, as well as a blacklist of servers that cannot be promoted to primary. The remaining slaves are now slaved off the new primary, and the old primary is not restarted.
ClusterControl intentionally keeps the old primary offline because it may happen that some of the data has not been transferred to the standby servers. In such case, the primary is the only host containing this data and you may want to recover the missing data manually. For those who want to have the failed primary automatically rebuilt, there is an option in the cmon configuration file: replication_auto_rebuild_slave. By default, it’s disabled but when the user enables it, the failed primary will be rebuilt as a slave of the new primary. Of course, if there is any missing data which exists only on the failed primary, that data will be lost.
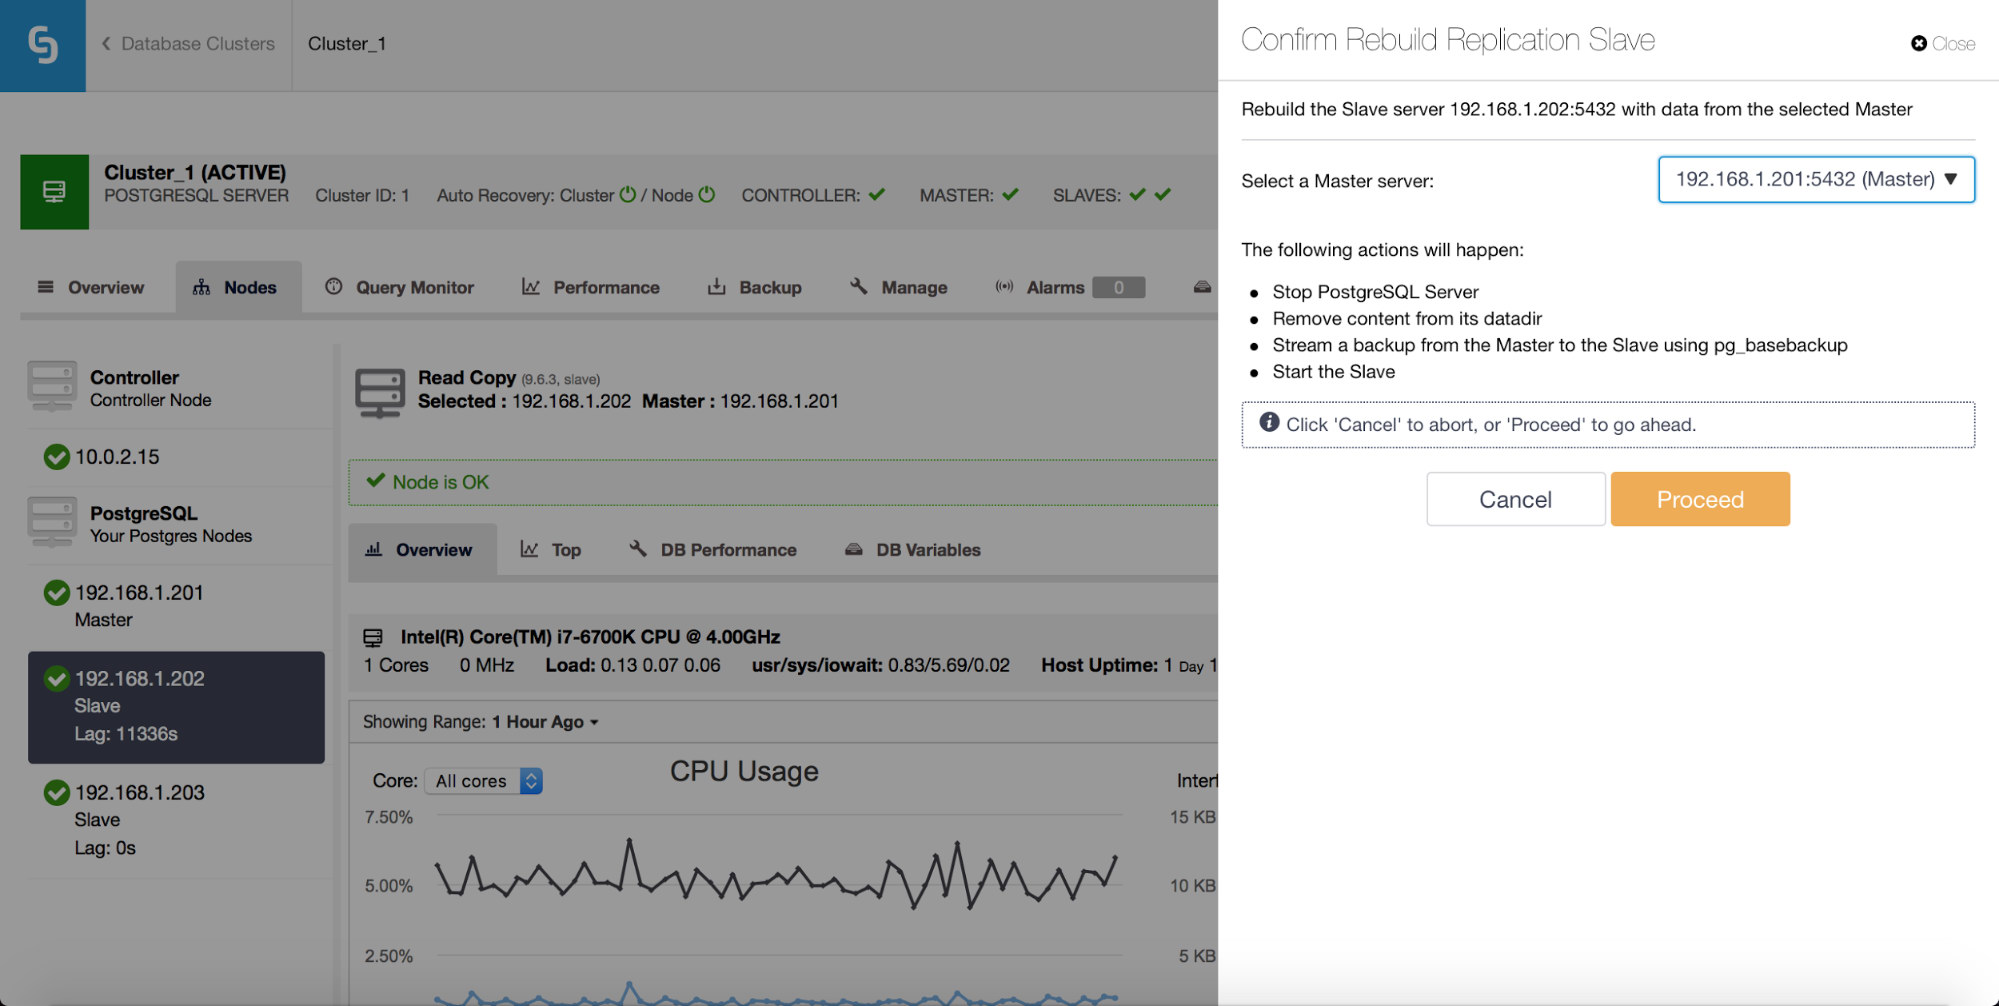
Rebuilding Standby Servers
Another feature is “Rebuild Replication Slave” job which is available for all slaves (or standby servers) in the replication setup. This is to be used for instance when you want to wipe out the data on the standby, and rebuild it again with a fresh copy of data from the primary. It can be useful if a standby server is not able to connect and replicate from the primary for some reason.
Monitoring Queries
Last of the new PostgreSQL features we’d like to discuss is Query Monitor.
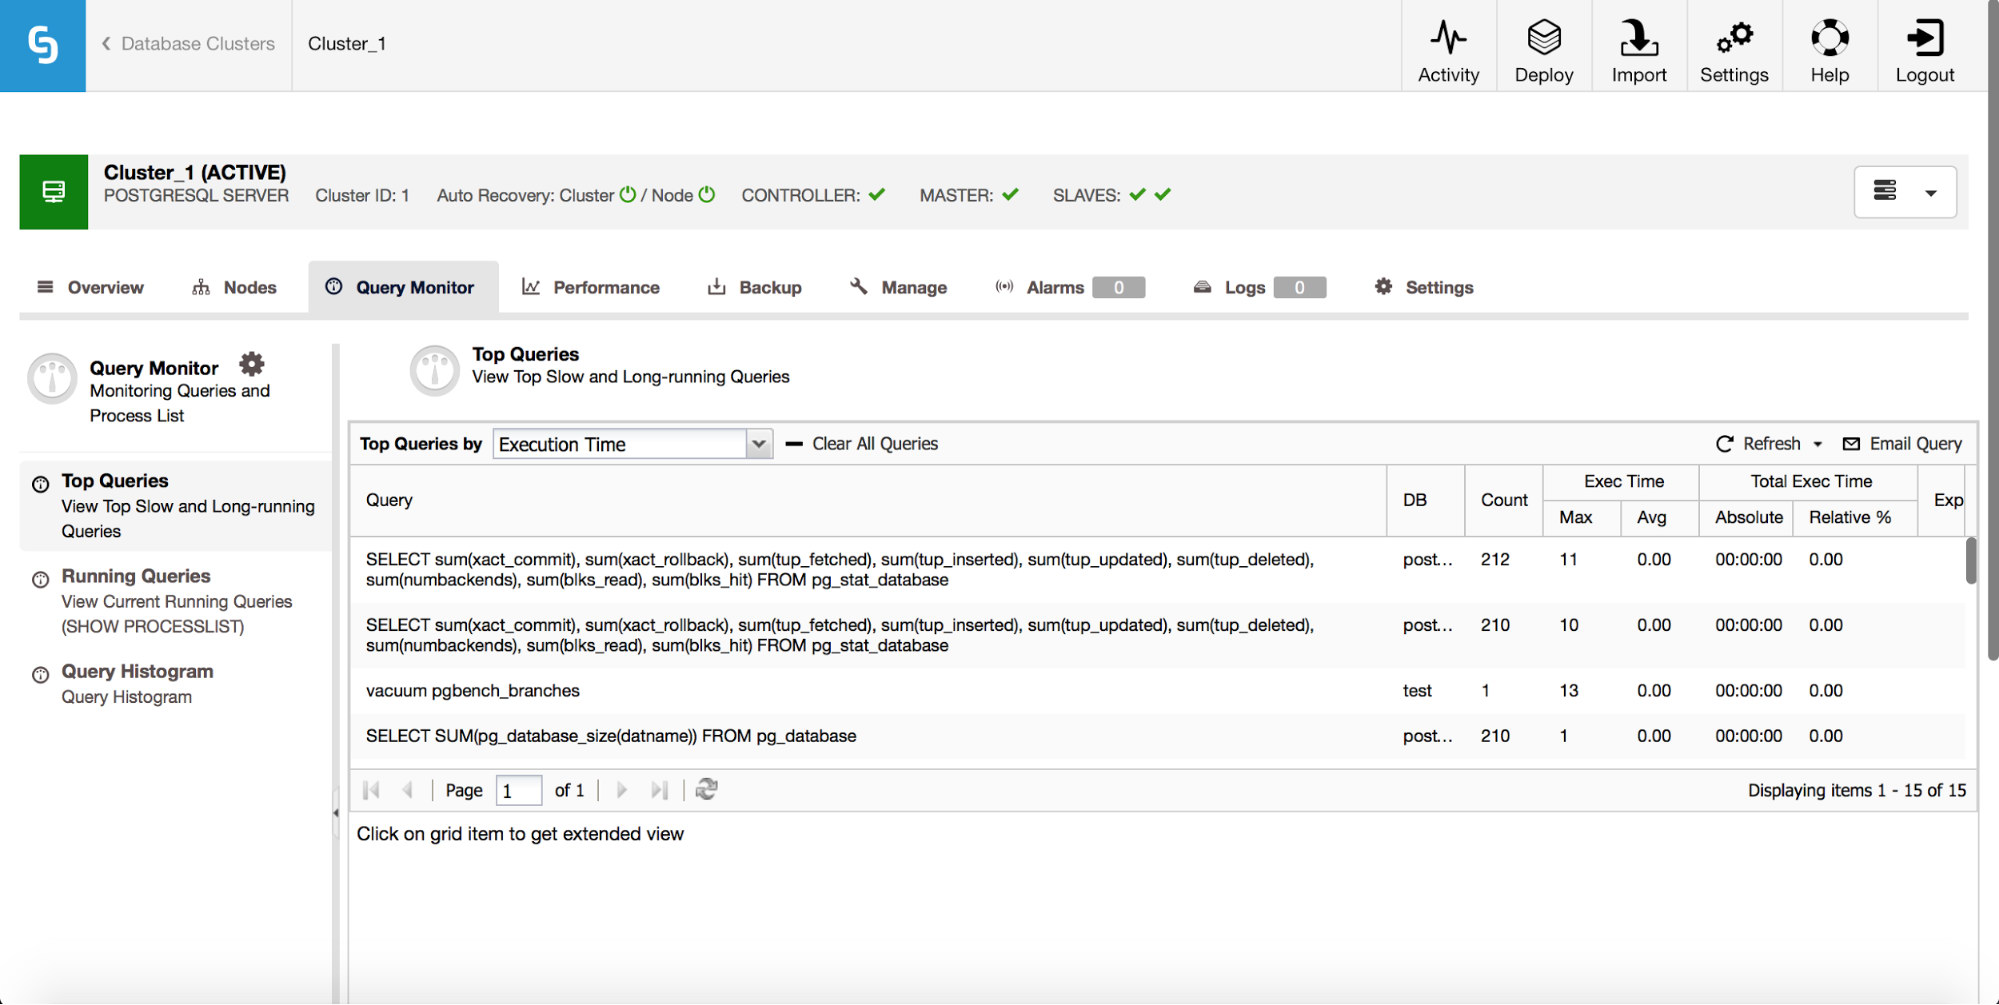
You can now easily check which queries are responsible for the load on your PostgreSQL setup. You’ll see here some basic performance data – how many queries of a given type have been executed? What was their maximum and average execution time? How the total execution time for that query looks like? This should be enough to give you insight into what queries cause the highest load on the system, and on which of them to focus.
So, all in all, ClusterControl 1.4.2 has some good stuff for PostgreSQL users. Do give it a try, and let us know how we’re doing.