blog
NoSQL Battle of the East Coast – Benchmarking MongoDB vs TokuMX Cluster

In this post we will compare performance of MongoDB and TokuMX, a MongoDB performance engine from Tokutek. We will conduct three simple experiments that (almost) anyone without any programming skills can try and reproduce. In this way, we’ll be able to see how both products behave.

Let’s first briefly cover the main differences between the official MongoDB server from 10gen MongoDB, Inc. (which we will refer to as MongoDB from now on) and TokuMX. The MongoDB server uses B-Trees, these have been around for 40 years. TokuMX uses a newer Fractal Tree Indexing technology, and behaves different in a several areas.
Transactions
TokuMX supports transactions with ACID and MVCC properties. Thus, you can make multiple reads and write operations in one transaction. If a read or write would fail in the transaction, the entire transaction is rolled back leaving the data in the state it was in before the transaction was started.
MongoDB also has transaction support, but for each individual operation — writes are atomic, which means you can make 10 writes, and if the 5th write fail, the writes before will not be rollbacked, and the writes following may succeed.
Locking
TokuMX has document-level locking and MongoDB has database-level locking (in relational databases this is like row-level locking vs table-level locking). Document-level locking is better for multi-threaded applications with a mix of read and writes because the locking granularity is on the document. Since MongoDB locks on the database level only one write at a time can be executed on the database (it is an exclusive lock), and no other read or write operation can share this lock. Writes take precedence over readers. What this means for TokuMX is that you don’t have to shard your data in order to scale a concurrent workload. At least, not as early as you would do for MongoDB.
Compaction/Defragmentation
In MongoDB, updates changing the size of the document will cause fragmentation and you need to run compaction and defragmentation procedures. Since compaction is blocking, you have to compact the SECONDARYs first and then make a SECONDARY the PRIMARY, so that the old PRIMARY can be compacted using the compact command. Having to shutdown the PRIMARY in a production system in order to compact it will make the Replica Set unavailable for a short period of time.
TokuMX manages data differently and stores information in Fractal Tree Indexes. Fractal Tree indexes does not get fragmented, so no compaction or index rebuilds are needed. This sounds very promising. Generally, the less you have to touch a running system the better it is.
Memory Management
MongoDB uses memory-mapped files for storing data. The size of the memory mapped files may be larger than what you have in RAM. Writes are written to a journal as often as specified by journalCommitInterval (defaults to 100ms in the test setup used here, but a write can be forced to be immediately written to the journal). Data pages are lazily written to storage and controlled by syncDelay (default 60s). It is of course possible to make MongoDB explicitly fsync the pending writes to disk storage. In any case, the journal is used to recover in the event of a crash. This makes Mongodb crash safe.
In MongoDB, if a document is not available in RAM, then the page must be fetched from disk. This will cause a page fault. If page faults are increasing then performance will suffer. Since hard page faults forces the OS to pull data from disk, and push out pages from RAM to disk in order to make room. The bottom line is that you are in the hands of the merciful (hopefully) Operating System. It decides what should paged in and out.
In TokuMX, Tokutek has stripped out the MongoDB storage code and replaced it with its own storage code that uses Fractal Tree Indexes. Moreover, it allocates a cache. The cache is set to 50% by default of system memory. Exactly how the cache is managed is a bit of a mystery, so it would be great if Tokutek could shed some light here. But there is a clock algorithm, and in essence individual 64KB blocks of a node (4MB on disk) can be cached in RAM. The main point here is that, since TokuMX manages what data should be in the cache then it can make better decisions on what pages should be in RAM and which should be on disk. Moreover, data is checkpointed (default every 60 seconds counted from the last completed checkpoint) from the cache to the data files on disk. When the checkpoint has finished the transaction log (tokulog files in the mongodb datadir) can be cleaned.
There are more differences between TokuMX and MongoDB, but let’s settle with the above and move on to our experiments.
Test System for Benchmark
The test system consisted of:
- 3 servers for application (mongo clients)
- 3 mongos servers
- 3 config servers
- 1 shard (replica set) with 3 shard servers
Config servers and mongos are co-located on three servers. The shard servers run on designated instances.
All instances used in the test reside on Rackspace and have the same specs:
- Ubuntu 12.04 x86_64
- 2GB RAM
- 80GB hard disk
- 4 cores (Quad-Core AMD Opteron(tm) Processor 2374 HE 2200.088MHz)
The instances are not very powerful, but the dataset and experiments are the same for both MongoDB and TokuMX. In a production system, you would probably have more powerful instances and disk subsystem, but data sets are then usually bigger too.
The TokuMX cluster and the MongoDB cluster were created on exactly the same instances.
The experiments we run are very simple and tests very basic primitives:
- Experiment 1 – Insertion of 10M documents from one client into an empty cluster
- Experiment 2 – Concurrency test (read + write) with one to six clients
- Experiment 3 – Read test (exact match) with one to six clients
We never sharded the collection in any of the experiments because we did not want to exercise the mongos or the config servers. We connected the clients directly on the PRIMARY of the replica set.
In addition to ClusterControl, we also deployed MMS agents to compare the monitoring data. For MMS we used a default configuration (as recommended by 10gen MongoDB, Inc.) with the default collection_interval is 56 seconds. The collection interval for ClusterControl was set to 5 seconds for database stats, and 10 seconds for host stats (RAM, CPU, DISK, NET).
Experiment 1a: Insertion of 10M Documents
Insertion of 10M documents from one client. This is not a bulk-loading case (then we should configure differently), but this experiment can be applicable to e.g a click stream or a stream of financial data.
The idea here is to see how MongoDB and TokuMX behave over time. The dataset of 10M records does not fit in RAM.
my_mongodb_0:PRIMARY> db.johan.ensureIndex({x:1})
my_mongodb_0:PRIMARY> function insertData(dbName, colName, num) {    var col = db.getSiblingDB(dbName).getCollection(colName);  print(Math.round(new Date().getTime()/1000));   for (i = 0; i < num; i++) {     data=createRandomData(200); col.insert({x:i, y:data});   }     print(Math.round(new Date().getTime()/1000)); print(col.count()); }
my_mongodb_0:PRIMARY> insertData('test','johan',10000000)
The storage required for the 10M documents are as follows:
TokuMX (using default compression):
$ du -sh /var/lib/mongodb/
4.7G	/var/lib/mongodb/
MongoDB:
$ du -sh /var/lib/mongodb/
9.6G	/var/lib/mongodb/
MongoDB
Average: 11600 inserts per second.

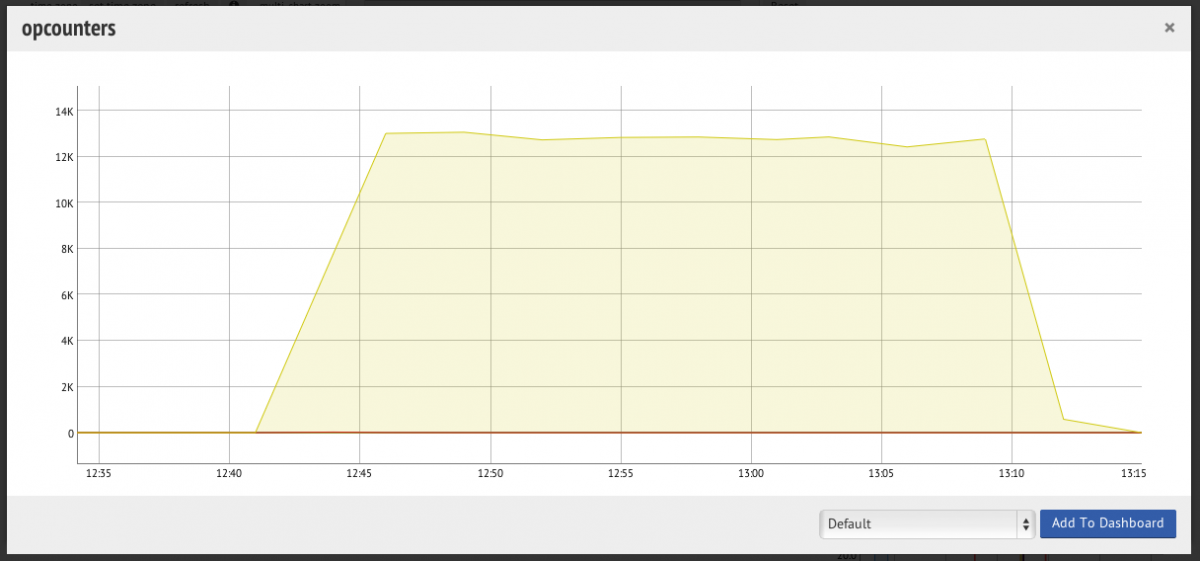
When looking at it from MMS the opcounters graph looks like the following:
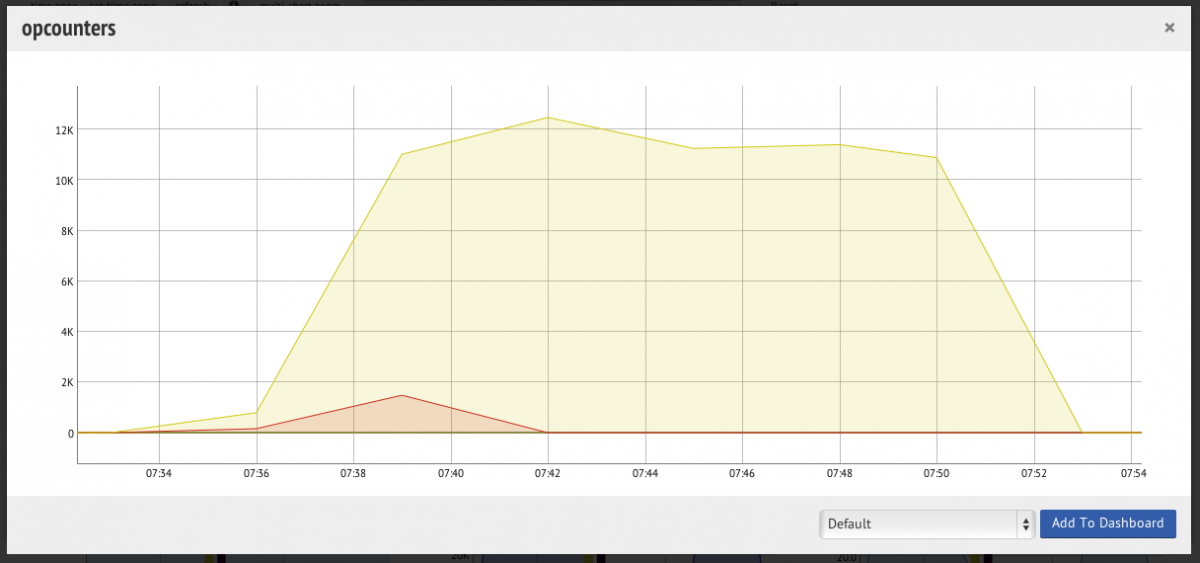
Thus resolution is important to spot problems. The MMS agent is using the default settings (as recommended) and from this perspective everything looks great.
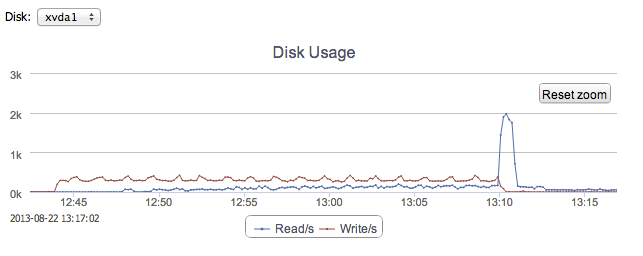
Looking at the opcounters graph from ClusterControl there are a few sharp drops visible. Look at e.g 07:40 and map it to 07:40 on the following graph showing disk stats:
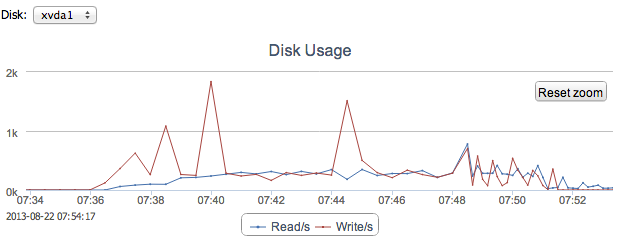
From time to time there are huge spikes in disk writes. This causes IOWAIT to increase and USR CPU time to go down. Most likely it is the Linux VM flushing the dirty pages in RAM to disk.
TokuMX
For all the tests we have used default values for pageSize and compression=zlib.
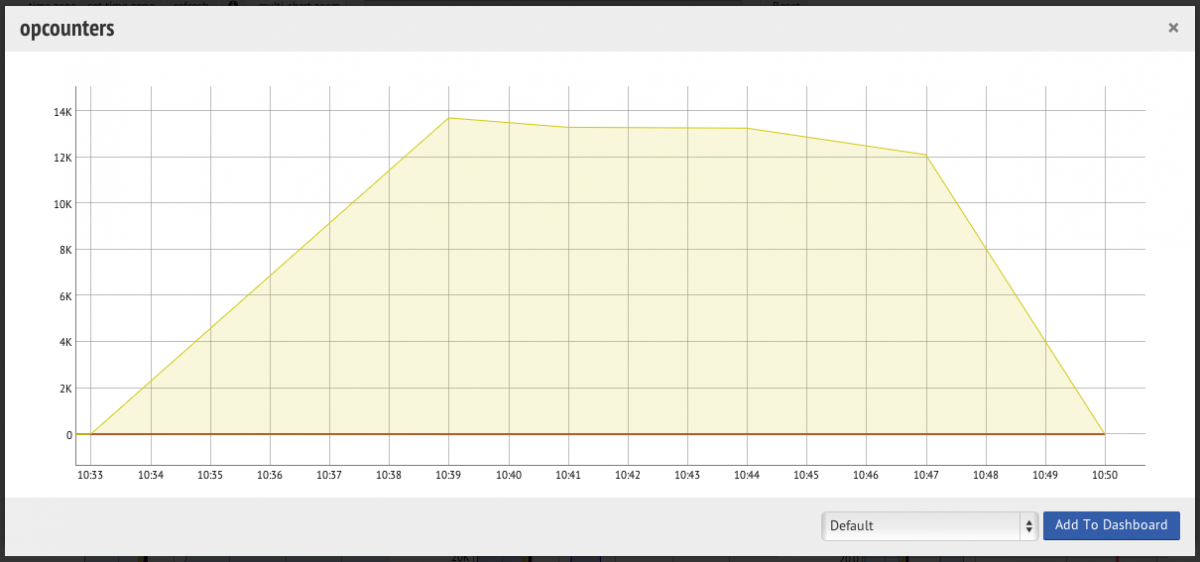
Average: 13422 inserts per second.

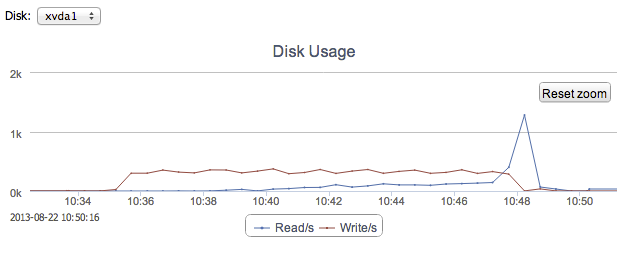
Disk writes during the experiment are stable during the experiment. At the end there is a peak of disk reads and cache evictions which comes from db.collection.count().

And finally opcounters as seen by MMS:
Experiment 1b: Insertion of 20M Documents
MongoDB
Test failed – The SECONDARYs started to lose heartbeats, and the system was unstable.
Thu Aug 22 12:10:23.101 [rsHealthPoll] replset info 10.178.134.223:27018 heartbeat failed, retrying
Thu Aug 22 12:10:23.101 [conn200] query local.oplog.rs query: { ts: { $gte: Timestamp 1377172513000|11630 } } cursorid:11842265410064867 ntoreturn:0 ntoskip:0 nscanned:102 keyUpdates:0 numYields: 20019 locks(micros) r:43741975 nreturned:101 reslen:31128 102082ms
Thu Aug 22 12:10:23.105 [conn203] SocketException handling request, closing client connection: 9001 socket exception [2] server [10.178.134.223:60943]
Thu Aug 22 12:10:23.107 [conn200] SocketException handling request, closing client connection: 9001 socket exception [2] server [10.178.134.223:60940]
Thu Aug 22 12:10:23.127 [conn204] query local.oplog.rs query: { ts: { $gte: Timestamp 1377172513000|11630 } } cursorid:11842351062395209 ntoreturn:0 ntoskip:0 nscanned:102 keyUpdates:0 numYields: 19479 locks(micros) r:29105064 nreturned:101 reslen:1737 72012ms
Thu Aug 22 12:10:24.109 [rsHealthPoll] DBClientCursor::init call() failed
Thu Aug 22 12:10:24.109 [rsHealthPoll] replSet info 10.178.134.223:27018 is down (or slow to respond):
Thu Aug 22 12:10:24.109 [rsHealthPoll] replSet member 10.178.134.223:27018 is now in state DOWN
Thu Aug 22 12:20:26.441 [rsBackgroundSync] replSet error RS102 too stale to catch up, at least from 10.178.0.69:27018
Thu Aug 22 12:20:26.441 [rsBackgroundSync] replSet our last optime : Aug 22 12:00:20 5215fd54:121a
Thu Aug 22 12:20:26.441 [rsBackgroundSync] replSet oldest at 10.178.0.69:27018 : Aug 22 12:10:14 5215ffa6:173d
Thu Aug 22 12:20:26.441 [rsBackgroundSync] replSet See http://dochub.mongodb.org/core/resyncingaverystalereplicasetmember
Thu Aug 22 12:20:26.441 [rsBackgroundSync] replSet error RS102 too stale to catch upThe SECONDARYs then changed state to RECOVERING. This happened during three test runs so we gave up.
TokuMX

Average: 12812 inserts per second.

Experiment 2: Random Read + Update Test (Concurrency)
In this test we want to look at concurrency.
Restarted with an empty cluster. First we insert 1M records, enough so we are sure the data set fits in RAM (we don’t want to test the disks, they are not very fast and we would soon become IO bound).
Then we find a random record and update it which means there are 50% reads and 50% writes.
The read and write are not executed as one transaction in the case of TokuMX.
my_mongodb_0:PRIMARY> function readAndUpdate(dbName, colName, no_recs, iter) {    var col = db.getSiblingDB(dbName).getCollection(colName);  var doc=null; print(Math.round(new Date().getTime()/1000));   for (i = 0; i < iter; i++) { rand=Math.floor((Math.random()*no_recs)+1);   doc=col.findOne({x:rand},{y:1}); if(doc==null) continue; y=doc.y; new_y=y+rand;
col.update({x:rand}, { $set: {y: new_y } });   }     print(Math.round(new Date().getTime()/1000));  }
my_mongodb_0:PRIMARY> readAndUpdate('test','johan',1000000, 10000000)
MongoDB
Max throughput: 3910 updates per second.

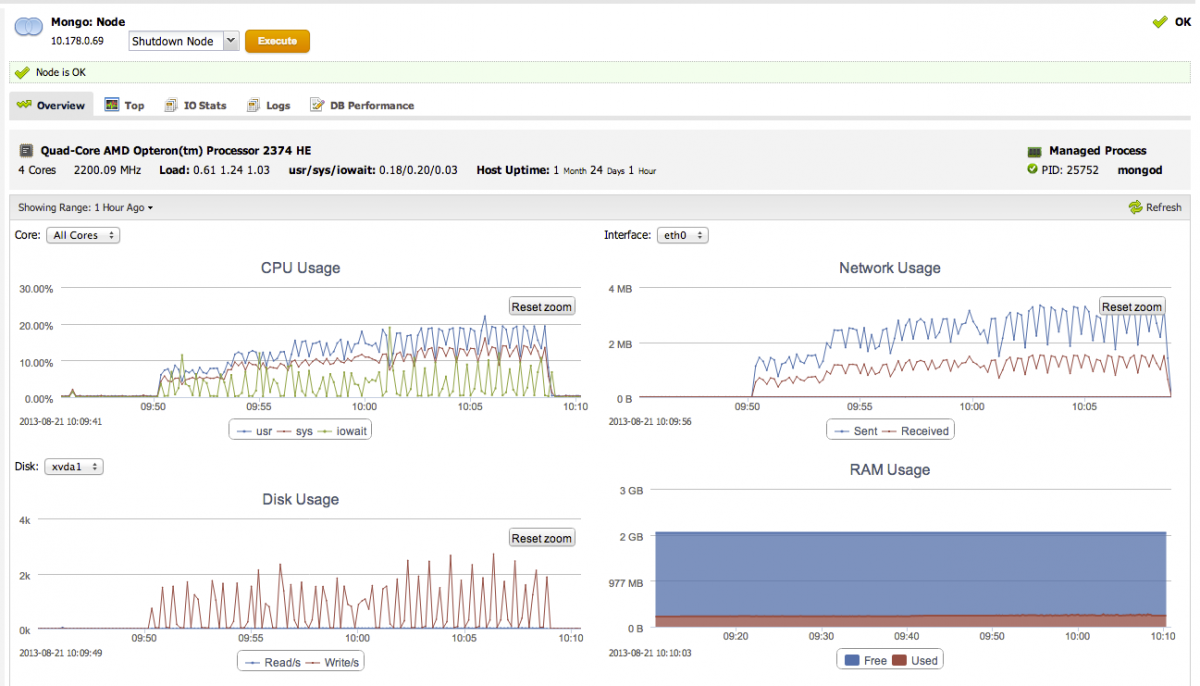
Sudden performance drops are coming from filesystem writes, where IOWAIT shoots up, USR goes down, and disk writes goes up (as seen on the PRIMARY node):
TokuMX
Max throughput : 4233 updates per second.

Please note that the ‘updates’ in the graph above completely shadows the ‘queries’.
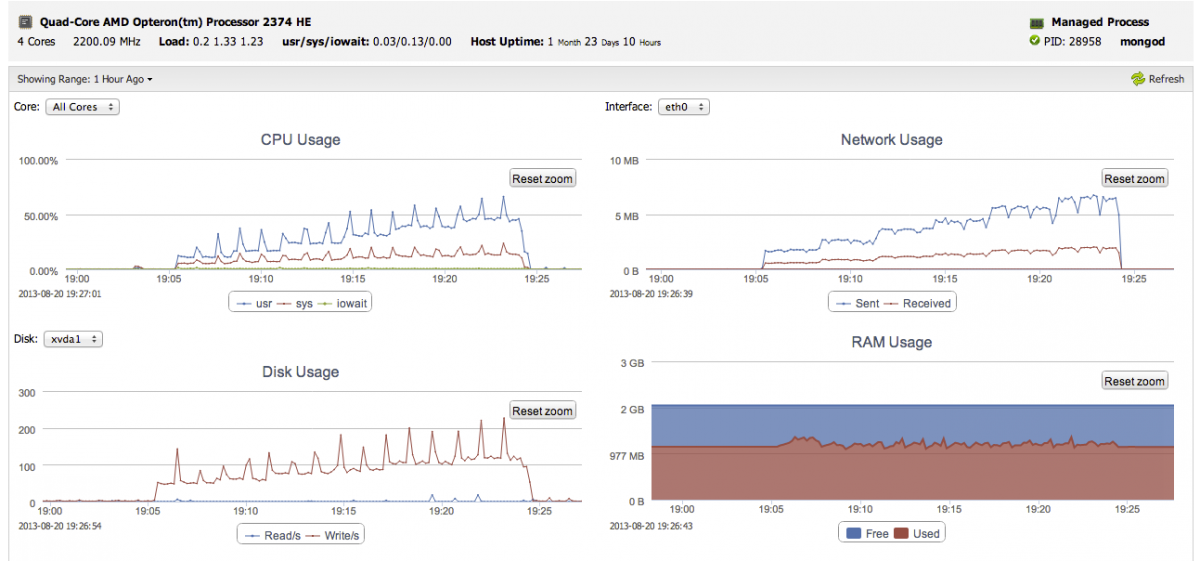
Also if you look carefully, you can see the graph drops every minute. These drops are caused by Checkpointing.
With five and six clients the throughput starts to fluctuate a bit. Luckily, TokuMX provides counters to understand what is going on. In the picture below we are graphing Cache Evictions, Cache Misses, and Cache Prefetches. A Cache Miss means TokuMX has to go to disk to fetch the data. A Cache Eviction means that a page is expired from the Cache. In this case, a faster disk and a bigger Cache would have been useful.

Clearly, letting the document level locking and having the database decide when to write to disk, as opposed to a mixture of the OS flushing the FS cache (and MongoDB syncing every 60 seconds), gives more predictable performance with TokuMX.
Experiment 3: Read Test
Same data set as in Experiment 2. Starting up to six clients.
MongoDB
Max throughput: 8516 reads per second.

TokuMX
Max throughput: 8104 reads per second.

Appendix: Configuration
MongoDB – replica set members configuration
dbpath = /var/lib/mongodb
port = 27018
logappend = true
fork=true
replSet = my_mongodb_0
noauth = true
nssize=16
directoryperdb=false
cpu = false
nohttpinterface = true
quiet = false
journal=true
journalCommitInterval=100
syncdelay=60
TokuMX – replica set members configuration
dbpath = /var/lib/mongodb
port = 27018
logappend = true
cacheSize = 1073741824
logFlushPeriod = 100
directio = off
cleanerPeriod = 2
cleanerIterations = 5
fsRedzone = 5
lockTimeout = 4000
expireOplogDays = 5
fork=true
replSet = my_mongodb_0
noauth = true
nssize=16
cpu = false
nohttpinterface = true
quiet = false
syncdelay=60


