blog
Troubleshooting MySQL Replication: Part One

Replication is one of the most common ways to achieve high availability for MySQL and MariaDB. It has become much more robust with the addition of GTIDs, and is thoroughly tested by thousands and thousands of users. MySQL Replication is not a ‘set and forget’ property though, it needs to be monitored for potential issues and maintained so it stays in good shape. In this blog post, we’d like to share some tips and tricks on how to maintain, troubleshoot and fix issues with MySQL replication.
How to Determine if MySQL Replication is in a Good Shape?
This is hands down the most important skill that anyone taking care of a MySQL replication setup has to possess. Let’s take a look at where to look for information about the state of replication. There is a slight difference between MySQL and MariaDB and we will discuss this as well.
SHOW SLAVE STATUS
This is hands down the most common method of checking the state of replication on a slave host – it’s with us since always and it’s usually the first place where we go if we expect that there is some issue with replication.
mysql> SHOW SLAVE STATUSG
*************************** 1. row ***************************
               Slave_IO_State: Waiting for master to send event
                  Master_Host: 10.0.0.101
                  Master_User: rpl_user
                  Master_Port: 3306
                Connect_Retry: 10
              Master_Log_File: binlog.000002
          Read_Master_Log_Pos: 767658564
               Relay_Log_File: relay-bin.000002
                Relay_Log_Pos: 405
        Relay_Master_Log_File: binlog.000002
             Slave_IO_Running: Yes
            Slave_SQL_Running: Yes
              Replicate_Do_DB:
          Replicate_Ignore_DB:
           Replicate_Do_Table:
       Replicate_Ignore_Table:
      Replicate_Wild_Do_Table:
  Replicate_Wild_Ignore_Table:
                   Last_Errno: 0
                   Last_Error:
                 Skip_Counter: 0
          Exec_Master_Log_Pos: 767658564
              Relay_Log_Space: 606
              Until_Condition: None
               Until_Log_File:
                Until_Log_Pos: 0
           Master_SSL_Allowed: No
           Master_SSL_CA_File:
           Master_SSL_CA_Path:
              Master_SSL_Cert:
            Master_SSL_Cipher:
               Master_SSL_Key:
        Seconds_Behind_Master: 0
Master_SSL_Verify_Server_Cert: No
                Last_IO_Errno: 0
                Last_IO_Error:
               Last_SQL_Errno: 0
               Last_SQL_Error:
  Replicate_Ignore_Server_Ids:
             Master_Server_Id: 1
                  Master_UUID: 5d1e2227-07c6-11e7-8123-080027495a77
             Master_Info_File: mysql.slave_master_info
                    SQL_Delay: 0
          SQL_Remaining_Delay: NULL
      Slave_SQL_Running_State: Slave has read all relay log; waiting for more updates
           Master_Retry_Count: 86400
                  Master_Bind:
      Last_IO_Error_Timestamp:
     Last_SQL_Error_Timestamp:
               Master_SSL_Crl:
           Master_SSL_Crlpath:
           Retrieved_Gtid_Set:
            Executed_Gtid_Set: 5d1e2227-07c6-11e7-8123-080027495a77:1-394233
                Auto_Position: 1
         Replicate_Rewrite_DB:
                 Channel_Name:
           Master_TLS_Version:
1 row in set (0.00 sec)
Some details may differ between MySQL and MariaDB but the majority of the content will look the same. Changes will be visible in the GTID section as MySQL and MariaDB do it in a different way. From SHOW SLAVE STATUS, you can derive some pieces of information – which master is used, which user and which port is used to connect to the master. We have some data about the current binary log position (not that important anymore as we can use GTID and forget about binlogs) and the state of SQL and I/O replication threads. Then you can see if and how filtering is configured. You can also find some information about errors, replication lag, SSL settings and GTID. The example above comes from MySQL 5.7 slave which is in a healthy state. Let’s take a look at some example where replication is broken.
MariaDB [test]> show slave statusG
*************************** 1. row ***************************
               Slave_IO_State: Waiting for master to send event
                  Master_Host: 10.0.0.104
                  Master_User: rpl_user
                  Master_Port: 3306
                Connect_Retry: 10
              Master_Log_File: binlog.000003
          Read_Master_Log_Pos: 636
               Relay_Log_File: relay-bin.000002
                Relay_Log_Pos: 765
        Relay_Master_Log_File: binlog.000003
             Slave_IO_Running: Yes
            Slave_SQL_Running: No
              Replicate_Do_DB:
          Replicate_Ignore_DB:
           Replicate_Do_Table:
       Replicate_Ignore_Table:
      Replicate_Wild_Do_Table:
  Replicate_Wild_Ignore_Table:
                   Last_Errno: 1032
                   Last_Error: Could not execute Update_rows_v1 event on table test.tab; Can't find record in 'tab', Error_code: 1032; handler error HA_ERR_KEY_NOT_FOUND; the event's master log binlog.000003, end_log_pos 609
                 Skip_Counter: 0
          Exec_Master_Log_Pos: 480
              Relay_Log_Space: 1213
              Until_Condition: None
               Until_Log_File:
                Until_Log_Pos: 0
           Master_SSL_Allowed: No
           Master_SSL_CA_File:
           Master_SSL_CA_Path:
              Master_SSL_Cert:
            Master_SSL_Cipher:
               Master_SSL_Key:
        Seconds_Behind_Master: NULL
Master_SSL_Verify_Server_Cert: No
                Last_IO_Errno: 0
                Last_IO_Error:
               Last_SQL_Errno: 1032
               Last_SQL_Error: Could not execute Update_rows_v1 event on table test.tab; Can't find record in 'tab', Error_code: 1032; handler error HA_ERR_KEY_NOT_FOUND; the event's master log binlog.000003, end_log_pos 609
  Replicate_Ignore_Server_Ids:
             Master_Server_Id: 1
               Master_SSL_Crl:
           Master_SSL_Crlpath:
                   Using_Gtid: Slave_Pos
                  Gtid_IO_Pos: 0-1-73243
      Replicate_Do_Domain_Ids:
  Replicate_Ignore_Domain_Ids:
                Parallel_Mode: conservative
1 row in set (0.00 sec)
This sample is taken from MariaDB 10.1, you can see changes at the bottom of the output to make it work with MariaDB GTID’s. What’s important for us is the error – you can see that something is not right in the SQL thread:
Last_SQL_Error: Could not execute Update_rows_v1 event on table test.tab; Can't find record in 'tab', Error_code: 1032; handler error HA_ERR_KEY_NOT_FOUND; the event's master log binlog.000003, end_log_pos 609We will discuss this particular problem later, for now it’s enough that you will see how you can check if there are any errors in the replication using SHOW SLAVE STATUS.
Another important information that comes from SHOW SLAVE STATUS is – how badly our slave lags. You can check it in “Seconds_Behind_Master” column. This metric is especially important to track if you know your application to be sensitive when it comes to stale reads.
In ClusterControl you can track this data in the “Overview” section:
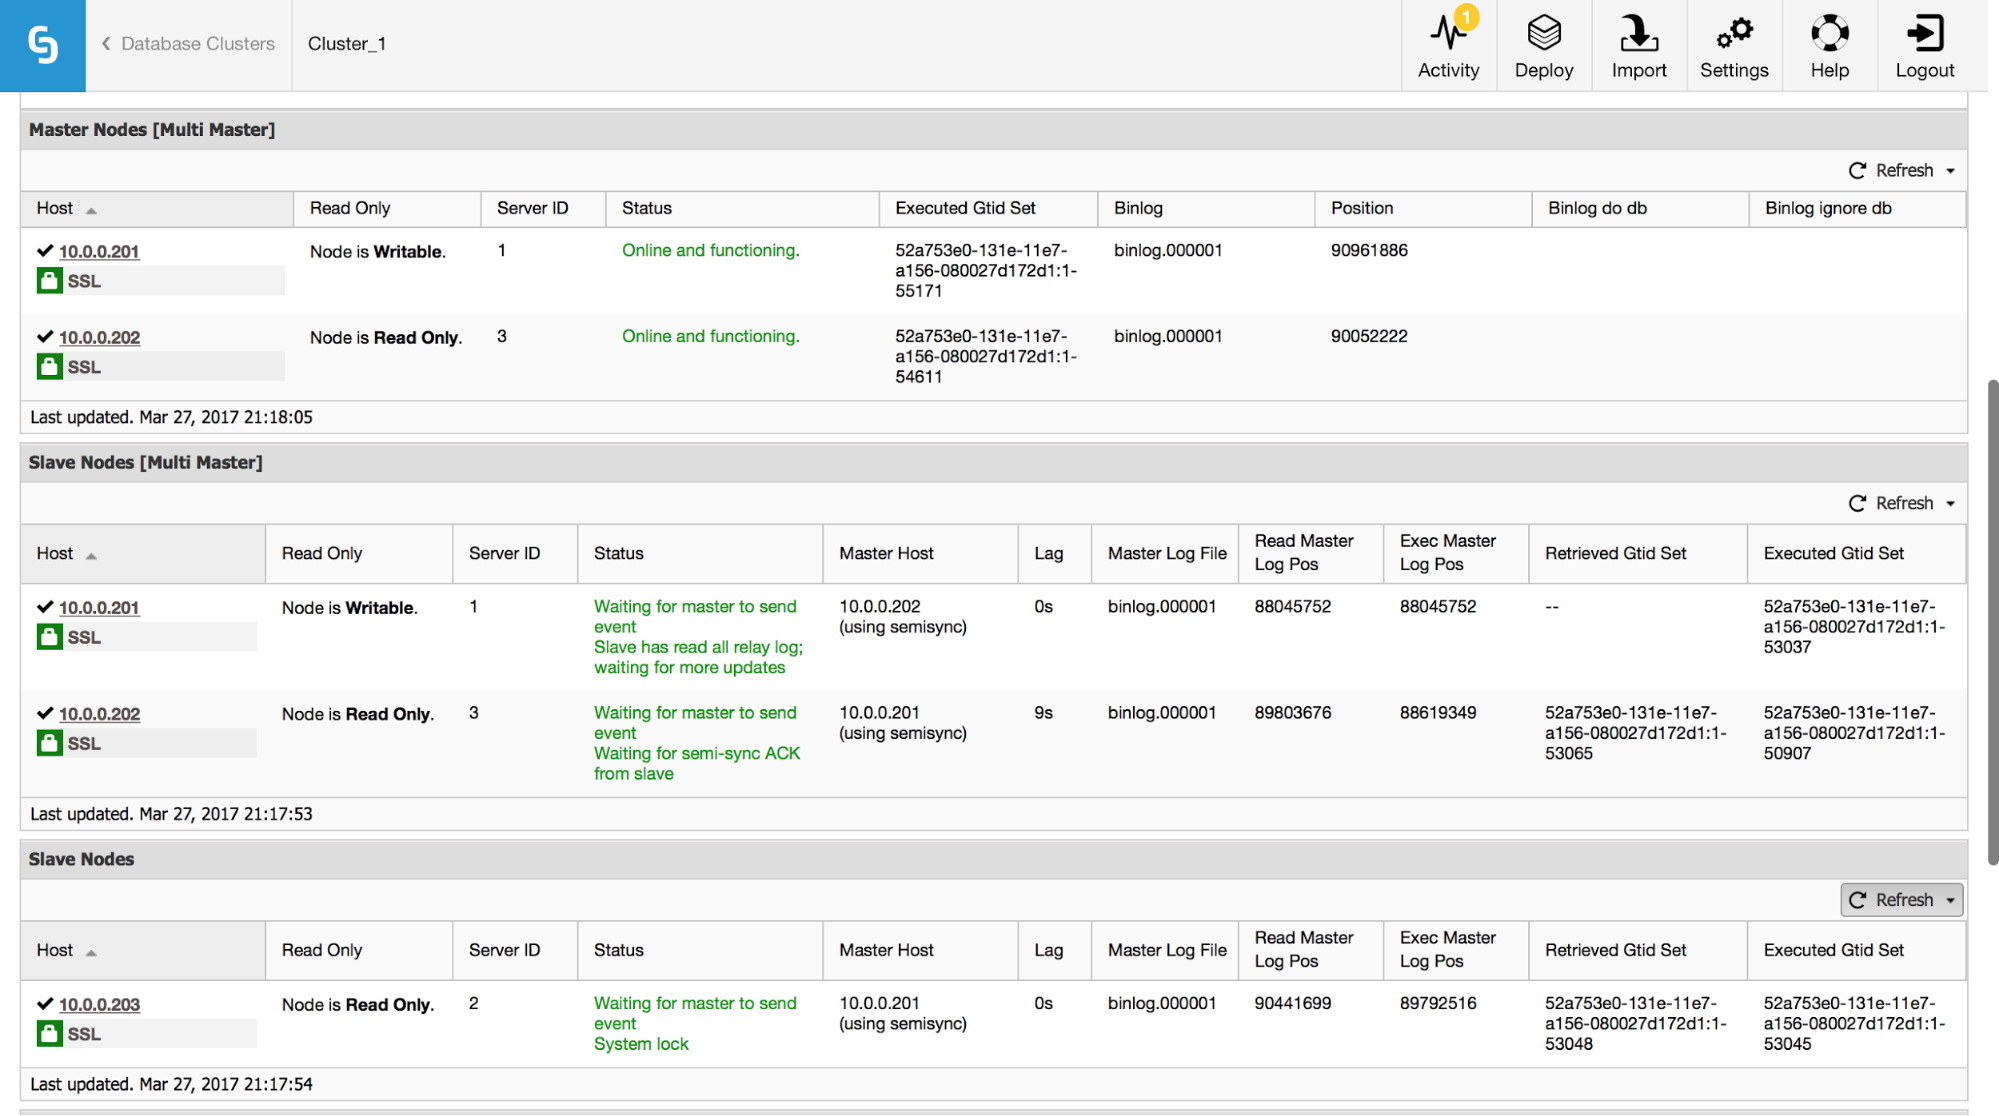
We made visible all of the most important pieces of information from SHOW SLAVE STATUS command. You can check the status of the replication, who is master, if there is a replication lag or not, binary log positions. You can also find retrieved and executed GTID’s.
Performance Schema
Another place you can look for the information about replication is the performance_schema. This applies only to Oracle’s MySQL 5.7 – earlier versions and MariaDB don’t collect this data.
mysql> SHOW TABLES FROM performance_schema LIKE 'replication%';
+---------------------------------------------+
| Tables_in_performance_schema (replication%) |
+---------------------------------------------+
| replication_applier_configuration           |
| replication_applier_status                  |
| replication_applier_status_by_coordinator   |
| replication_applier_status_by_worker        |
| replication_connection_configuration        |
| replication_connection_status               |
| replication_group_member_stats              |
| replication_group_members                   |
+---------------------------------------------+
8 rows in set (0.00 sec)
Below you can find some examples of data available in some of those tables.
mysql> select * from replication_connection_statusG
*************************** 1. row ***************************
             CHANNEL_NAME:
               GROUP_NAME:
              SOURCE_UUID: 5d1e2227-07c6-11e7-8123-080027495a77
                THREAD_ID: 32
            SERVICE_STATE: ON
COUNT_RECEIVED_HEARTBEATS: 1
 LAST_HEARTBEAT_TIMESTAMP: 2017-03-17 19:41:34
 RECEIVED_TRANSACTION_SET: 5d1e2227-07c6-11e7-8123-080027495a77:715599-724966
        LAST_ERROR_NUMBER: 0
       LAST_ERROR_MESSAGE:
     LAST_ERROR_TIMESTAMP: 0000-00-00 00:00:00
1 row in set (0.00 sec)
mysql> select * from replication_applier_status_by_workerG
*************************** 1. row ***************************
CHANNEL_NAME:
WORKER_ID: 0
THREAD_ID: 31
SERVICE_STATE: ON
LAST_SEEN_TRANSACTION: 5d1e2227-07c6-11e7-8123-080027495a77:726086
LAST_ERROR_NUMBER: 0
LAST_ERROR_MESSAGE:
LAST_ERROR_TIMESTAMP: 0000-00-00 00:00:00
1 row in set (0.00 sec)As you can see, we can verify the state of the replication, last error, received transaction set and some more data. What’s important – if you enabled multi-threaded replication, in replication_applier_status_by_worker table, you will see the state of every single worker – this helps you understand the state of replication for each of the worker threads.
Replication Lag
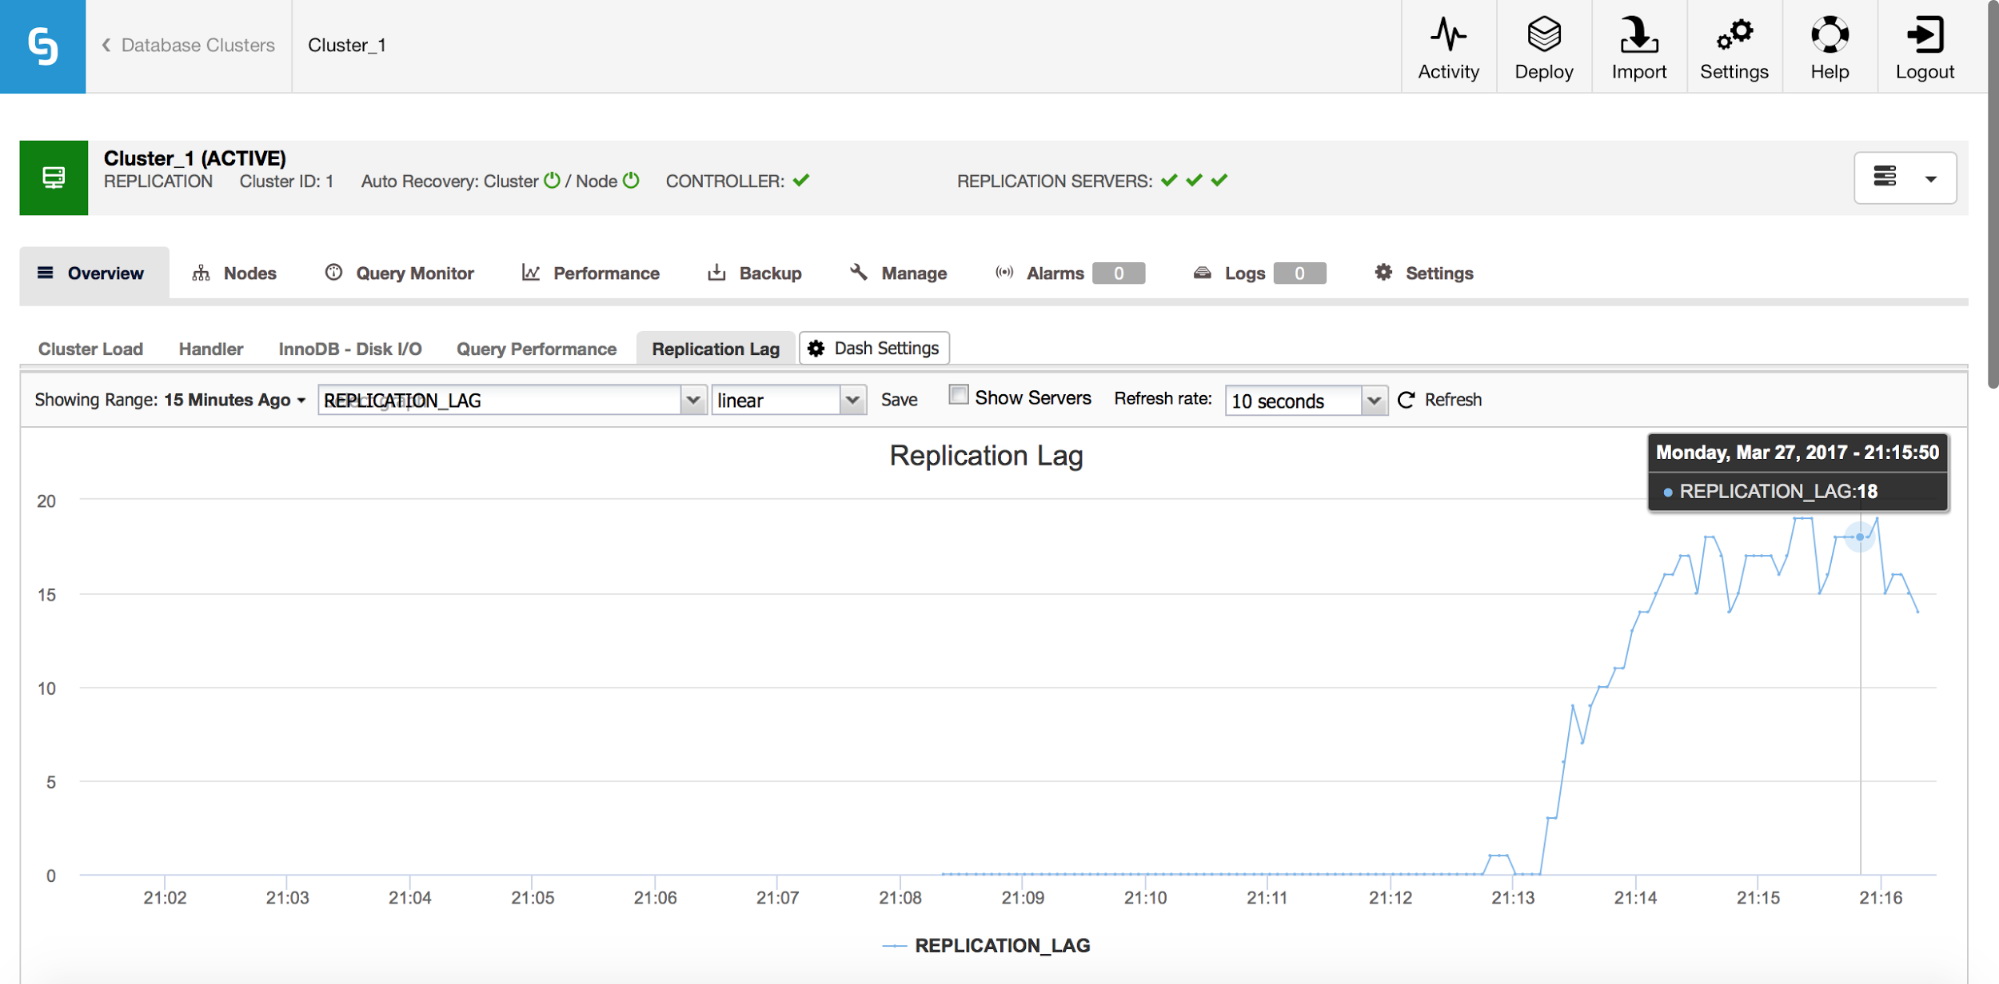
Lag is definitely one of the most common problems you’ll be facing when working with MySQL replication. Replication lag shows up when one of the slaves is unable to keep up with the amount of write operations performed by the master. Reasons could be different – different hardware configuration, heavier load on the slave, high degree of write parallelization on master which has to be serialized (when you use single thread for the replication) or the writes cannot be parallelized to the same extent as it has been on the master (when you use multi-threaded replication).
How to Detect it?
There are couple of methods to detect the replication lag. First of all, you may check “Seconds_Behind_Master” in the SHOW SLAVE STATUS output – it will tell you if the slave is lagging or not. It works well in most of the cases but in more complex topologies, when you use intermediate masters, on hosts somewhere low in the replication chain, it may be not precise. Another, better, solution is to rely on external tools like pt-heartbeat. Idea is simple – a table is created with, amongst others, a timestamp column. This column is updated on the master at regular intervals. On a slave, you can then compare the timestamp from that column with current time – it will tell you how far behind the slave is.
Regardless of the way you calculate the lag, make sure your hosts are in sync time-wise. Use ntpd or other means of time syncing – if there is a time drift, you will see “false” lag on your slaves.
How to Reduce Lag?
This is not an easy question to answer. In short, it depends on what is causing the lag, and what became a bottleneck. There are two typical patterns – slave is I/O bound, which means that its I/O subsystem can’t cope with amount of write and read operations. Second – slave is CPU-bound, which means that replication thread uses all CPU it can (one thread can use only one CPU core) and it’s still not enough to handle all write operations.
When CPU is a bottleneck, the solution can be as simple as to use multi-threaded replication. Increase the number of working threads to allow higher parallelization. It is not always possible though – in such case you may want to play a bit with group commit variables (for both MySQL and MariaDB) to delay commits for a slight period of time (we are talking about milliseconds here) and, in this way, increase parallelization of commits.
If the problem is in the I/O, the problem is a bit harder to solve. Of course, you should review your InnoDB I/O settings – maybe there is room for improvements. If my.cnf tuning won’t help, you don’t have too many options – improve your queries (wherever it’s possible) or upgrade your I/O subsystem to something more capable.
Most of the proxies (for example, all proxies which can be deployed from ClusterControl: ProxySQL, HAProxy and MaxScale) give you a possibility to remove a slave out of rotation if replication lag crosses some predefined threshold. This is by no means a method to reduce lag but it can be helpful to avoid stale reads and, as a side effect, to reduce the load on a slave which should help it to catch up.
Of course, query tuning can be a solution in both cases – it’s always good to improve queries which are CPU or I/O heavy.
Errant Transactions
Errant transactions are transactions which have been executed on a slave only, not on the master. In short, they make a slave inconsistent with the master. When using GTID-based replication, this can cause serious troubles if the slave is promoted to a master. We have an in-depth post on this topic and we encourage you to look into it and get familiar with how to detect and fix issues with errant transactions. We also included there information how ClusterControl detects and handles errant transactions.
No Binlog File on the Master
How to identify the problem?
Under some circumstances, it may happen that a slave connects to a master and asks for non-existing binary log file. One reason for this could be the errant transaction – at some point in time, a transaction has been executed on a slave and later this slave becomes a master. Other hosts, which are configured to slave off that master, will ask for that missing transaction. If it was executed a long time ago, there is a chance that binary log files have already been purged.
Another, more typical, example – you want to provision a slave using xtrabackup. You copy the backup on a host, apply the log, change the owner of MySQL data directory – typical operations you do to restore a backup. You execute
SET GLOBAL gtid_purged=based on the data from xtrabackup_binlog_info and you run CHANGE MASTER TO … MASTER_AUTO_POSITION=1 (this is in MySQL, MariaDB has a slightly different process), start the slave and then you end up with an error like:
Last_IO_Error: Got fatal error 1236 from master when reading data from binary log: 'The slave is connecting using CHANGE MASTER TO MASTER_AUTO_POSITION = 1, but the master has purged binary logs containing GTIDs that the slave requires.'in MySQL or:
Last_IO_Error: Got fatal error 1236 from master when reading data from binary log: 'Could not find GTID state requested by slave in any binlog files. Probably the slave state is too old and required binlog files have been purged.'in MariaDB.
This basically means that the master doesn’t have all binary logs needed to execute all missing transactions. Most likely, the backup is too old and the master already purged some of binary logs created between the time when backup was created and when the slave was provisioned.
How to solve this problem?
Unfortunately, there’s not much you can do in this particular case. If you have some MySQL hosts which store binary logs for longer time than the master, you can try to use those logs to replay missing transactions on the slave. Let’s take a look how it can be done.
First of all, let’s take a look at the oldest GTID in the master’s binary logs:
mysql> SHOW BINARY LOGSG
*************************** 1. row ***************************
 Log_name: binlog.000021
File_size: 463
1 row in set (0.00 sec)
So, ‘binlog.000021’ is the latest (and only) file. Let’s check what’s the first GTID entry in this file:
root@master:~# mysqlbinlog /var/lib/mysql/binlog.000021
/*!50530 SET @@SESSION.PSEUDO_SLAVE_MODE=1*/;
/*!50003 SET @OLD_COMPLETION_TYPE=@@COMPLETION_TYPE,COMPLETION_TYPE=0*/;
DELIMITER /*!*/;
# at 4
#170320 10:39:51 server id 1  end_log_pos 123 CRC32 0x5644fc9b     Start: binlog v 4, server v 5.7.17-11-log created 170320 10:39:51
# Warning: this binlog is either in use or was not closed properly.
BINLOG '
d7HPWA8BAAAAdwAAAHsAAAABAAQANS43LjE3LTExLWxvZwAAAAAAAAAAAAAAAAAAAAAAAAAAAAAA
AAAAAAAAAAAAAAAAAAAAAAAAEzgNAAgAEgAEBAQEEgAAXwAEGggAAAAICAgCAAAACgoKKioAEjQA
AZv8RFY=
'/*!*/;
# at 123
#170320 10:39:51 server id 1  end_log_pos 194 CRC32 0x5c096d62     Previous-GTIDs
# 5d1e2227-07c6-11e7-8123-080027495a77:1-1106668
# at 194
#170320 11:21:26 server id 1  end_log_pos 259 CRC32 0xde21b300     GTID    last_committed=0    sequence_number=1
SET @@SESSION.GTID_NEXT= '5d1e2227-07c6-11e7-8123-080027495a77:1106669'/*!*/;
# at 259
As we can see, the oldest binary log entry that’s available is: 5d1e2227-07c6-11e7-8123-080027495a77:1106669
We need also to check what’s the last GTID covered in the backup:
root@slave1:~# cat /var/lib/mysql/xtrabackup_binlog_info
binlog.000017    194    5d1e2227-07c6-11e7-8123-080027495a77:1-1106666
It is: 5d1e2227-07c6-11e7-8123-080027495a77:1-1106666 so we lack two events:
5d1e2227-07c6-11e7-8123-080027495a77:1106667-1106668
Let’s see if we can find those transactions on other slave.
mysql> SHOW BINARY LOGS;
+---------------+------------+
| Log_name      | File_size  |
+---------------+------------+
| binlog.000001 | 1074130062 |
| binlog.000002 |  764366611 |
| binlog.000003 |  382576490 |
+---------------+------------+
3 rows in set (0.00 sec)
It seems that ‘binlog.000003’ is the latest binary log. We need to check if our missing GTID’s can be found in it:
slave2:~# mysqlbinlog /var/lib/mysql/binlog.000003 | grep "5d1e2227-07c6-11e7-8123-080027495a77:110666[78]"
SET @@SESSION.GTID_NEXT= '5d1e2227-07c6-11e7-8123-080027495a77:1106667'/*!*/;
SET @@SESSION.GTID_NEXT= '5d1e2227-07c6-11e7-8123-080027495a77:1106668'/*!*/;
Please keep in mind that you may want to copy binlog files outside of the production server as processing them can add some load. As we verified that those GTID’s exist, we can extract them:
slave2:~# mysqlbinlog --exclude-gtids='5d1e2227-07c6-11e7-8123-080027495a77:1-1106666,5d1e2227-07c6-11e7-8123-080027495a77:1106669' /var/lib/mysql/binlog.000003 > to_apply_on_slave1.sqlAfter a quick scp, we can apply those events on the slave
slave1:~# mysql -ppass < to_apply_on_slave1.sqlOnce done, we can verify if those GTID’s have been applied by looking into the output of SHOW SLAVE STATUS:
                Last_IO_Error: Got fatal error 1236 from master when reading data from binary log: 'The slave is connecting using CHANGE MASTER TO MASTER_AUTO_POSITION = 1, but the master has purged binary logs containing GTIDs that the slave requires.'
               Last_SQL_Errno: 0
               Last_SQL_Error:
  Replicate_Ignore_Server_Ids:
             Master_Server_Id: 1
                  Master_UUID: 5d1e2227-07c6-11e7-8123-080027495a77
             Master_Info_File: mysql.slave_master_info
                    SQL_Delay: 0
          SQL_Remaining_Delay: NULL
      Slave_SQL_Running_State: Slave has read all relay log; waiting for more updates
           Master_Retry_Count: 86400
                  Master_Bind:
      Last_IO_Error_Timestamp: 170320 10:45:04
     Last_SQL_Error_Timestamp:
               Master_SSL_Crl:
           Master_SSL_Crlpath:
           Retrieved_Gtid_Set:
            Executed_Gtid_Set: 5d1e2227-07c6-11e7-8123-080027495a77:1-1106668
Executed_GTID_set looks good therefore we can start slave threads:
mysql> START SLAVE;
Query OK, 0 rows affected (0.00 sec)
Let’s check if it worked fine. We will, again, use SHOW SLAVE STATUS output:
           Master_SSL_Crlpath:
           Retrieved_Gtid_Set: 5d1e2227-07c6-11e7-8123-080027495a77:1106669
            Executed_Gtid_Set: 5d1e2227-07c6-11e7-8123-080027495a77:1-1106669
Looks good, it’s up and running!
Another method of solving this problem will be to take a backup one more time and provision the slave again, using fresh data. This will quite likely be faster and definitely more reliable. It is not often that you have different binlog purge policies on master and on slaves)
We will continue discussing other types of replication issues in Troubleshooting MySQL Replication: Part Two. And don’t forget to check out ClusterControl free for 30 days to see how you can make your MySQL operations more transparent, efficient, and consistent.